craig.cahillane@LIGO.ORG - posted 18:47, Thursday 12 May 2016 - last comment - 16:49, Friday 13 May 2016(27154)
Calibration Kappa Covariance Triangle Plots
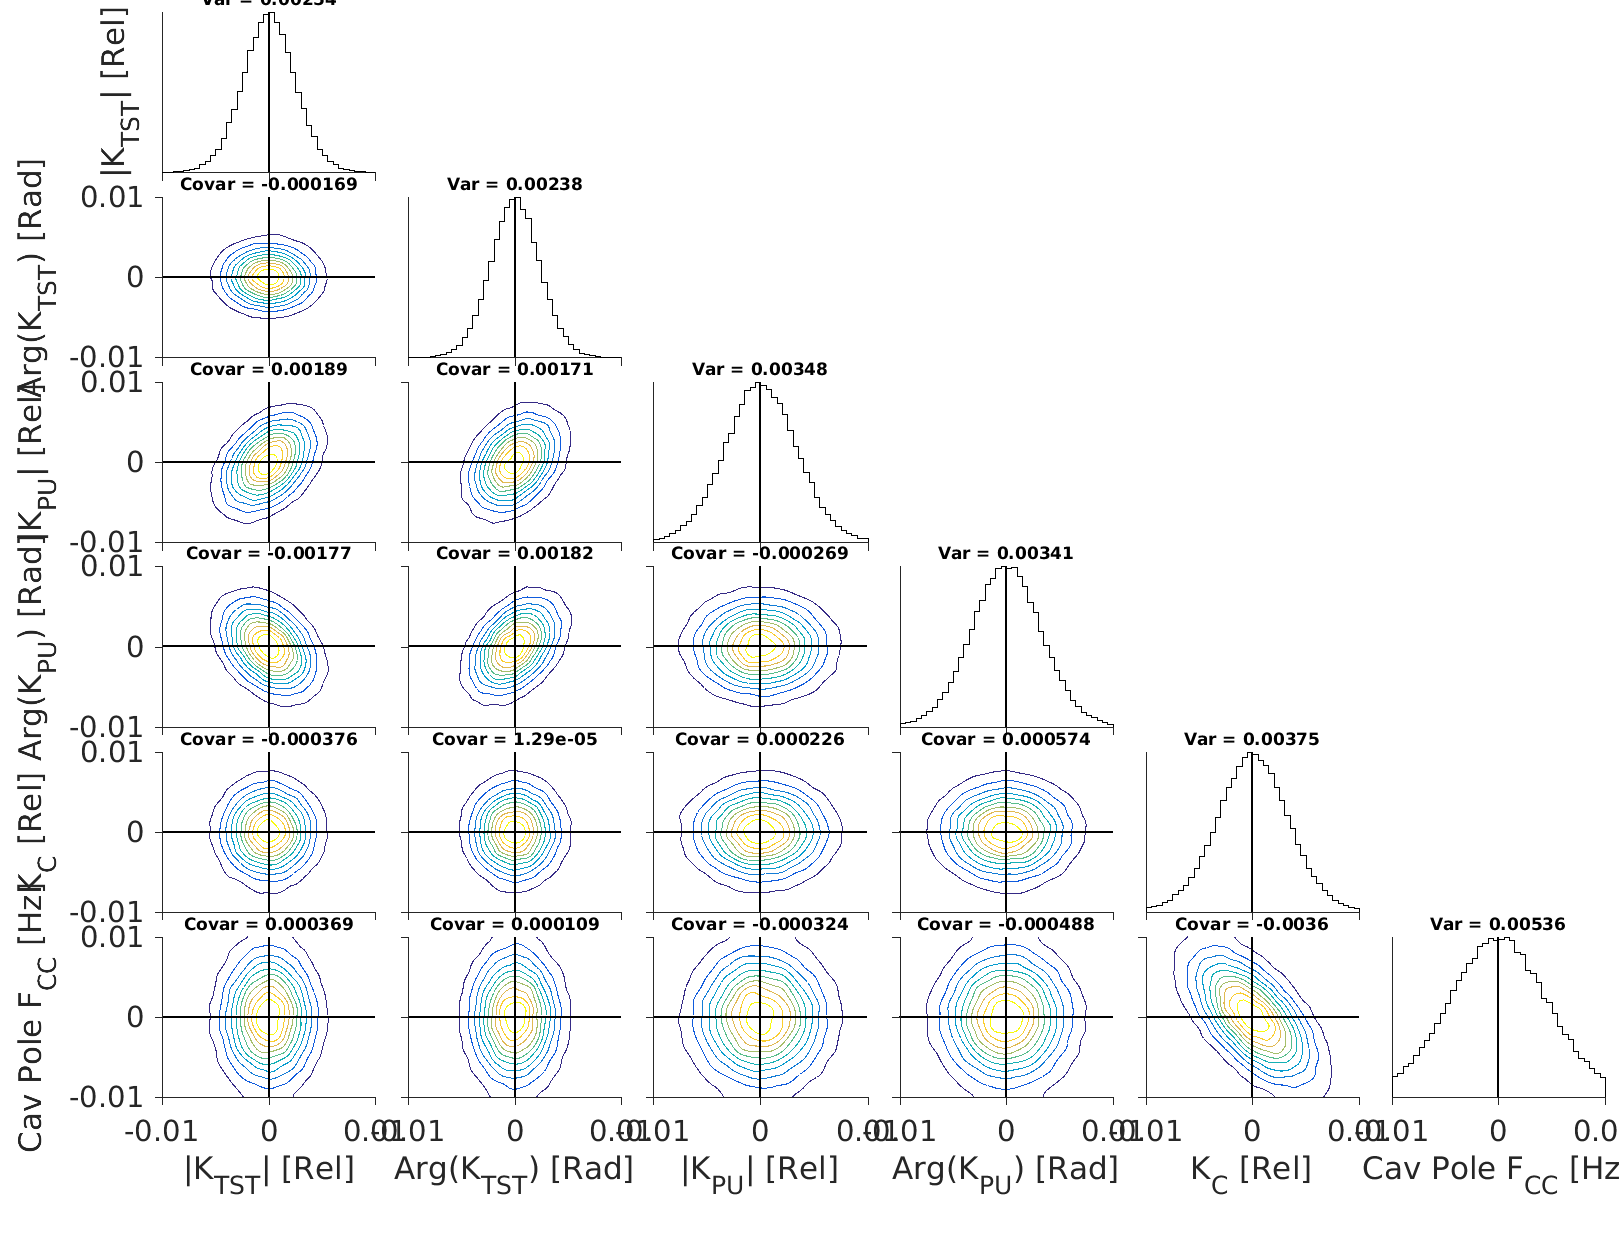
C. Cahillane

I have generated corner plots of the time-dependent kappas to check their covariance.

There are six kappa values:
1) Kappa_tst Mag
2) Kappa_tst Phase [Rads]
3) Kappa_pu Mag
4) Kappa_pu Phase [Rads]
5) Kappa_C
6) Cavity Pole F_CC

We do get some values of covariance that are comparable with variance... However, all values, including variance, are sub-percent.
I anticipate that if propagated into the uncertainty budget, all covariant terms would be negligible.  We cannot be sure, however, without doing the work.

For the LLO Kappa Triangle Plots, please see LLO aLOG 26134
Images attached to this report
Comments related to this report
J. Kissel, C. Cahillane

A couple of notes from a discussion between Craig and I about these results:
(1) The "Var" and "Covar" results reported on the plots are actually the square root of the respective element in the covariance matrix, multiplied by the sign of the element. Thus the reported "Var" and "Covar" value is directly comparable to the uncertainty typically reported, but the off-diagonal elements retain the sign information of the covariance.

(2) Lest ye be confused -- the (co)variances (which are actually uncertainty values) are report at the *top* of each sub-plot, and the upper most variance value (for |k_TST|) is cut off. The value is 0.00234.

(3) In order to compute the statistical uncertainty of these time-dependent systematic errors for the C02 uncertainty, Craig computed a running median (where the width of the median range was 50, once-a-minute data points; +/- 25 points surrounding the given time's data point) over the entire O1 time series, subtracted that median from every given data point, and took the standard deviation of residual time-series assuming that what remains is representative of the Guassian noise on the measurement. See original results in LHO aLOG 26580, though that log reports a range of 100 (+/- 50) once-a-minute points which has since been changed to the above-mentioned +/- 25 points for a more physical time-scale (but only changes the results at the 5% of the reported already ~0.3-0.5% uncertainty, i.e. the reported relative uncertainty of 0.002 change by 0.00005).

For these plots, where he went a step further and computed the full covariance matrix on all time-dependent factors in order to address the question "is there any covariance between the statistical uncertainties, given that they're computed using -- in some cases -- the same calibration line?"). In doing so, he'd first taken the exact same median-removed time-series for each time-dependent factor, but found that the data set (i.e. the 2D and 1D histograms) was artificially biased around zero. We know now this was because, often, the median *was* the given time's value and residual was zero. Thus, instead, he recomputed the running median, disallowing the given time's value to be used in the median calculation. Graphically,

    x   x x     x         x           x  x
      x    x x    x   x      x x  x    x   x
         x     x x      x  x     x  x      x x
        [------------\_/-------------]
  x   Raw data
 \_/  Given time's central value to which a median will be assigned and subtracted.
[---] Median Window

As one can see in his attached plots, that successfully de-biases the histogram.


(4) The following time-dependent systematic error uncertainties *are* indeed covariant:
    (a) kappa_TST with kappa_PU (in magnitude and phase) -- the actuation strength of the PUM and TST mass stages.
    (b) kappa_C with f_cc -- the IFO optical gain and cavity pole frequency

    We know and expect (b), as has been shown in Evan's note T1500533. What's more is that it's *negatively covariant, so what estimation of the uncertainty we have thus far been making -- ignoring the covariant terms -- is actually an over estimate, and all is "OK."

    We also expect (a), because of how the two terms are calculated (see T1500377) and because they're also calculated from the same pair of lines. Sadly, we see that sqrt(covariance) is *positive* and of comparable amplitude to the sqrt(variance). But -- said at little more strongly than Craig suggests -- for these terms that have positive covariance comparable to the variance, the absolute value of both variance and covariance corresponds to an uncertainty (i.e. sqrt(variance)) on the 0.3-0.5% level, which is much smaller than other dominant terms in the uncertainty, as can be seen for example in pgs 3 and 4 of the attachment "05-Jan-2016_LHO_Strain_Uncertainty_C03_All_Plots.pdf" in LHO aLOG 24709.

As such, we deem it sufficient to continue to ignore all covariant terms in the statistical uncertainty of these time-dependent parameters because they're either negative or, where positive, contribute a negligible amount to the overall statistical uncertainty budget compared with other, static statistical uncertainty terms.