craig.cahillane@LIGO.ORG - posted 19:50, Wednesday 18 May 2016 - last comment - 14:46, Thursday 19 May 2016(27290)
LHO Actuation Stages Covariance
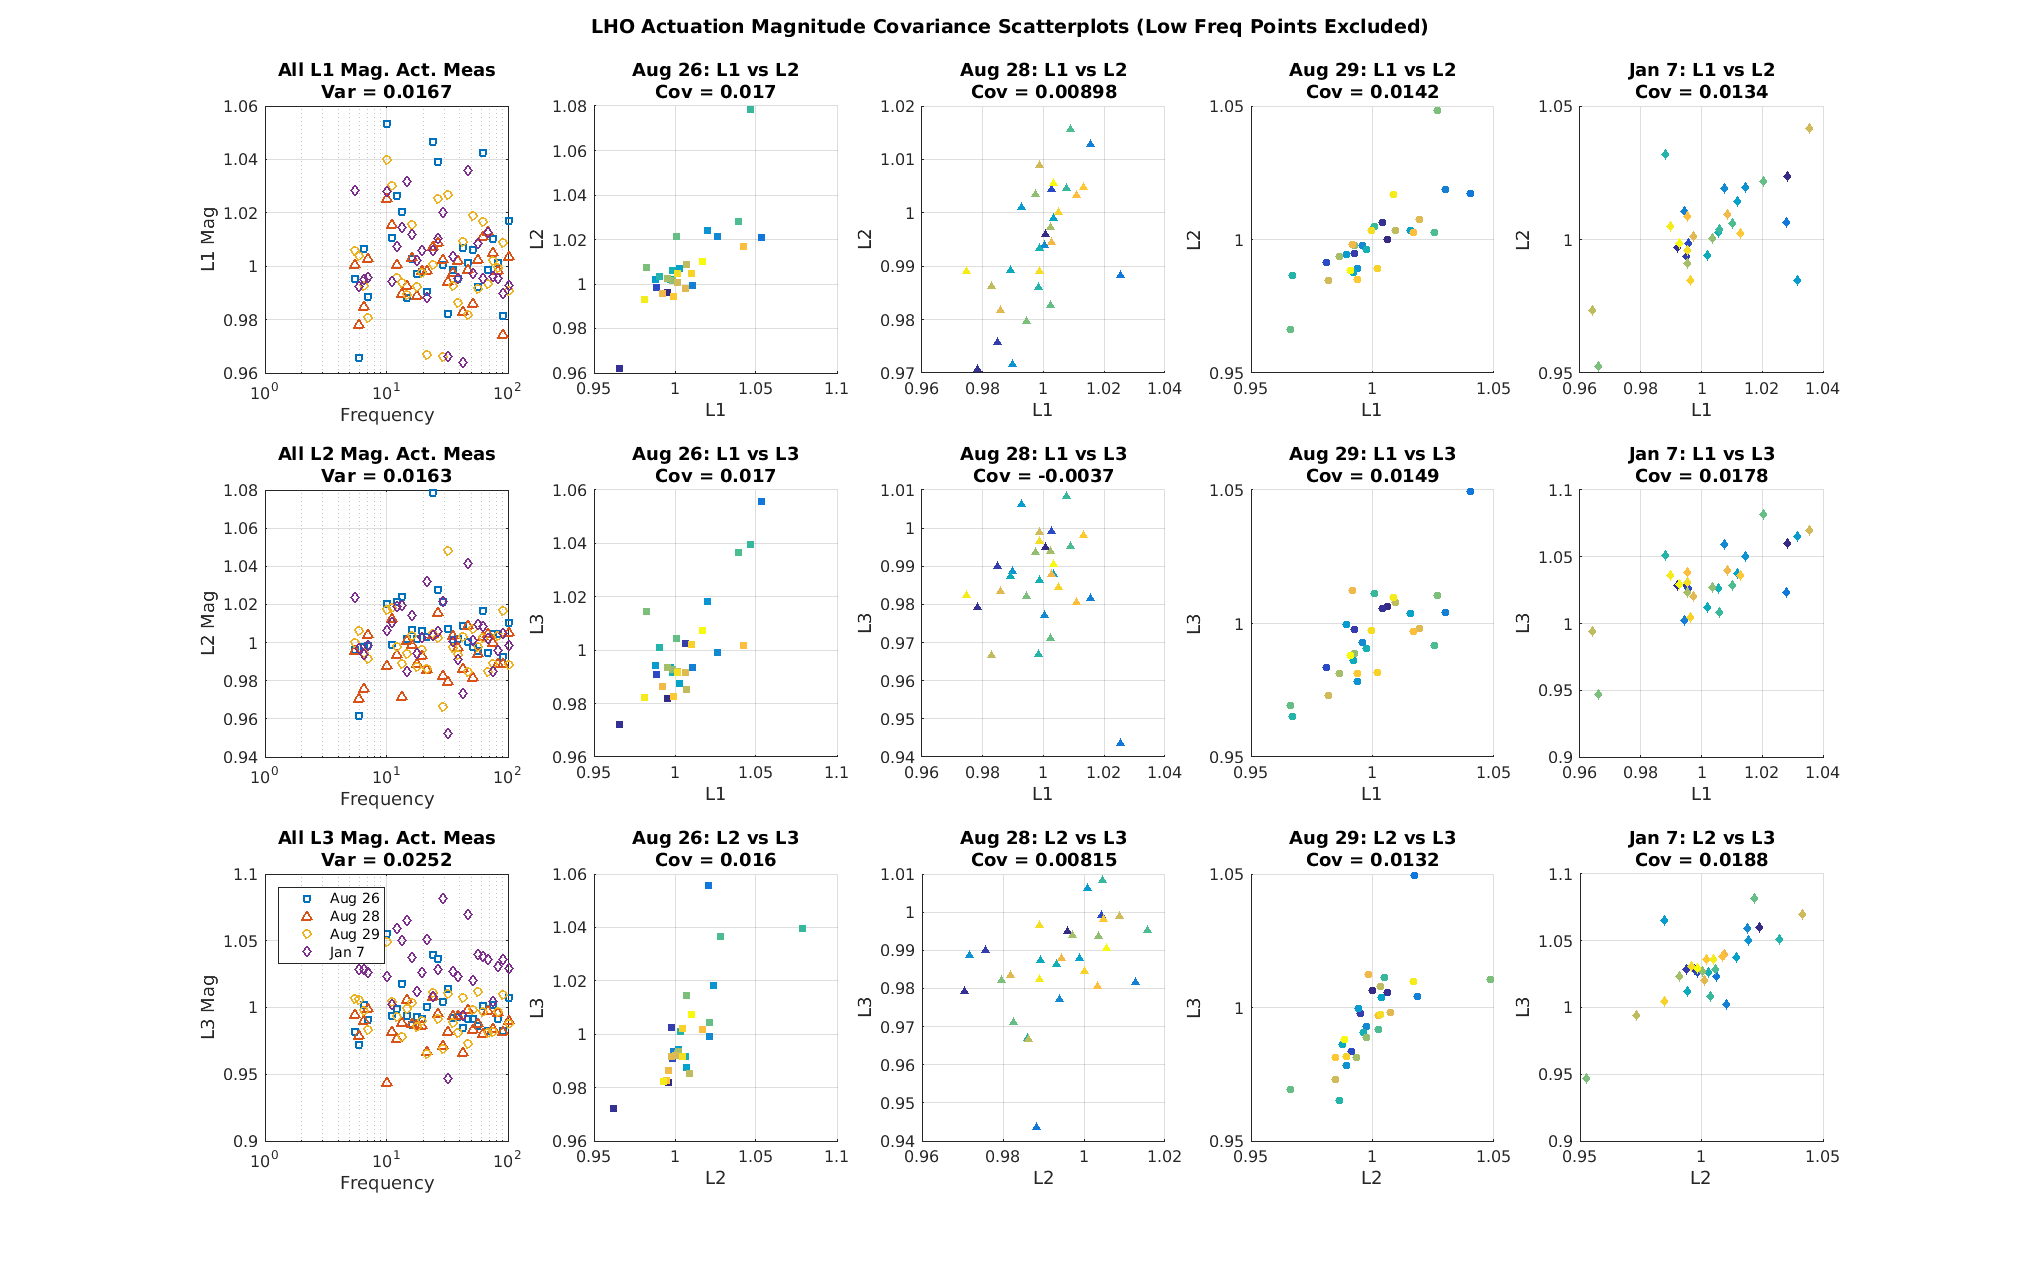
C. Cahillane

I have looked at the actuation strengths to check the covariance between the actuation stages for each of the four measurements.
The four measurements are the three calibration week actuation measurements on August 26, 28, and 29, and the Post O1 January 7 measurement.
The covariance was calculated by taking the residuals of the fitted actuation strengths and comparing points between L1 and L2, L1 and L3, and L2 and L3 at the same frequency for each day's measurement.

The different dots in the covariance plots correspond to frequency.  The dark blue is low frequency, and the light orange is high frequency.

The covariance is on the same order as the overall variance for each actuation stage.  Worse still, it is positively correlated, meaning we may have underestimated uncertainty by ignoring these terms.

My results also indicate the measurements may be inconsistent between days.  The August 28 measurement inexplicably displays no covariance between actuation stages, while all of the other measurements do.  Jeff has tried looking at the optical gain fluctuations during each day's measurements, but this doesn't appear to be the cause.
Images attached to this report
Comments related to this report
J. Kissel, C. Cahillane, K. Izumi

Some more details on this. For context about why the discovery of this ~1-2%-level, positive sqrt(covariance) matters, check out G1601084. In this aLOG, we're discussing scenario (4)(c), where because we use the same PCAL to DARM transfer function to provide the absolute calibration for each ith Stage EXC to DARM transfer function, there may potentially be covariance between the ith and jth stage's absolute calibration result.

We would expect this to happen if the PCAL2DARM transfer function has some very-low-frequency, statistical-in-nature fluctuation over the course of the entire ~30 minute measurement that is larger than any similar fluctuation in the ithStage2DARM transfer function.

Craig's results above show that for 3 out the 4 days, the above scenario must be true -- that there is some slow stochastic process that is influencing the PCAL2DARM transfer function that's larger than whatever process (either the same or different) in the ith Stage EXC 2 DARM transfer function, so there is covariance between our estimate of the statistical uncertainty in the ith and jith stage.

In the right 4 columns of the 3x5 array of subplots, which show this covariance between the i and jth stage, and the 4 columns are the four measurement days. We can see by the color-coding of each frequency point [as Craig says, blue to orange is denoting low to high frequency] that it's *not* that, say, the low frequency points are more covariant than the high frequency points, or vice versa.

What's most intriguing is that the covariance seems to be a function of measurement day, and the *least* covariant day is the 2015-08-28 measurement.

*A* theory for why the covariance may vary from day to day is the optical gain of the IFO (i.e. the DARM part of the PCAL2DARM TF) is slowly fluctuating by different amplitudes from day to day based on the seismic environment. As a test of this theory, I've gathered the times of all of the measurements used to compose these data sets, and plotted the optical gain (as measured by the intra-cavity arm power, as reported by the average of the TRANSMON QPD SUM). From this time-series, I assume that the optical gain is fluctuating stochastically over the entire ~15 minute excitation period, take a histogram and report the standard deviation as a single-number, quantitative estimate of the amplitude of said fluctuation. This way, I can compare the amplitudes during the 4 measurement times.

Sadly, though we do see a change in amplitude of optical gain fluctuations between measurement days -- as large as a factor of two between the best and worst -- the pattern of optical gain fluctuation amplitude does not match the covariance amplitude pattern from measurement day to measurement day. The covariance is comparable on days 1, 3, and 4, the optical gain fluctuations are smallest during the first day of measurements, and steadily get worse in time. Further, the amplitude of optical gain fluctuation is comparable between a given measurement day's PCAL2DARM transfer function and each ith stage of EXC2DARM transfer function.

--------------
Details:
The last page of the attachment shows my attempt to use several versions of the TRANSMON QPDs in order to arrive at the intra-cavity arm power. I'm quite sad that the different methods of calibration don't agree, so I've chose to use the one the bast agrees with about what we think the intra-cavity power should be. The channels I've used are
    H1:LSC-TR_X_NORM_OUT16
    H1:LSC-TR_Y_NORM_OUT16
    H1:ASC-X_TR_A_NSUM_OUT16
    H1:ASC-X_TR_B_NSUM_OUT16
    H1:ASC-Y_TR_A_NSUM_OUT16
    H1:ASC-Y_TR_B_NSUM_OUT16
where I've used the EPICS channels sampled at 16 Hz, because I'm looking for minute-time-scale fluctuations (and there aren't so many versions stored as fast channels). All signals are normalized to the input power. For the LSC versions, at the advice of Jenne, I've taken the average of the two channels, and scaled the raw counts by the input power, PRM transmission, and arm-cavity gain, accounting for the beam splitter,

Circulating Arm Cavity Power [ct] = 0.5 * (H1:LSC-TR_X_NORM_OUT16 + H1:LSC-TR_Y_NORM_OUT16)
Circulating Arm Cavity Power [W]  = (Circulating Arm Cavity Power [ct]) * 22.5 [W] * 0.03 [W/W] * 280 [W/W] * 0.5 [W/W]

where I've trended the PSL input power to find the power into PRM, and 0.03 and 280 are well-known numbers.

For the ASC version of the signals, I'd tried following the prescription from Dan's LHO aLOG (15431), for which Sheila suggest should be the same for all four QPDs:

Circulating Arm Cavity Power [W] =  H1:ASC-X_TR_A_NSUM_OUT16 [ct]
                                    *  1/3.98       [V/V]                       % QPD Whitening Gain
                                    *  1/2621440    [W_atQPDs / ct]             % Electronics Chain Calibration (sans whitening gain)
                                    *  1/0.025      [W_afterETMS / W_atQPDs]    % Amount of light exiting the ETM than gets to QPDs
                                    *  1/3.6e-6     [W_inArm / W_afterETMs]     % ETM transmission

where I've trended the whitening gain to see that it was no longer the 18 [dB(V/V)] = 7.9 [V/V] quoted in Dan's aLOG, but 12 [dB(V/V)] = 3.98 [V/V] at the time of the first three measurements. Since getting a consistent calibration for the intra-cavity power was not the point of this study, I moved on sticking with the metric that gave the answer closest to what was expected, as mentioned above.

Script to produce these results:
/ligo/svncommon/CalSVN/aligocalibration/trunk/Runs/O1/H1/Scripts/Uncertainty/showopticalgainfluctuation_during_actuationfunctionmeasts_O1.m
Non-image files attached to this comment
