With the LASER off for most of the day, it was a good time to do these long measurements.
See Fabrice's pdf in 8284 for a good discussion of the concept. Basically, one tilts HEPI and measures how much the ISI tilts. Then you drive HEPI vertically and see how much the ISI tilts. The ratio of these results is the magnitude of the correction for the ALIGN matrix, in this case, the Z to RX and Z to RY values. There might be some consistency of the phase giving you sign information but... That is the theory. In practice, my experience is the determination of the tilts is subjective and the measurements are very sensitive to other influences and tend to not be repeatable. Back in Jan2015, using the direct (above) determination method, I found the results somewhat inconclusive and there was not enough time to do more cf 16118.
This morning, I did the skulk about search rather than the direct calc method. I'd have to say still somewhat inconclusive.
More details on the measurement--the ISI Stage1 blends are set to as high as possible. This will use the relative sensors, the CPS, to lock the Stage1 of the ISI to Stage0 and so to HEPI, below a few 100 mHz. Jim made a new blend (Imp[rove]_Hi_Blend) that only uses the L4C on Stage1 so the T240 is completely out of the loop. All sensor correction is turned off. GS13 gains are switched to low. Any tilt produced by the drive will show up as X or Y on the low frequency sensitive T240.
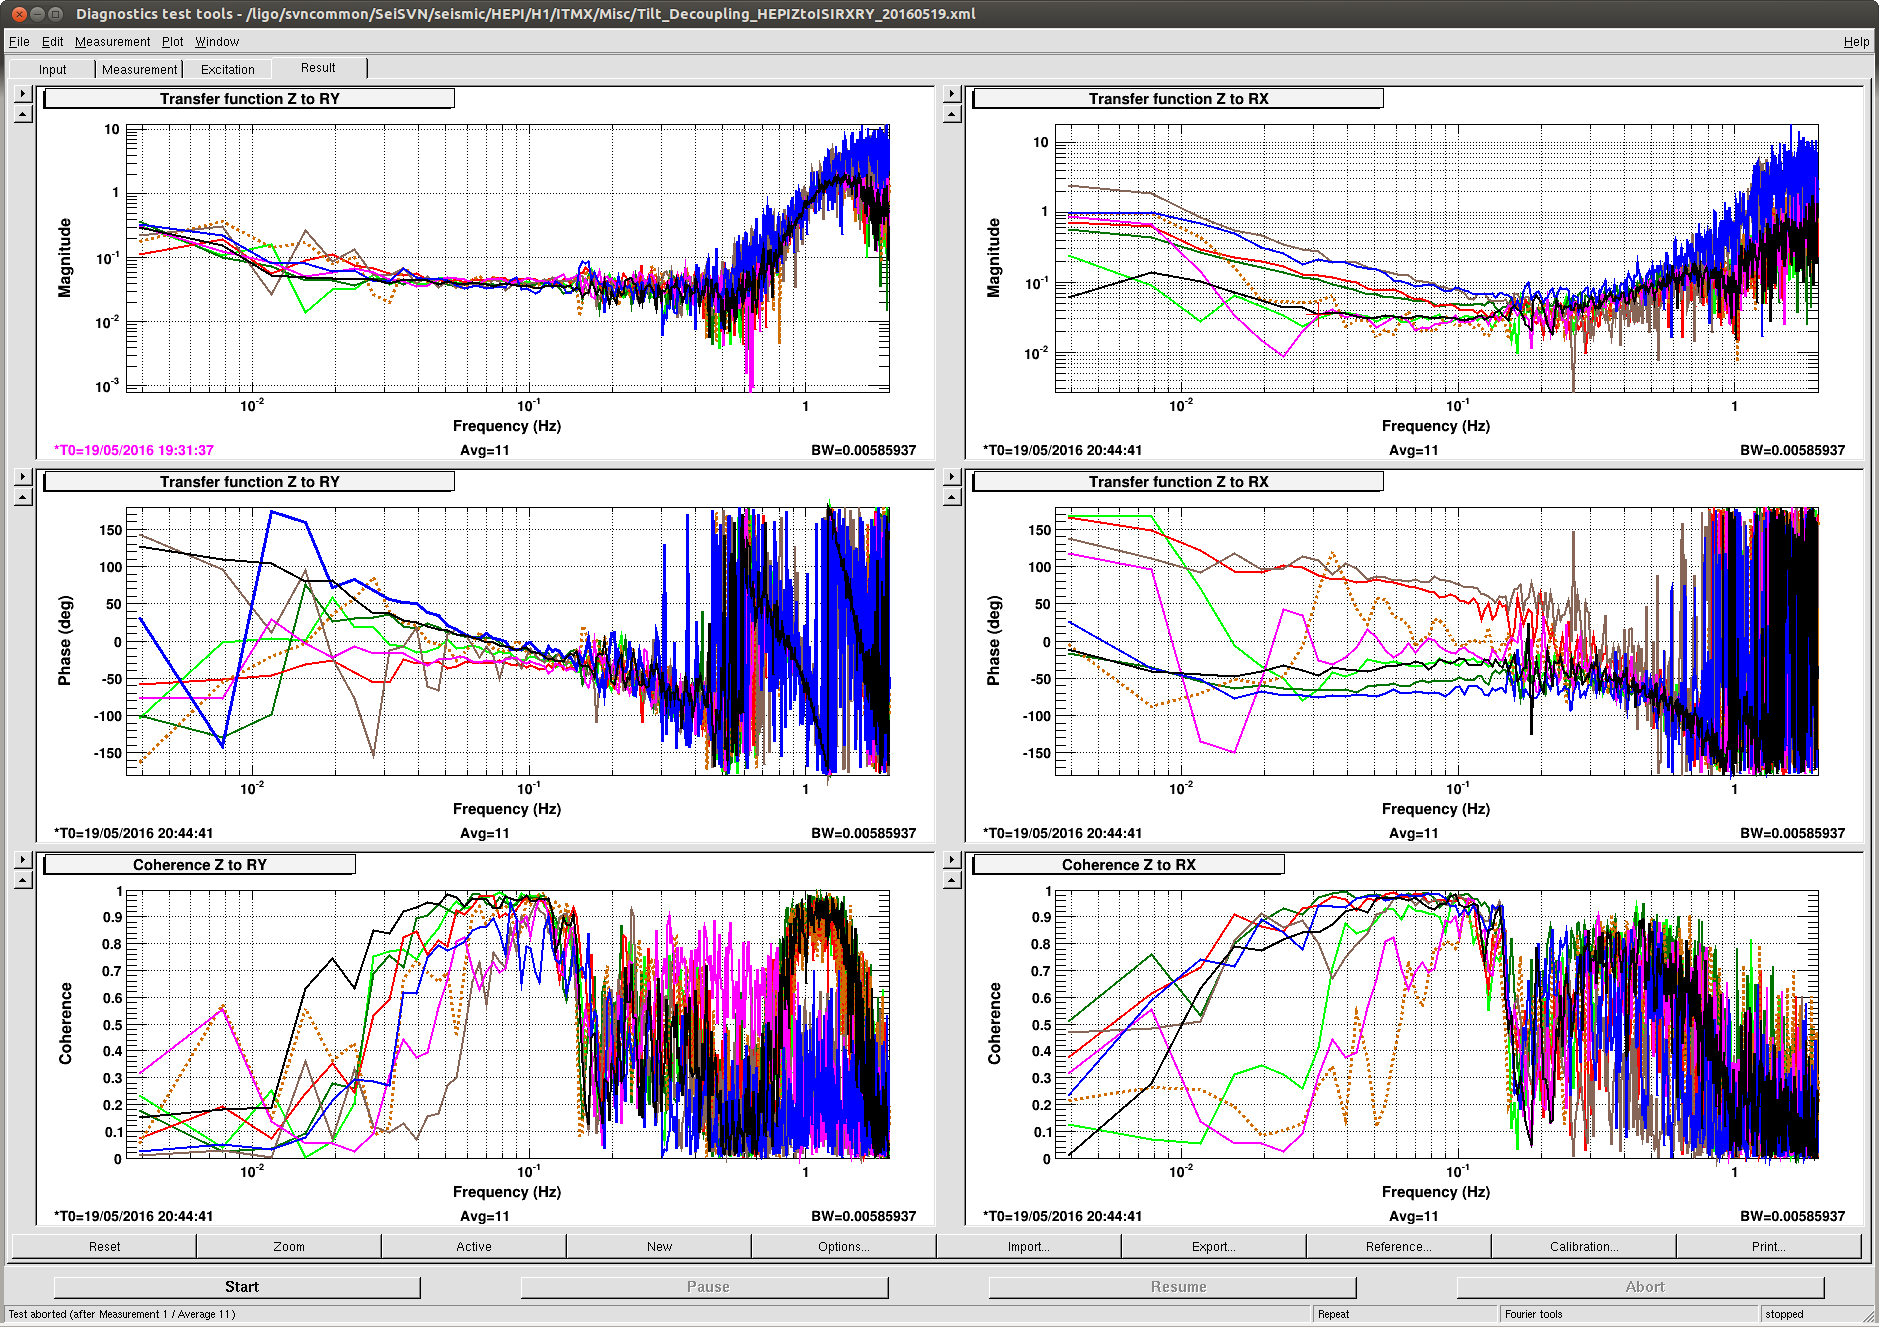
Ideally, we'd see Transfer function magnitude and coherence go down but that does not always seem to be the case. The table below gives the decoupling factors used for the TF's color seen in the attached xml plots. The channel names are all the same except Ref# so they aren't shown to keep them out of the way. The Z to RY channels are ISI-ITMX_ST1_BLND_T240X_IN1/HPI-ITMX_ISO_Z_EXC; the RX plots look at the T240Y.
| ZtoRX | ZtoRY | Color | Aves | Comments |
| 0 | .0015 | Brn Dash | 7-8 | Start values-used since Dec2014 |
| .005 | .002 | Blue | 7-8 | RY better RX worse |
| -.005 | .001 | Dark Brn | 8 | RY maybe better RX bad |
| -.0025 | .0005 | Red | 8 | RY maybe Better RX Mag Improving Coh Bad |
| .0025 | .00175 | Green | 8 | RY ehh RX Same |
| .001 | .00125 | Lt Green | 9 | RY again about same RX Good Low Mag and Coh! |
| .0005 | .00075 | Pink | 9 | RY sameo RX Mag & Coh bad again |
| .0015 | .001 | Not Show | 8 | RY repeat was not same RX Indeterminate |
| .001 | .00175 | Black | 11 | RY repeat of Green not as repeatable as hoped RX not as good as repeated Lt Grn |
I think these comments and the traces will help the reader understand the difficulty of being objective here...it is not obvious.
I've left these final (Black) value loaded. The RX magnitude is pretty good compared to the starting value and is pretty consistant with the repeat (Lt Grn) measurement although the coherence is not. The RY ... it's so not clear, I don't know, the mag looks better below 25mHz but the coherence...
XML in SeiSVN/seismic/HEPI/H1/ITMX/Misc/Tilt_Decoupling_HEPIZtoISIRXRY_20160519.xml