keith.riles@LIGO.ORG - posted 16:23, Thursday 26 May 2016 - last comment - 08:26, Friday 27 May 2016(27409)
CW injections - 24 hours with new actuation scheme
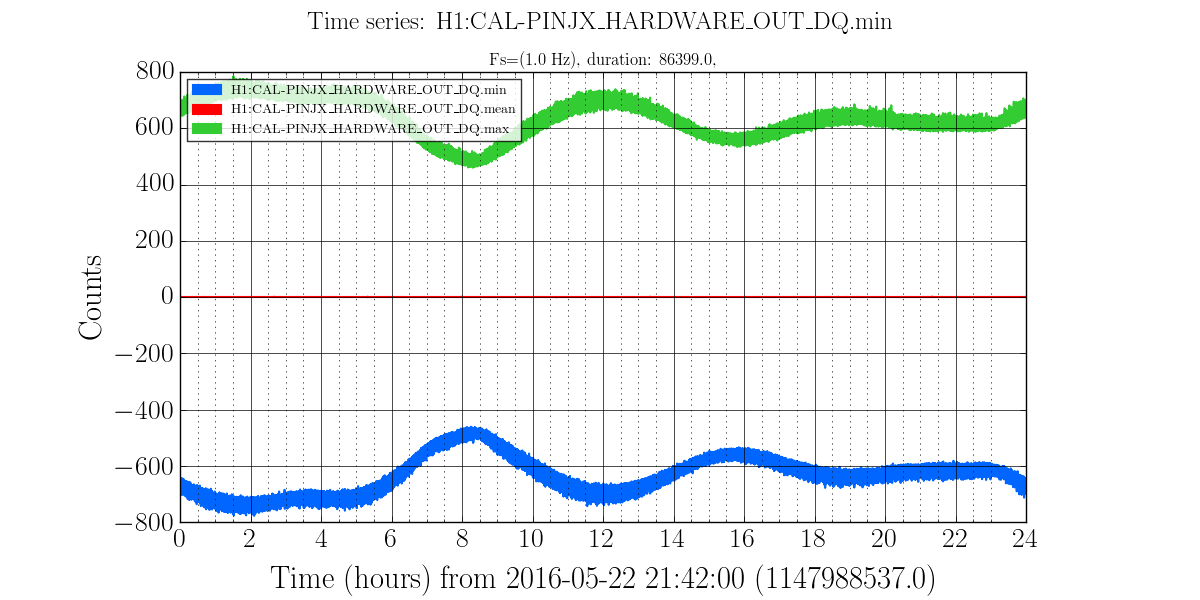
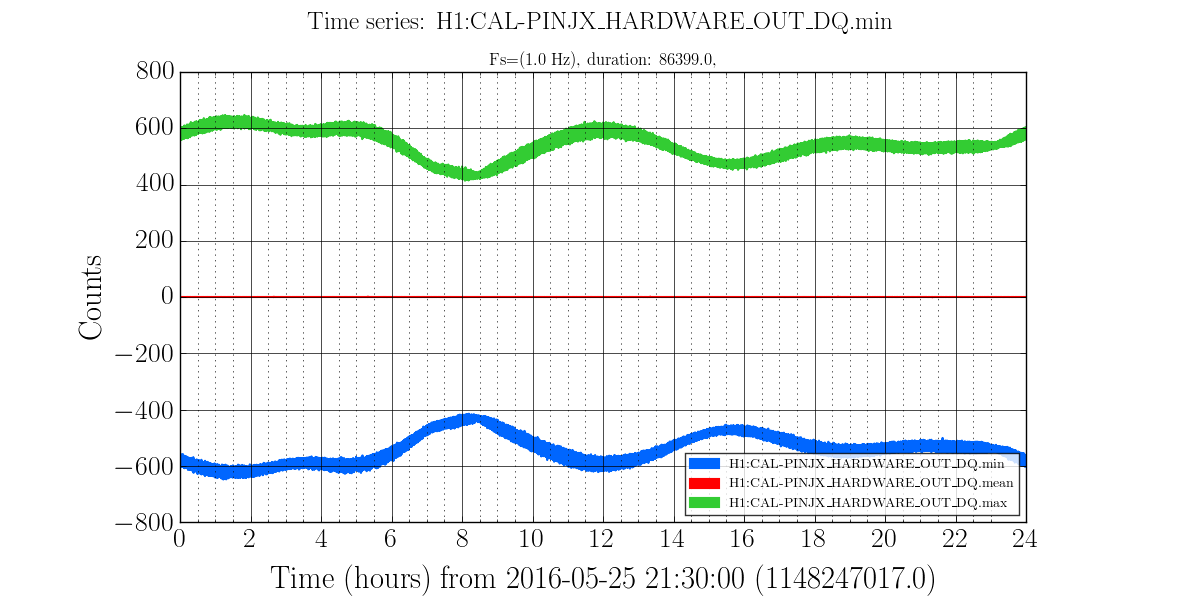
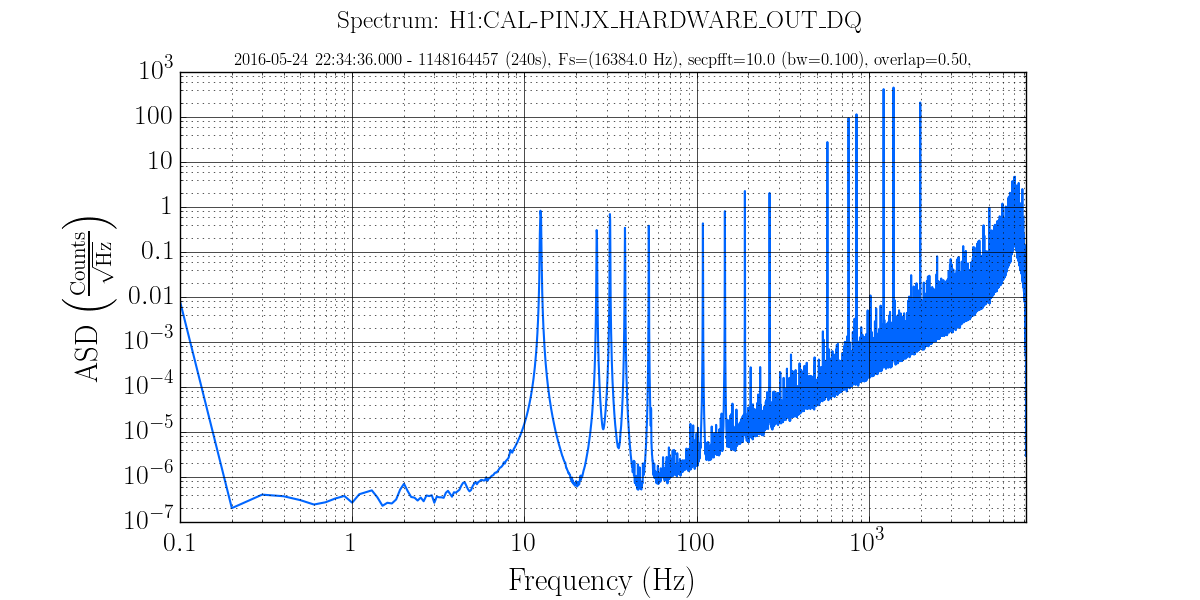
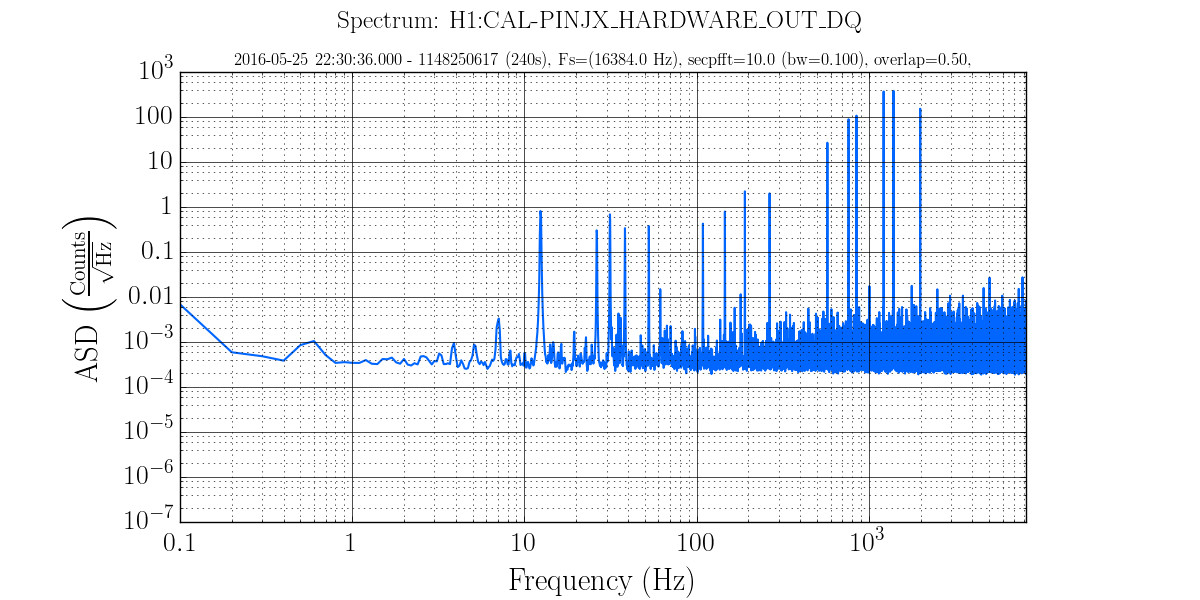
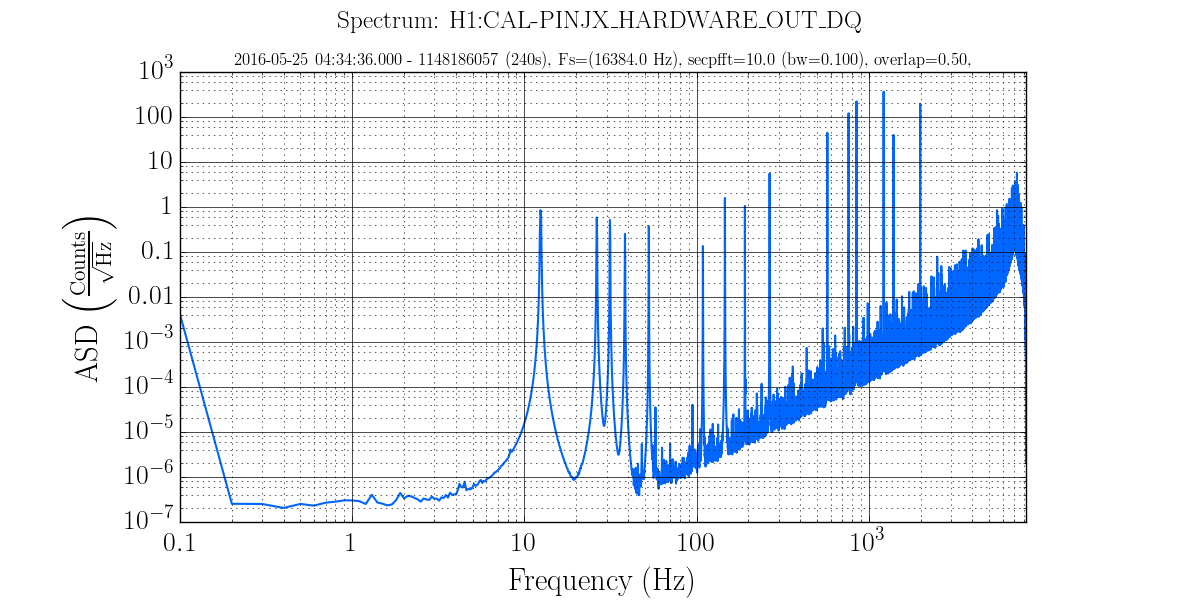
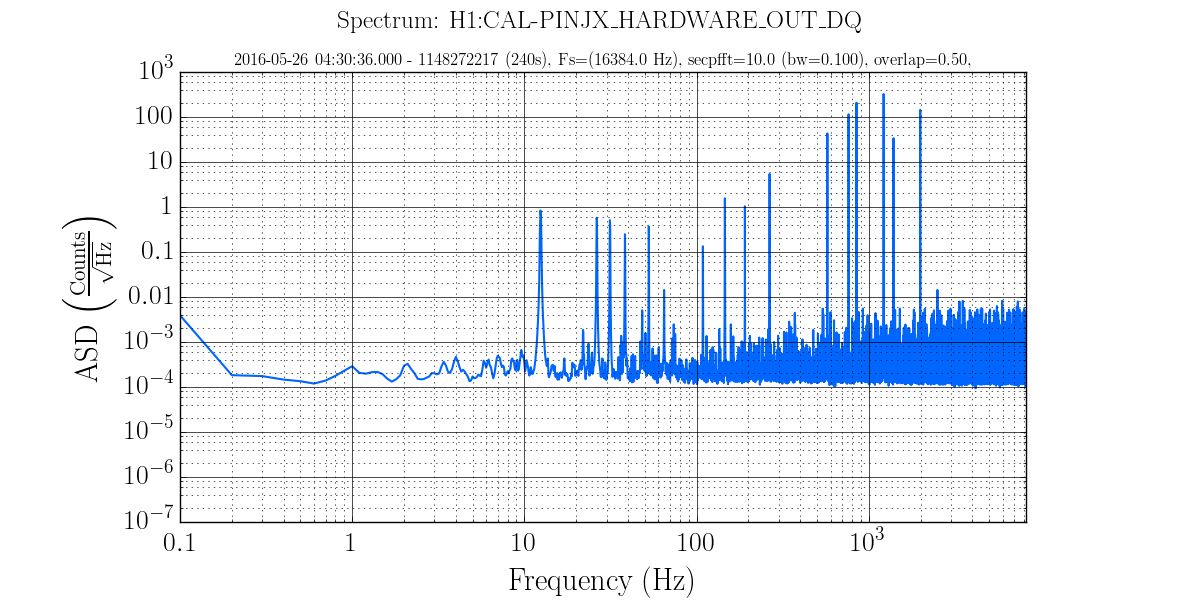
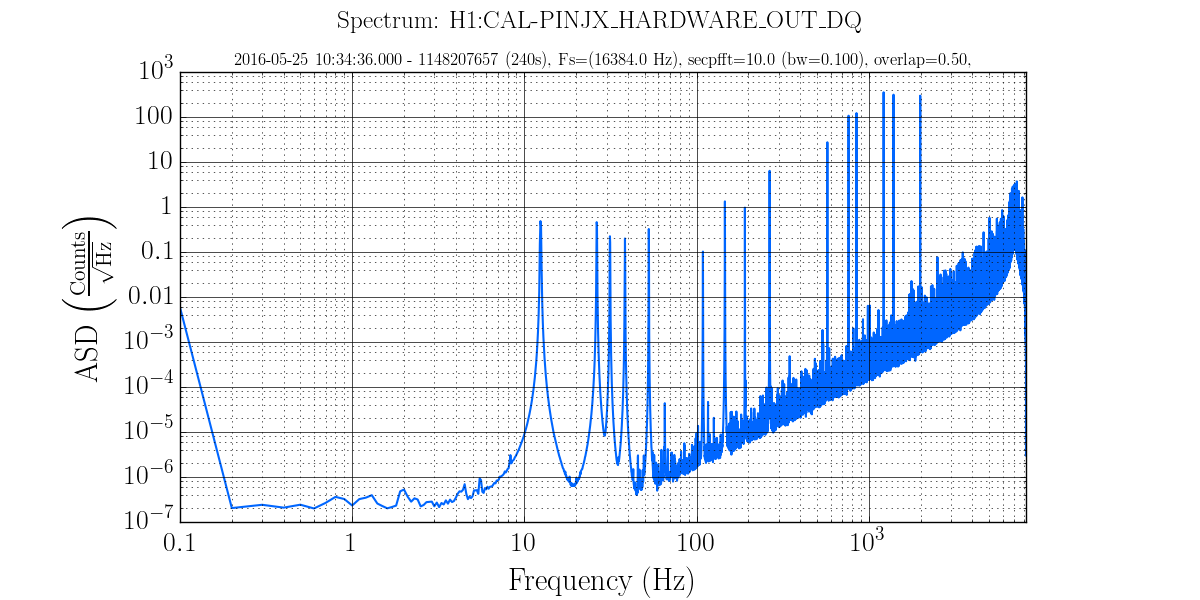
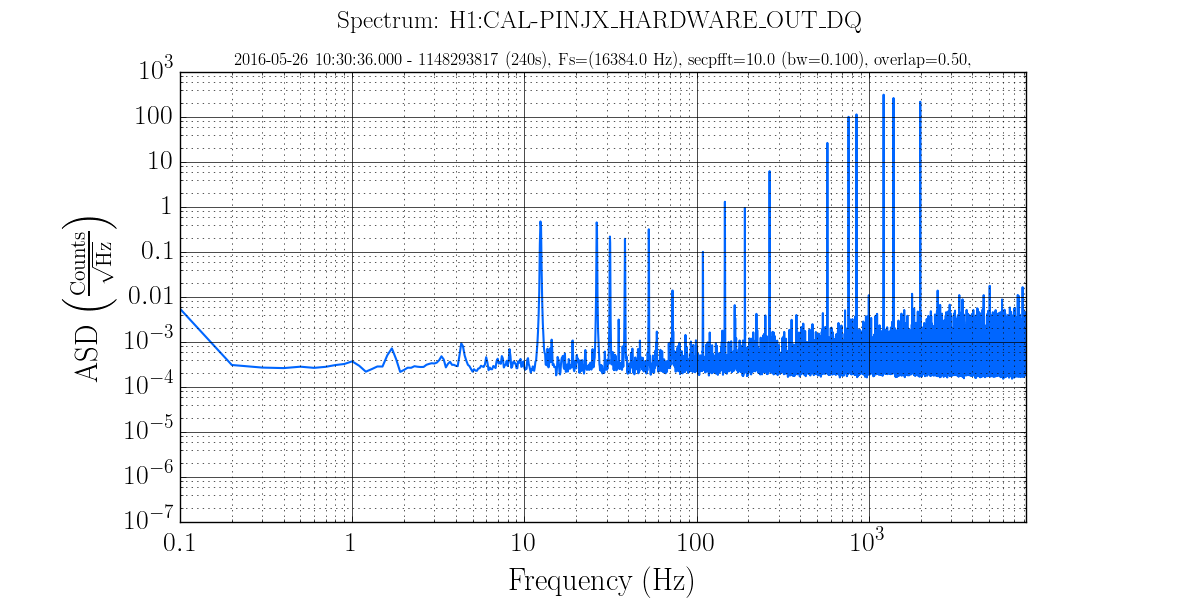
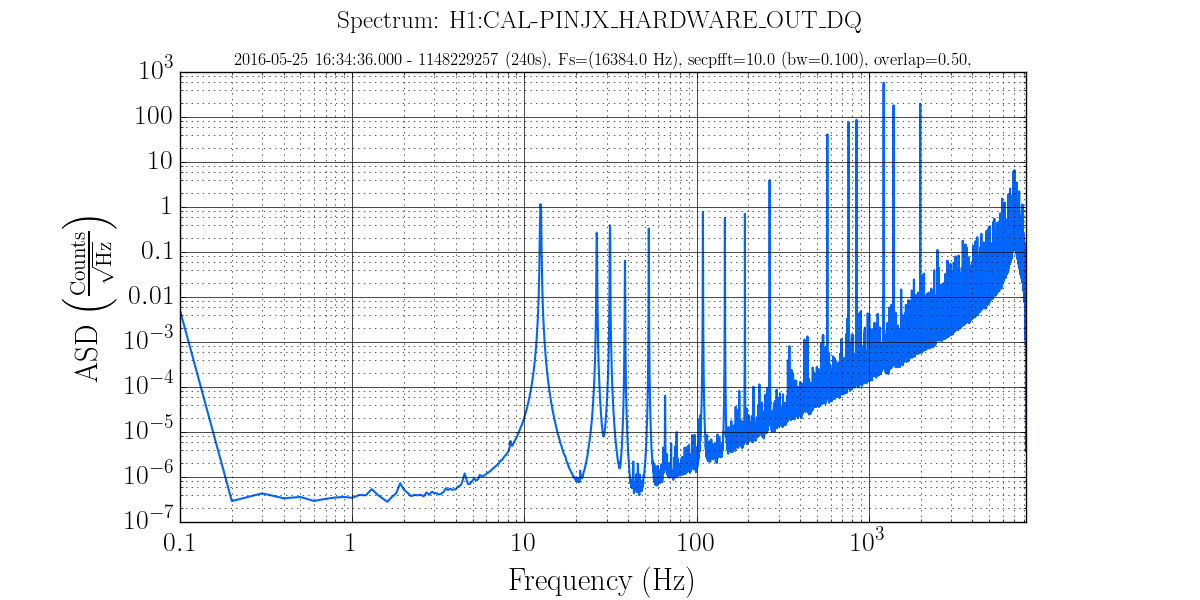
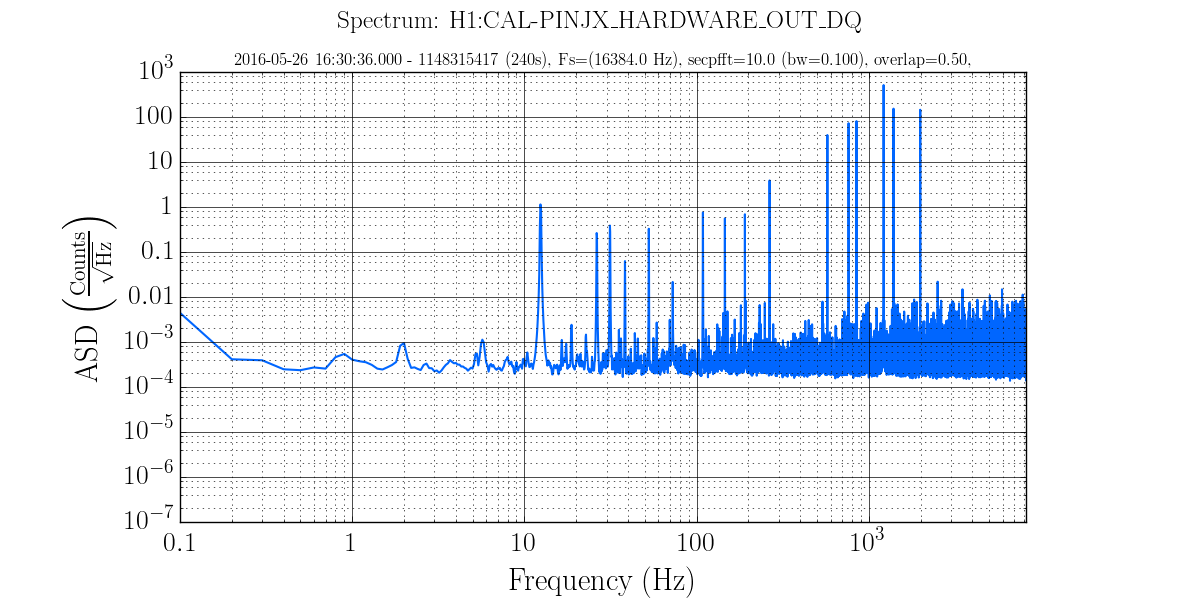
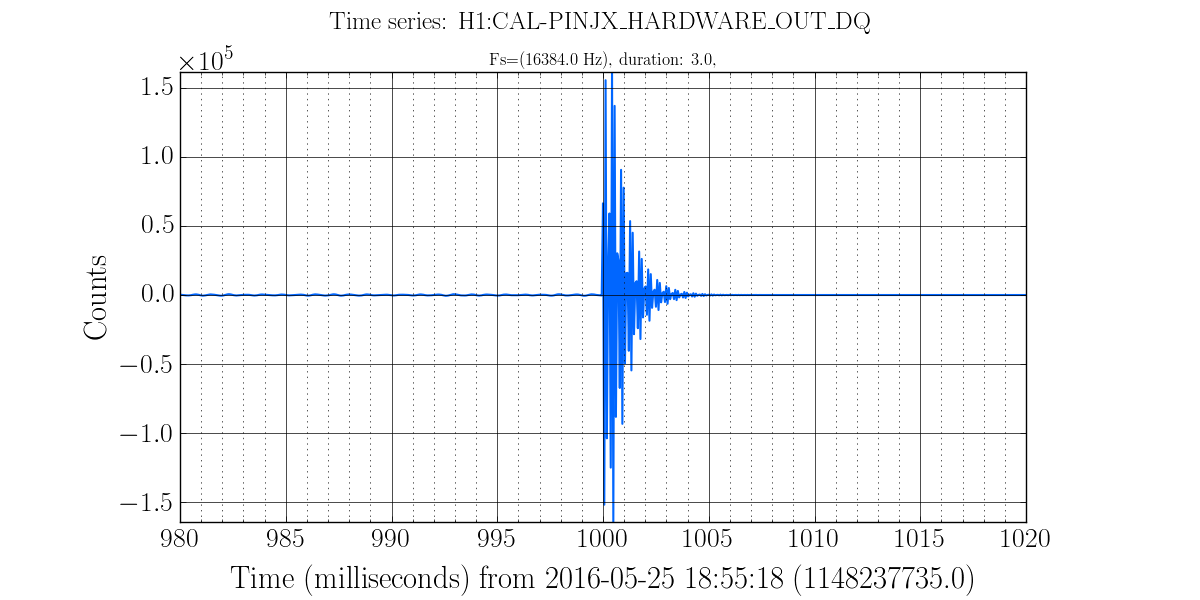
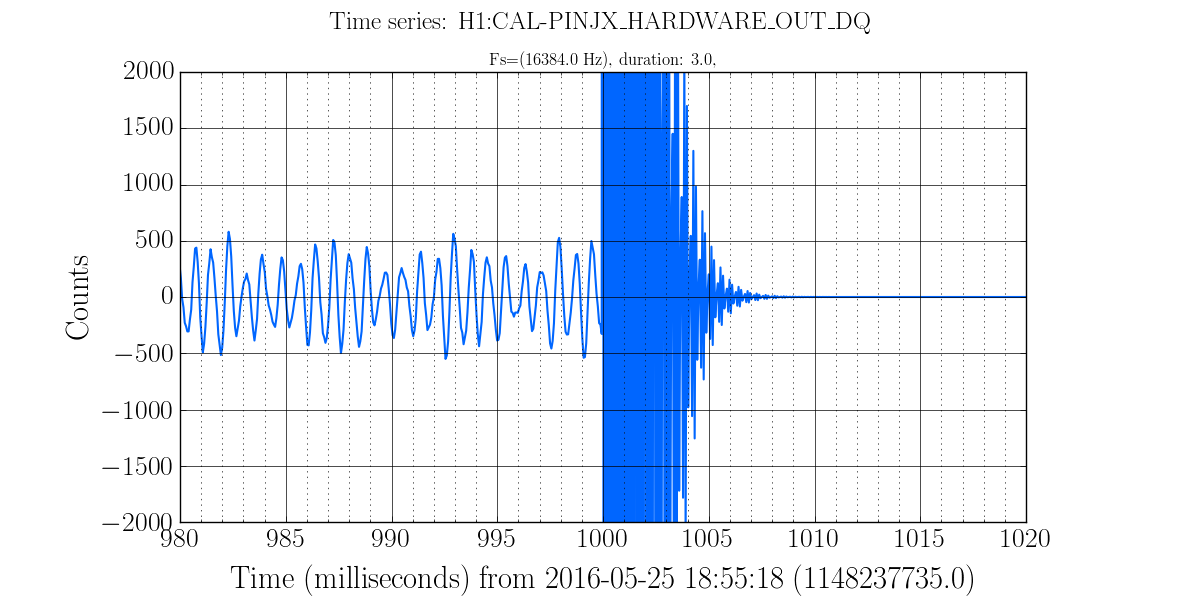
Following up on yesterday's restart of CW HW injections with a new actuation scheme,
here are comparisons over 24-hour intervals of the excitation channel H1:CAL-PINJX_HARDWARE
with what it was previously when a time-domain inverse actuation filter was used.
One benefit for transient search groups is that if sporadic CW injection dropouts are seen again in O2,
they should not induce nasty glitches in DARM (see figures 11-13 below).

The bottom line for CW searches is that things look close to what is expected, but the amplitude of the
highest-frequency pulsar injections (above 1 kHz) are significantly lower than before.

The small residual discrepancy does not seem to be explained by the difference
between the old and new inverse actuation filter curves that Evan G. posted yesterday. Perhaps both the old and new inverse actuation filters simply amplify
the 1000-2000 Hz band too much (by 20-30%)?

The figures below show 24-hour second-trend plots of the excitation channel envelope and
4-minute spectrum snapshots taken at 6-hour intervals, along with samples of sudden shutting
off of the injections.

Figure 1 - 24-hour trend (min/mean/max) of the channel for old actuation, showing the envelope of injections,
which is affected by the rotating antenna pattern of the interferometer w.r.t. 15 different
points on the sky with various intrinsic source polarization and strengths.

Figure 2 - 24-hour trend for new actuation - one can see a small drop in amplitude, driven by the highest
frequency pulsars for which the inconsistency between old inverse actuation filter and new actuation function is largest

Figure 3 - 4-minute spectrum at 22:34 UTC on May 24 (old actuation)

Figure 4 - 4-minute spectrum at 22:30 UTC on May 25 (new actuation) - approximately one sidereal day later

Figure 5 - 4-minute spectrum at 04:34 UTC on May 25 (old actuation)

Figure 6 - 4-minute spectrum at 04:30 UTC on May 26 (new actuation) - approximately one sidereal day later

Figure 7 - 4-minute spectrum at 10:34 UTC on May 25 (old actuation)

Figure 8 - 4-minute spectrum at 10:30 UTC on May 26 (new actuation) - approximately one sidereal day later

Figure 9 - 4-minute spectrum at 10:34 UTC on May 25 (old actuation)

Figure 10 - 4-minute spectrum at 10:30 UTC on May 26 (new actuation) - approximately one sidereal day later

Figure 11 - Glitch induced by sudden shutoff of CW injections with old inverse actuation filter

Figure 12 - Vertical zoom of glitch

Figure 13 - No glitch induced by shutoff of CW injections with new direct application of inverse actuation function


Note that the new trend (Figure 2) is a little smoother than the old one, as expected,
without the amplification of tiny glitches seen with the old inverse filter. Another
manifestation is the much cleaner noise floors seen in the new spectra, away from
the injected lines.
Images attached to this report
Comments related to this report
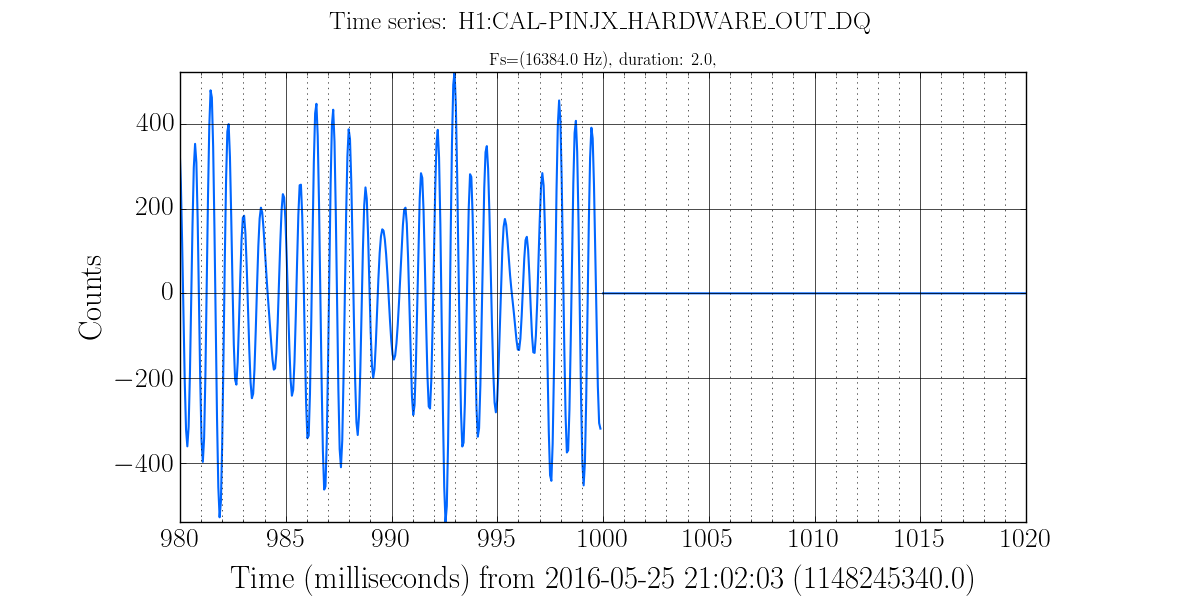
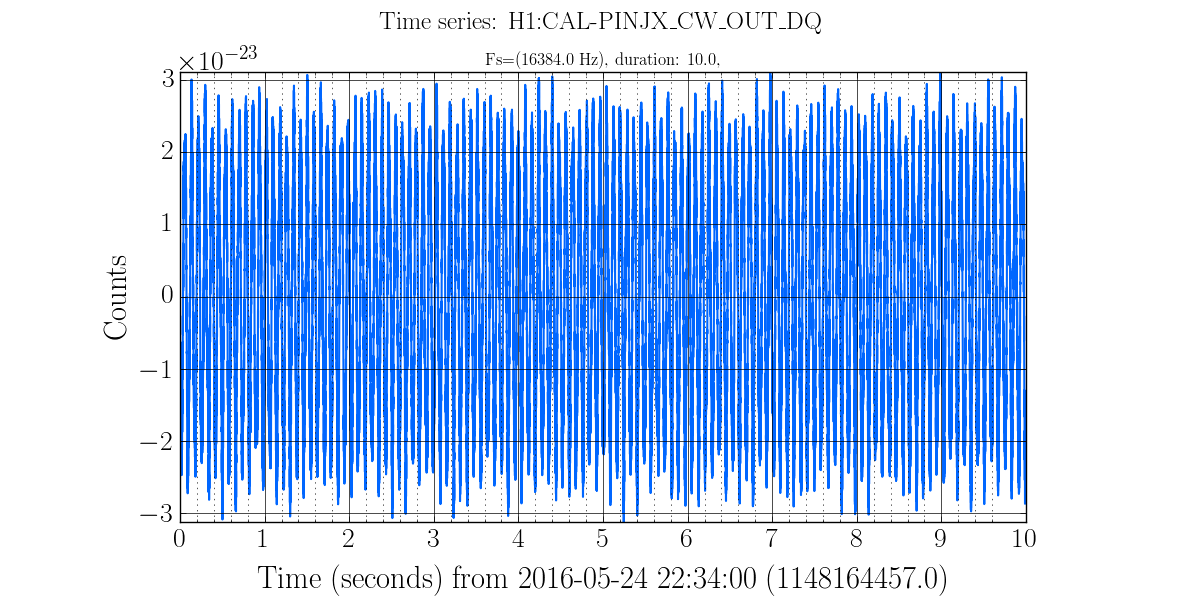
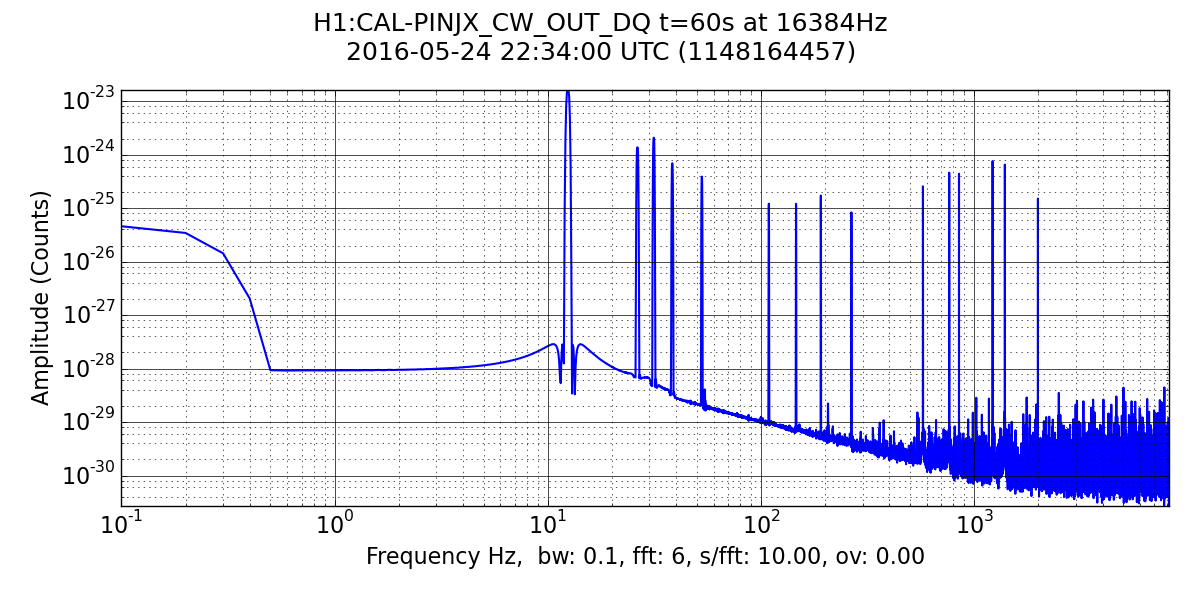
At Rick's request, I am attaching more information about the desired injection strengths.
Attached are a time series plot and a csv file for 10 seconds of H1:CAL-PINJX_CW on May 24 when
the old time-domain IAF was in use, along with a spectrum and csv file for a minute,
starting at the same time (rectangular window, no overlap, amp spectrum - not density).
Graphs and files were generated via ldvw.

This sample of May 24 data starting at 22:34 UTC corresponds closely to what should
have been injected on May 25 at 22:30 UTC, i.e., the first pair of spectral snapshots above.
Images attached to this comment
Non-image files attached to this comment
