cheryl.vorvick@LIGO.ORG - posted 13:05, Thursday 16 June 2016 (27773)
noise on IM2 OSEM LR vs noise (or lack of) on IM1 OSEM LR
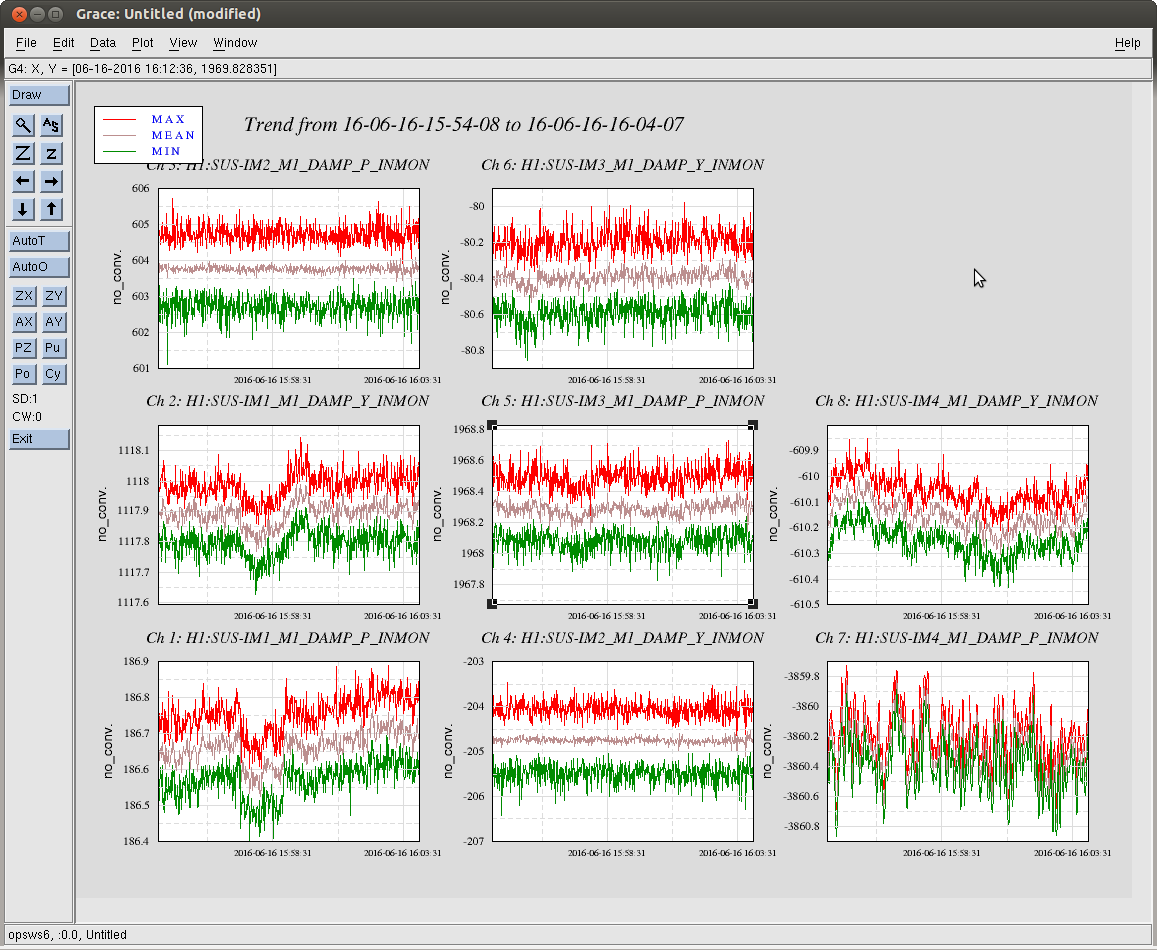
IM2 shows more motion in pitch and yaw than IM1, IM3, or IM4. Below is a chart showing the p-p amplitude of the oscillations in the damping signals, in urad, for pitch and yaw.
| DAMP_P_IN (urad) | DAMP_Y_IN (urad) | |
| IM1 | 0.5 | 0.5 |
| IM2 | 3.0 | 2.5 |
| IM3 | 0.7 | 0.6 |
| IM4 | 1.0 | 0.5 |
- IM2 pitch is 3 times larger than IM4 in pitch.
- IM2 yaw is 4 times larger than IM3 yaw.
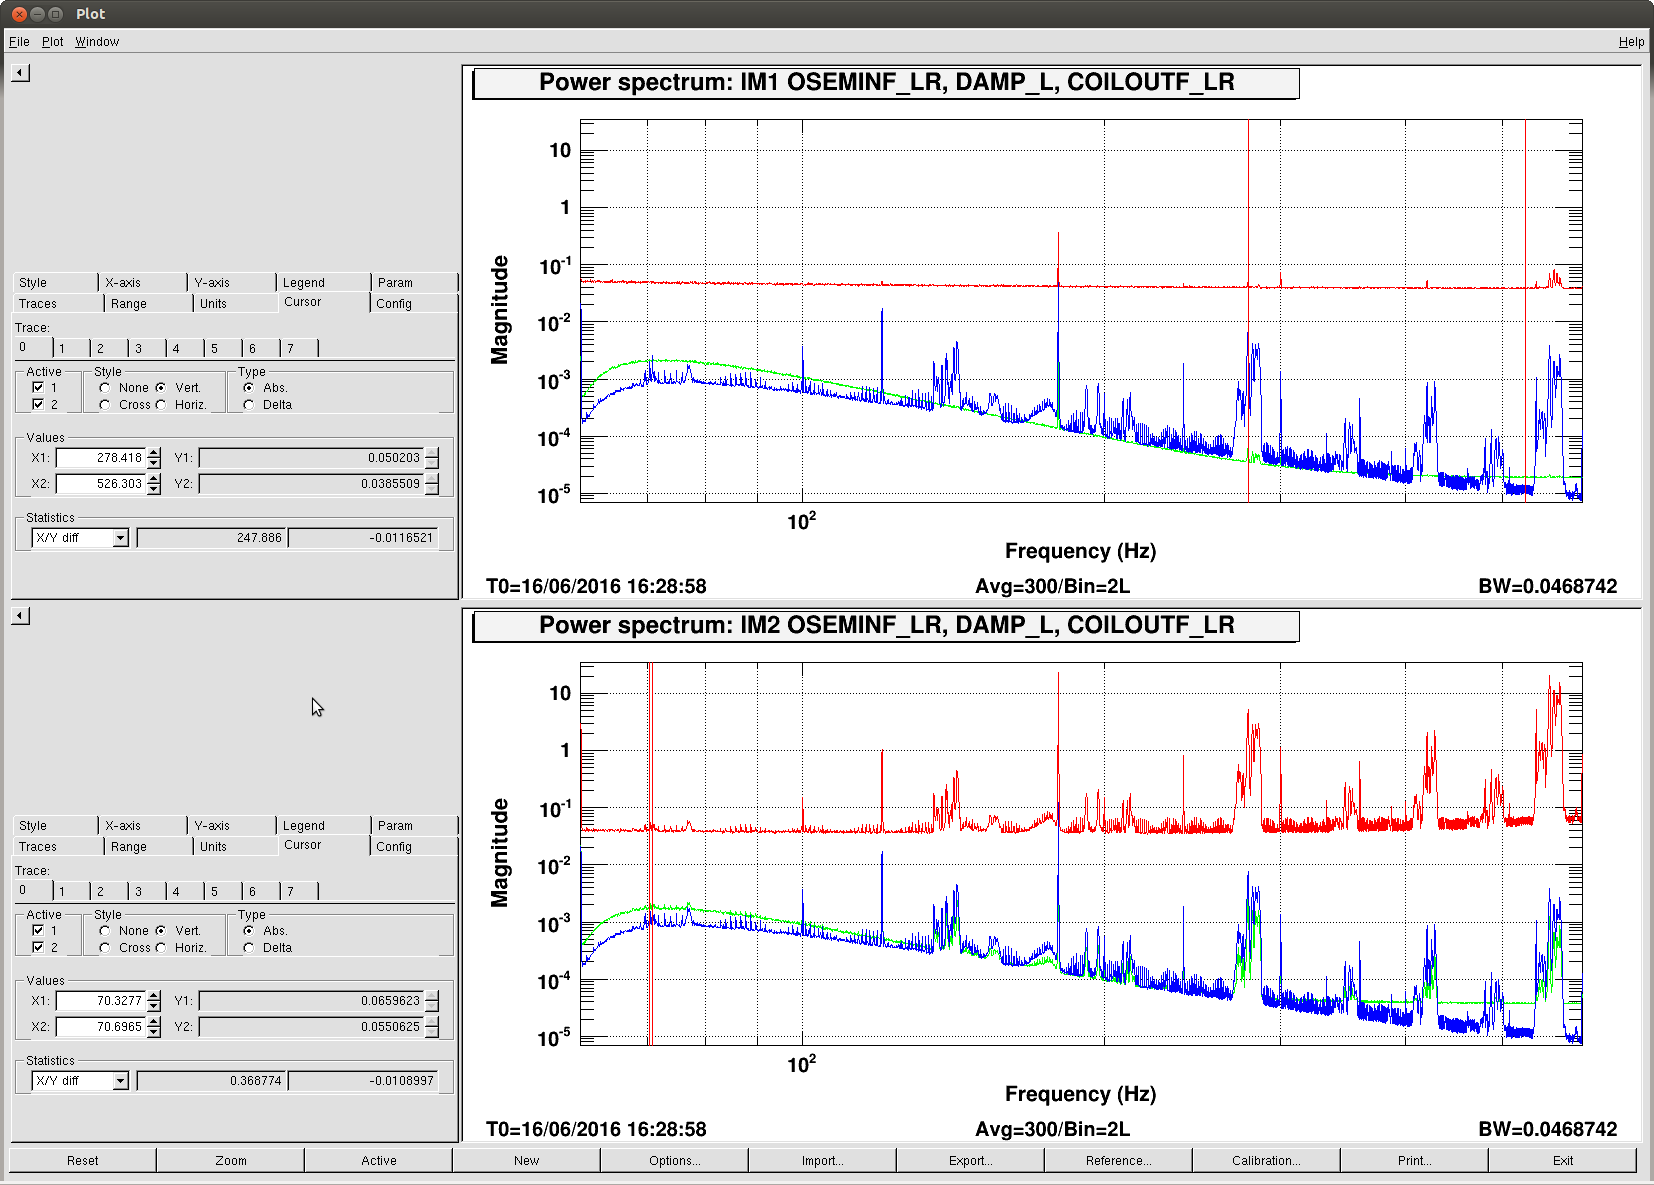
Attached is a power spectrum taken today showing OSEM LR, DAMP L, and COIL OUT LR for IM1 and IM2.
- red = OSEM, blue = damping in length (output, counts), green = coil out
- both plots have the same x axis range and y axis range
- both IM1 and IM2 damping signals have the 1Hz oscillation and additional peaks and a cluster of noise peaks
- for IM1, the noise in the length damping signal shows up in the OSEM signal at 278.34Hz, then the signal is quiet until the cluster of peaks between 526.34Hz and 570.3Hz
- for IM2, the noise in the length damping signal starts to shows up in the OSEM signal at 70.3Hz, and above that frequency, the 1Hz comb, individual peaks, and clusters of peaks are clearly visible in the OSEM signal
See also: alog #26502, alog #25955, alog #25811
Images attached to this report