
REMOVE SEARCH FILTER
SEARCH AGAIN
Search criteria
Section: H1
Task: CDS
The CS HEPI system is planned to be upgraded to a Beckhoff PLC system. Modifications to the motor control panels to readout the VRD readback signal completed. Cabling and panel connections cleaned up. Part of ECR E2200043.
Prior to starting work:
Work stations updated and rebooted. This was an OS packages update. Conda packages were not updated.
The trends for the Kobelco air compressor oil temperatures can be viewed at 1day and 7day
They are also linked to the ndscope trends page

Jonathan, Dave:
The DAQ was restarted for three changes:
Add the new HEPI Pump Controller corner station channels and retire the old (ben box) channels.
Add the Kobelco compressor oil temperature channels
Expand EPICS LOAD MON to include the container IOC's service-host cluster machines (service-host[0,1,2])
This was an extended DAQ restart so we could backfill some of the new hpipumpctrl channels with the raw minute data from the old channels.
23 channels were effectively renamed, so the rawmin files with the old names were copied to the new names so the trend writer "continued where it left off" with these channels.
The DAQ restart sequence was:
Stop TW0, run the copy script
Stop TW1, run the copy script
Restart the 1-leg, immediately restart the EDC
Restart the 0-leg
The copy script which maps oldname to newname is:
cp 52/H1:HPI-PUMP_L0_BSC2SUP_PRESS ff/H1:HPI-PUMP_CS_BSC2SUP_PRESS_PSI
cp 56/H1:HPI-PUMP_L0_BSC2RET_PRESS f1/H1:HPI-PUMP_CS_BSC2RET_PRESS_PSI
cp 9e/H1:HPI-PUMP_L0_PS1_PRESS1 24/H1:HPI-PUMP_CS_PS1_PRESS1_PSI
cp 22/H1:HPI-PUMP_L0_PS1_PRESS3 a7/H1:HPI-PUMP_CS_PS1_PRESS3_PSI
cp a1/H1:HPI-PUMP_L0_PS1_PRESS4 f6/H1:HPI-PUMP_CS_PS1_PRESS4_PSI
cp 5b/H1:HPI-PUMP_L0_PS2_PRESS1 9c/H1:HPI-PUMP_CS_PS2_PRESS1_PSI
cp e7/H1:HPI-PUMP_L0_PS2_PRESS3 1f/H1:HPI-PUMP_CS_PS2_PRESS3_PSI
cp 64/H1:HPI-PUMP_L0_PS2_PRESS4 4e/H1:HPI-PUMP_CS_PS2_PRESS4_PSI
cp 18/H1:HPI-PUMP_L0_PS3_PRESS1 f4/H1:HPI-PUMP_CS_PS3_PRESS1_PSI
cp a4/H1:HPI-PUMP_L0_PS3_PRESS3 77/H1:HPI-PUMP_CS_PS3_PRESS3_PSI
cp 27/H1:HPI-PUMP_L0_PS3_PRESS4 26/H1:HPI-PUMP_CS_PS3_PRESS4_PSI
cp c8/H1:HPI-PUMP_L0_PS4_PRESS1 f5/H1:HPI-PUMP_CS_PS4_PRESS1_PSI
cp 74/H1:HPI-PUMP_L0_PS4_PRESS3 76/H1:HPI-PUMP_CS_PS4_PRESS3_PSI
cp f7/H1:HPI-PUMP_L0_PS4_PRESS4 27/H1:HPI-PUMP_CS_PS4_PRESS4_PSI
cp a4/H1:HPI-PUMP_L0_MAINSUPPLY_PRESS a/H1:HPI-PUMP_CS_MAINSUPPLY_PRESS_PSI
cp ca/H1:HPI-PUMP_L0_DIFF_PRESSURE 6d/H1:HPI-PUMP_CS_DIFF_PRESS_PSI
cp 39/H1:HPI-PUMP_L0_PRESSURE_OK cc/H1:HPI-PUMP_CS_PRESS_OK
cp a5/H1:HPI-PUMP_L0_PID 43/H1:HPI-PUMP_CS_DIFF_PRESS_PUMP_CTRL_SETPT
cp 64/H1:HPI-PUMP_L0_CONTROL_VOUT 20/H1:HPI-PUMP_CS_PUMP_CTRL_OUT_V
cp 10/H1:HPI-PUMP_L0_LEVEL_ALARM 39/H1:HPI-PUMP_CS_LEVEL_SENSOR
cp 18/H1:HPI-PUMP_L0_TWEAKSIZE f/H1:HPI-PUMP_CS_DIFF_PRESS_PUMP_CTRL_OUTPUT_TWEAK_SIZE
cp 74/H1:HPI-PUMP_L0_OUT_TWEAK 4/H1:HPI-PUMP_CS_DIFF_PRESS_PUMP_CTRL_OUTPUT_TWEAK_REQ
cp 9d/H1:HPI-PUMP_L0_MODE 60/H1:HPI-PUMP_CS_DIFF_PRESS_PUMP_CTRL_MODE
Richard, Gerardo, Jordan, Fil, Patrick, Jonathan, Dave
Fil, Gerardo, Richard, Jordan ran a line from the Kobelco compressor over to the vacmr rack and connected it to a spare Beckhoff ADC channel.
I wrote an EPICS IOC which reads the raw voltage from the Beckhoff terminal and converts it to DegC and DegF oil temperature.
The ioc is kobe_oiltp_ioc.py. It reads the raw voltage from H0:VAC-MR_TERM_M28_CHAN3_IN_VOLTS and converts this to temperature DegC using the simple formula
DegC = 30 * V
It also converts the temperature to DegF and, along with the raw voltage read via ezca, exports these in EPICS channels. The chan names are:
[H1:VAC-MR_KOBE_OILTP_VOLTS]
[H1:VAC-MR_KOBE_OILTP_DEGC]
[H1:VAC-MR_KOBE_OILTP_DEGF]
H1:VAC-MR_KOBE_OILTP_DEGF was added to the alarms system. Cell phone alarms will be sent to the vacuum group if the temperature exceeds 150F or falls below 100F.
These channels have been added to the Vacuum Overview MEDM (attached).

Currently the kobe_oiltp_ioc is running in a tmux on opslogin0. If it becomes a more permanent feature we will move it over to a container on the service-host cluster.
Jonathan, Erik, Patrick, Dave:
This afternoon Jonathan installed the new IOC-LAN on the service-host cluster, which increased the number of IP addresses available to containerized IOCs from a few dozen to 64k. The IOCs were restarted and assigned new addresses on this VLAN (10.23.0.0/16) [see attached dashboard]
For a brief period while the server was being updated we ran pt100a's IOC on opslogin0.
The EDC was restarted on h1susauxb13 to include 10.23.255.255 in its CA_ADDR_LIST UDP broadcast list. Similarly on cdslogin the alarms service's puppet config was updated and alarms was restarted.

As per WP 13257 we configured the network to create a dedicated subnet for IOCs and other services. This is in support of our work to improve our infrastructure and management of IOCs and services in CDS. This included network switch reconfiguration and extending the CDS environment. The edc will need a restart to be able to see the new subnet. This will be held off until we actually put something in the network that it needs to record.
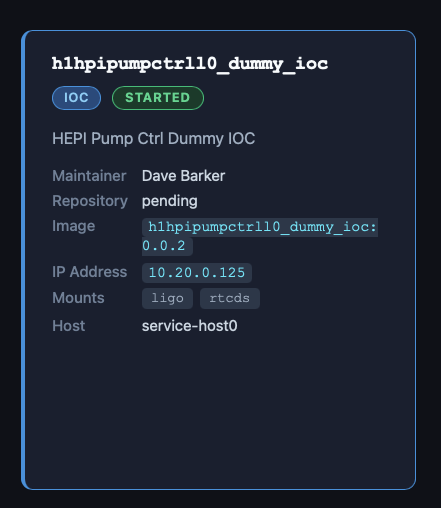
While the corner station old HEPI pump controller (aka the Ben Box) is down and before the new Beckhoff replacement is rolled out, I've created a dummy ioc which serves the old channels. This has "greened up" the EDC, it no longer has 31 disconnected channels. To appease the alarms system, the PRESSn channels have non-zero values which lie in the good range. CDS now has zero active alarms.
I took the opportunity to update my docs on testing/installing containerized IOCs.
Workstations were updated and rebooted. This was an OS packages update. Conda packages were not updated.
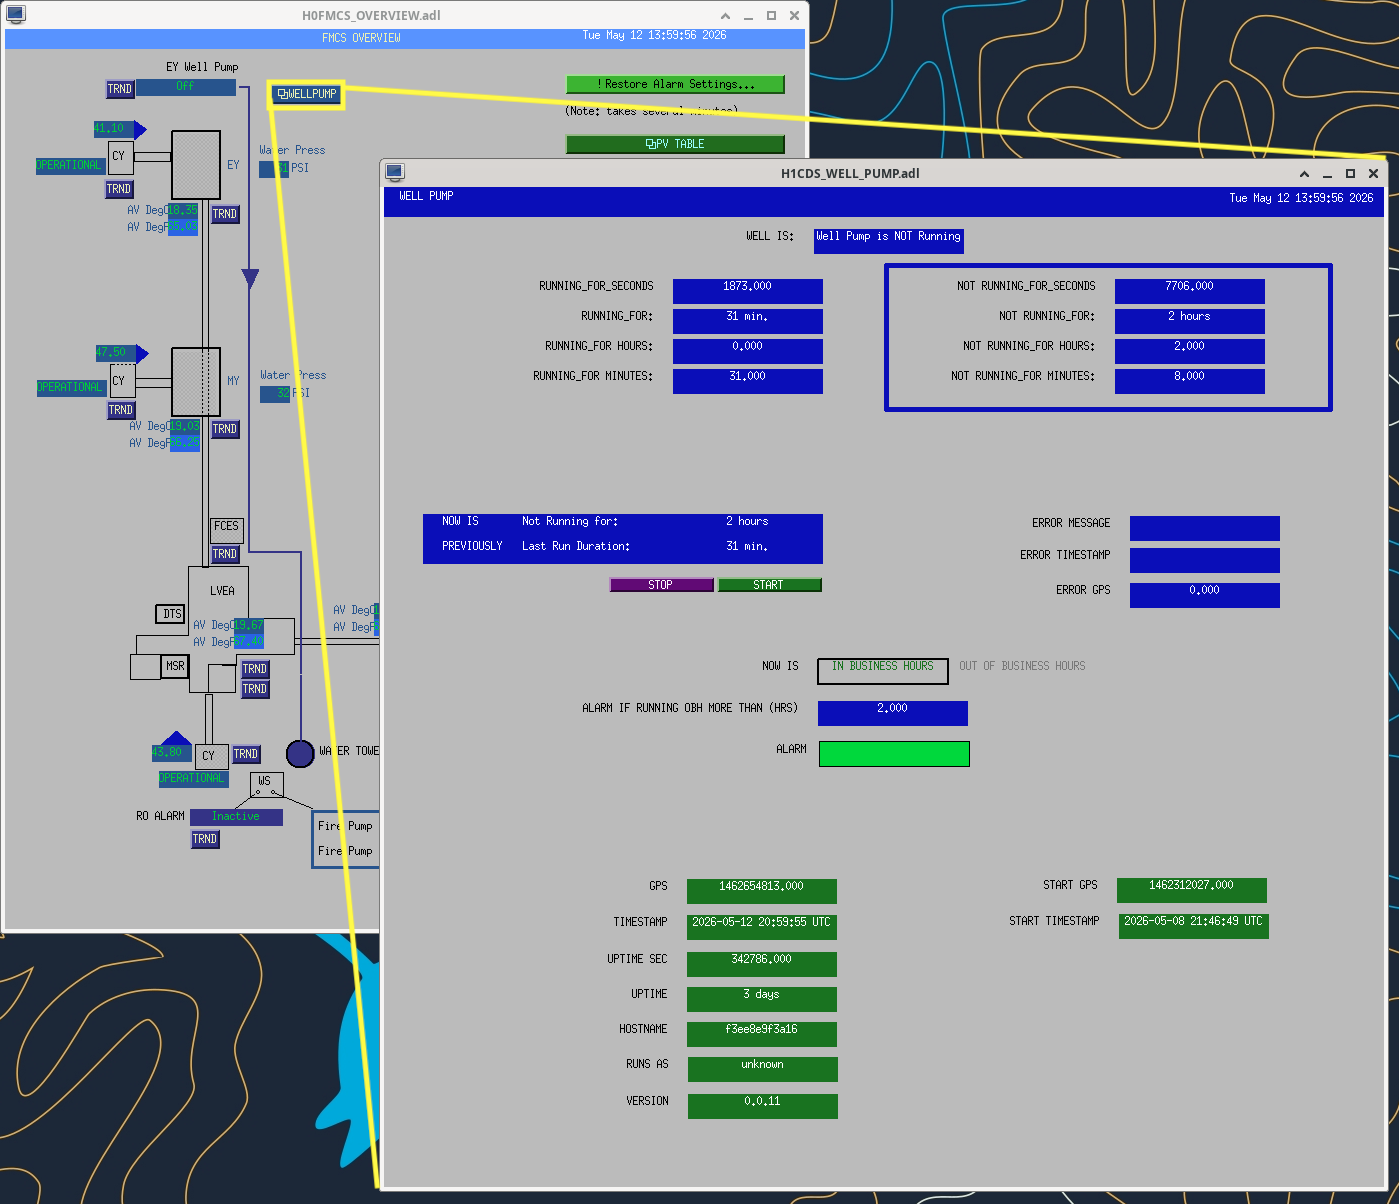
Jonathan, Erik, Dave:
The EY well pump is now being monitored by an EPICS IOC which will report if the pump runs long outside of business hours. The well pump status is available on a MEDM, which can be launched from the FMCS overview MEDM (see attached). If the pump runs for more than 2 hours outside of standard hours (07:00 - 17:00 Mon-Fri) an alarm will be raised.
Workstations were updated and rebooted. This was an OS packages update. Conda packages were not updated.
No issues seen on CDS.

J. Kissel, J. Warner
ECR: E2400026
WPs: 13237, LHO:13238
Final Design Doc: T2400145
Relevant Systems Level Drawings:
    . Mechanical Assemblies
        :: ISIJ Reflector D2400102
        :: HAM Table Baffles D1700335
        :: HAM2 Systems Layout D0901083 (not yet-inclusive-of-SPI)
    . Electronics Wiring Diagram
    . Cable Routing In-vac Cable Routing Plan from G2401479 (pages )
    . Flange Layout D1002873-v11

Executive summary:
    - Removed ISIJ +X-side, center, HAM2 ISI table baffle from D1700265-v4 Type 2
        :: Bracket mounting bolts left screwed into ISI optical table for this will eventually become a D1700265-v4 Type 3 and remounted.
    - Installed ISIJ Reflector + QPD Assembly D2400102 on +X ISI side wall (D071057-v2), with its shroud (D2500030) in place
        :: We didn't weigh it, but the SW Assembly predicts a mass of 1.96 [kg], which we can likely round up to 2.0 [kg] with the shroud installed.
    - Routed and connected QPD read-out cable system to D3 flange, F10 spigot.
    - Routed and connected picomotor cable system to existing D1101515 quadrupus leg Cable #3, J4
        :: Cable #4, J5 is connected to IO PM5 mirror, Cables #2 J3 and #1 J2 were reset in neat coil with connectors floating to avoid electrical grounding as before.
    - Nudged make-shift baffle system using D1700261 ballast mass baffle mounted vertically on the +X / +Y / Beam Height corner of the chamber wall upon entry into beamtube.
        :: the will DEFINITELY need a technically-minded reset.

In at 10:30a PT and out by 12:30a PT. It's so lovely when everything goes to plan!

Pictures and further info to follow in the comments below.


Removing Center ISI Table Baffle

Not much to say more here -- removal was easy. We tried "just" removing the panel using the the coated/capped screws, but these didn't budget upon several attempts with Jim's fingers and grunts. So, elected to fight that battle outside the chamber and removed the whole assembly at the table mounting point.

The full assembly is wrapped in dry-wipes, foil, and ameristat bagged and in Mitch's office while it waits for the Type 03 version of the panel to come out of clean-n-bake.


Installation of ISIJ Reflector itself

Also not much to say, other than the great joy that the drawings of the D071057-v2 ISI Side Wall have the irregular positions of the 1/4-20 utility holes accurate enough that Bram's CAD-informed-only mounting holes for the ISIJ reflector's baseplate of the reflector lined up without issue. *phew*

Also -- the D2400102 drawing doesn't highlight which length 1/4-20 bolt should be used for mounting, so we used 1/4"-20 x 0.625"L (5/8"), which was "just enough."

Pictures from the main entry are the best "big picture" views, but here I attach a few more in case the need arises.


QPD Cable Routing

We didn't get dedicated pictures of this QPD cable routing but,
    - it follows the plan on page 22 of In-vac Cable Routing Plan posted to G2401479-v3,
    - You can see the ST1 portion of it well-enough in the above pictures,
    - Jim did the routing, so I trust that there's a healthy loop in the jump from ST1 to ST0, and
    - I attach a picture here of the record that we've connected it to D3-F10, and a copy of the "F-Type" (D2000225-v1) counting from page 18 of the above mentioned cable routing plan.


Picomotor Cable Routing BEFORE INSTALL

Just because we knew little about the details of this cable system ahead of time given how ancient the PM5 picomotor actuated mirror system, I got a lot of good "before" pictures. Mostly, I confirm that PM5 does use the Cable #4 J5 leg of the D1101515 quadrupus, and all the other legs were neatly cable-tied up and away.


Picomotor Cable Routing AFTER INSTALL

Here're photos of the routing of the two 72 [in] length D2400316 picomotor extension cables connected in series and routed to all the way around from the ISIJ reflector on the +X face to the -X / +Y corner of the table where CB-9 and the D1101515 quadrupus lives.

I paid particular attention to the connectors and made sure they were left floating and not shorting to anything metal.

I also re-bundled up Cable #2 J3 and Cable #1 J2 in coil similar to the before pictures, again ensuring that the connectors are floating in both space and electrical connection.


The Nudged Chamber Wall Baffle

Some pictures of the baffle that we nudged that will likely need re-alignment.


tagging for photos.
On the new channel assignment of HAM2's SPI ISIJ picomotor, and why I'm confident it's CH7:

Per D1000581-v13, page 13 and then D1900511-v12 page 17, I'm quite confident that the quadrupus cable and up in CH5-8 of the controller on IOT2L, called "PICOMOTOR 5" in D1900511, which I guess becomes "Picomotor B / Slot 2" on page 2 of the ECAT System Diagram D1100683-v11.

This is corroborated with opening up the picomotor MEDM screen -- sitemap > LSC > picomotors > "HAM 2 + oplev" button (that has "controller 5" and "PICO B" next to it), and clicking through the channels and seeing that CH8 is called "PSL ISS QPD/PD (PM5)."

Here's a labeled picture that makes things more clear.

Belated aLOG on in-vac cable routing of the ISIJ QPD A PD and serial number assignments:

Path       PD Name    PD SN          Monopus            D9-to-D25 Monopus
                      |----------D2600002--------|
                      D1600083 Type 3     D2400340      D2300128
OL ISIJ    QPD A      S2401092            S2500517      S2500511

WP13221 Add BBSS Fast Channels to DAQ
Tom, Oli, Erik, Dave:
18 BBSS_OSEMINF (SUM, X, Y) DQ channels were added to the DAQ, all at 256Hz. DAQ retstart was required.
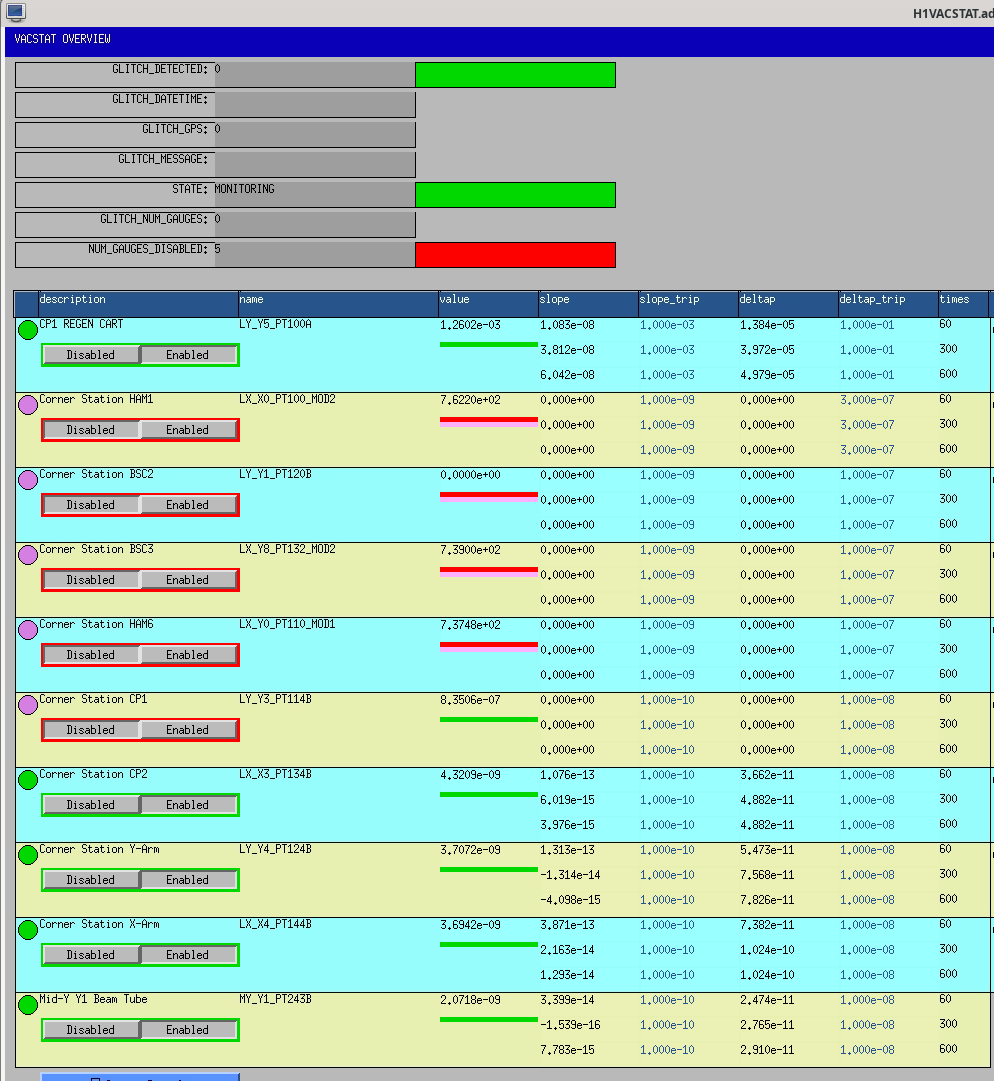
WP13223 Add PT100A VACSTAT slow channels to DAQ
Dave:
A new H1EPICS_VACSTAT.ini was generated adding PT100A. An EDC+DAQ restart was required.
WP13228 Add FW2 slow channels to DAQ
Erik, Jonathan, Dave:
Puppet was changed to add three channels unique to FW2 (STATE_0, STATE_1, NUM_WRITERS). An EDC+DAQ restart was required.
WP13235 h1sush6 IO Chassis Install
Fil, Dave:
Fil moved the IO Chassis for h1sush6 from its temporary location in an adjacent rack into the SUSH6 rack on the MER. h1sush6 front end was powered down for the duration of this work.
DAQ Restart
Erik, Jonathan, Dave:
The DAQ and EDC were restarted.
FW2 stopped at the time puppet was upgraded due to a file creation race condition.
For the DAQ restart itself, the main issue was two spontaneous restarts of FW1, both after running for 10 minutes but not synced to the writing of the second trend frame files.
11:23:13 h1susb2h34 h1suslo12 <<< New model, add DQ chans to DAQ
11:26:44 h1daqgds0 [DAQ] <<< 0-leg restart, susl012, vacstat, fw2 additions
11:26:48 h1daqfw0 [DAQ]
11:26:48 h1daqtw0 [DAQ]
11:26:49 h1daqnds0 [DAQ]
11:27:39 h1susauxb13 h1edc[DAQ] <<< EDC for vacstat, fw2
11:30:49 h1daqdc1 [DAQ] <<< 1-leg restart
11:30:58 h1daqfw1 [DAQ]
11:31:00 h1daqtw1 [DAQ]
11:31:03 h1daqnds1 [DAQ]
11:31:11 h1daqgds1 [DAQ]
11:32:13 h1daqgds1 [DAQ] <<< gds1 needed a restart
11:40:28 h1sush6 ***REBOOT*** <<< Power up after IO Chassis work
11:41:23 h1daqfw1 [DAQ] <<< First FW1 spontaneous restart, suspiciously close to start of sush6
11:41:30 h1sush6 h1iopsush6
11:41:43 h1sush6 h1susom0
11:41:56 h1sush6 h1susobs
11:42:09 h1sush6 h1susam
11:42:22 h1sush6 h1susomcab
11:42:35 h1sush6 h1susom1ab
11:42:48 h1sush6 h1susom2ab
11:43:01 h1sush6 h1susom3ab
11:51:41 h1daqfw1 [DAQ] <<< Second FW1 spontaneous restart, roughly +10mins
12:02:32 h1daqfw1 [DAQ] <<< Third FW1 spontaneous restart, again roughly +10mins
WP 13235
WP 13169
Drawing O5 SUS HAM6 (sush6) System Wiring Diagrams - D2300379
The O5 SUS HAM6 electronics and in-rack cabling installation in the MER is complete. System wiring diagrams D2300379 will need to be updated to show no IO h1susauxh6 was installed. New ADC cards (SUS AUX) were installed in the h1seih7 IO chassis.
IO chassis h1sush6 and h1sush7 share a 24V power supply. A dual Kepco power supply was installed to power the ±18V for SUS-M2. New electronics except the h1sush6 IO chassis were left powered off.
Status of the SUS-R7 rack is ongoing. All electronics installed. All long cables from MER and CER pulled and dressed. Rack requires ±18V and 200V for PSAMS. Depending on loads, plan is to use the SUS-R4 power supplies for the ±18V. The HV power supply will need to be placed on the HAM6 vacuum gauge interlock.

Workstations were updated and rebooted. This was an OS packages update. Conda packages were not updated.
Gerardo, Jordan, Jonathan, Dave:
PT114 has started to rise rapidly. At 16:50 I changed its alarm high from 2.0e-08 to 5.0e-04.
Later PT114B's VACSTAT continued to trip due to the large delta-P. After clearing the alarms I have disabled PT114B in VACSTAT (but its level alarms remain active).

As mentioned by Gerardo CP1's outside discharge line pipe is now completely free of ice (Nov 2025 image added for comparison).


The pressure at PT114 has continued to rise this morning and mostly leveled out, but it's bouncing around the channel's low-level alarm threshold at 1e-5 Torr. This is triggering Verbal Alarms and the CR alarm handler computer every time the pressure goes above 1e-5 Torr, which is on average a few times per minute.
I've commented out PT114 from the Verbal Alarms vacuum channel list to reduce redundant alarms and will look into modifying the thresholds somehow for the alarm handler.
