Today during Maintenance the HAM2 ISI was not fully isolated but in DAMPED to allow for work in the LVEA. The IM1-4 optics were in SAFE, so no alignment bias and no damping. This configuration closely mimicks an ISI / optic trip.
When it was time to restore the HAM2 ISI, and then redamp the IM1-4 optics, I observed the drift in pitch and yaw that I've observed after an ISI trip.
The difference between a typical ISI-IM-IMC recovery, and todays recovery is that we restored the ISI and IMs while the PSL beam was blocked at the shutter between the PSL and HAM1.
The drift in IMs today was no different than the drifts I've observed before.
There was a suggestion that heating from the IMC being restored, when the HAM2 and HAM3 ISIs and optics are restored, might be the source of the IM drift, however since I tracked the drift today and there was no IMC beam, I have to conclude the restoration of the IMC is not the source of the IM drift.
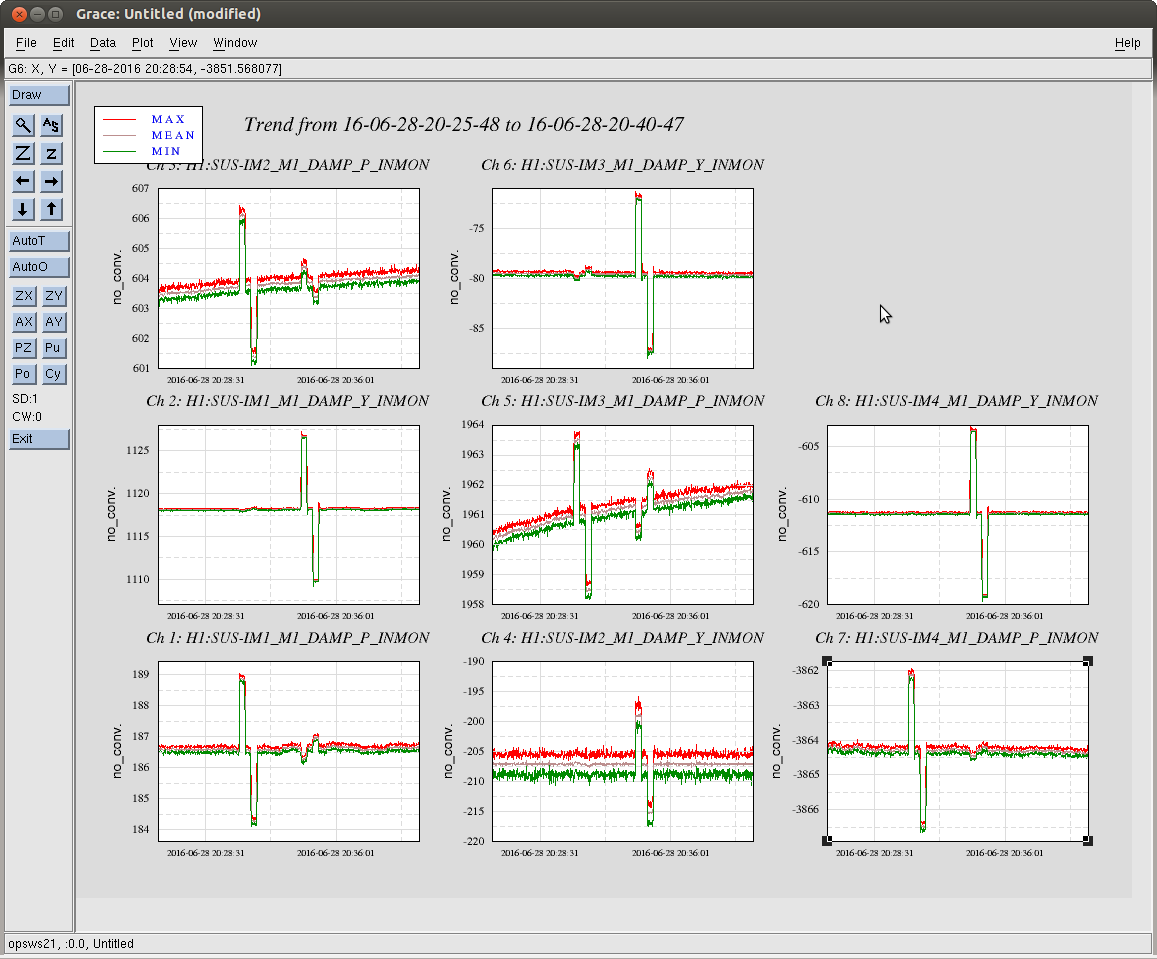
While tracking the drift, I exercised the pitch and yaw alignment biases for each IM by +/-100 counts to see if that would effect the drift. I was testing the theory that the cause of the alignment shifts that I've tracked since last year might also be causing this recovery drift, but I cannot see that being true, since moving the alignment biases had no effect on the drift.
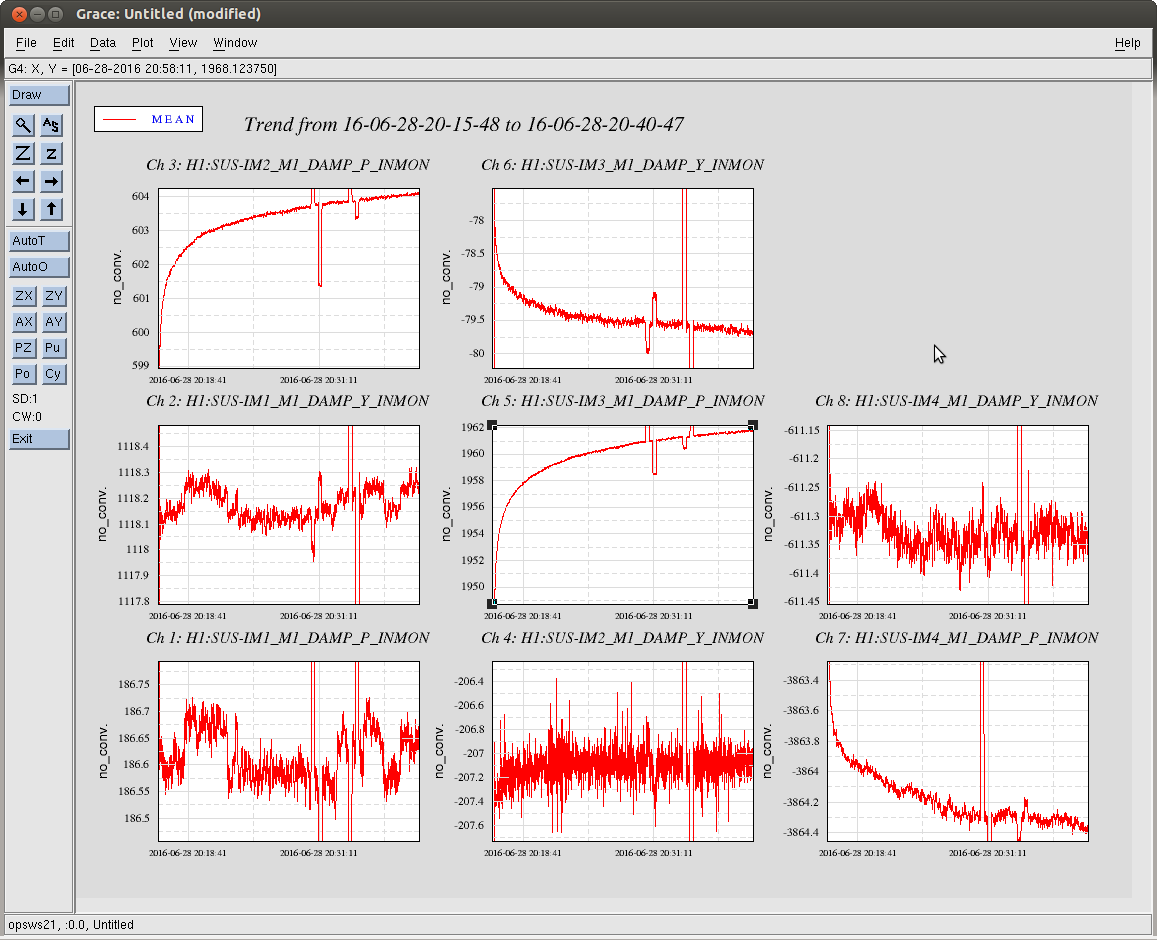
Here are the amounts each IM changed after being restored:
black: IM DOFs that did not show any significant drift (drift that is less than 1urad)
red: IM DOFs that did show significat drift (drift equal to or greater than 1urad)
|
alignment restored 20:15:55UTC |
alignment at 20:40:47UTC |
drift over 25 minutes urad |
|
| IM1 P | 186.62 | 186.5 | -0.12 |
| IM1 Y | 1118.10 | 1118.25 | 0.15 |
| IM2 P | 599.60 | 604.1 | 4.50 |
| IM2 Y | -207.30 | -207.1 | 0.20 |
| IM3 P | 1949.50 | 1961.8 | 12.30 |
| IM3 Y | -78.00 | -79.68 | -1.68 |
| IM4 P | -3863.40 | -3864.36 | -0.96 |
| IM4 Y | -611.30 | -611.35 | -0.05 |
Attached plots:
- 25 minutes of drift
- close up of the pitch and yaw alignment biases being exercised, showing the drift of was unchanged