In this morning, I checked the OMC DCPD electronics chain (for both A and B) by injecting known sine wave analog signal. This was one of those items that Keita suggested me a while ago.
According to the data, I am concluding that our calibration model needs to add another pole at 10-ish kHz for accurately simulating the OMC whitening circuits.
Method
The measurement method is straightforward -- it is a swept sine measurement in a manual way.
I had a function generator by the HAM6 electronics rack which drove a single-ended-to-differential convertor (D1000931, technically speaking this is a coil driver test box). Then the differential signal is sent to the input of the OMC DCPD whitening board (D1002559, S1101603) by some clipping technique. By the way, the actual cable for connecting the OMC DCPDs were unplugged during the measurement. The excitation amplitude was set to 2 Vp-p at the function generator which resulted in 2 Vp-p in both positive and negative paths at the input of the whitening board as expected accroding to the schematic of the coil driver test box.
I then recorded the data in IOP at the full sample rate using dataviewer for 1 sec for a selected excitation frequency (and for some reason, diaggui did not want to run and hence dataviewer this time). Keeping the same excitation amplitude, I manually stepped the freqyency from 8 kHz to 100 Hz. After every step, I saved the time series of the IOP so that I can make a transfer function later. In addition, I had an oscilloscope with me which kept monitoring the excitation ampitude at the input of the whitening board. The scope told me that the excitation ampltude stayed constant at 2.02 Vp-p in each channel throughtout the measurement. The OMC DCPD had
Analysis and result
To get a transfer function from the data that I took in time series, I decided to do a sine-wave fitting for each data chunk to get the amplitude information. I wrote a small matlab script to do it. It can be found at:
aligocalibration/trunk/Runs/ER8/H1/Scripts/OMCDCPDs/Matlab/OMC_DCPD_AnalogChain_TimeSeries.m
The script utilizes fminsearch and spits out the best fit amplitude for each frequency measurement. Additionally, it places uncertainty or error bar by taking the standard deviation of the residual. Note that this is not a standard way to place an error bar since it does not take the number of measurement points into consideration. According to the fit, the residuals were found to be usually a few counts which is much smaller than the amplitude of signals which was about 2000 counts. So it typically places 0.1% uncertainty after all.
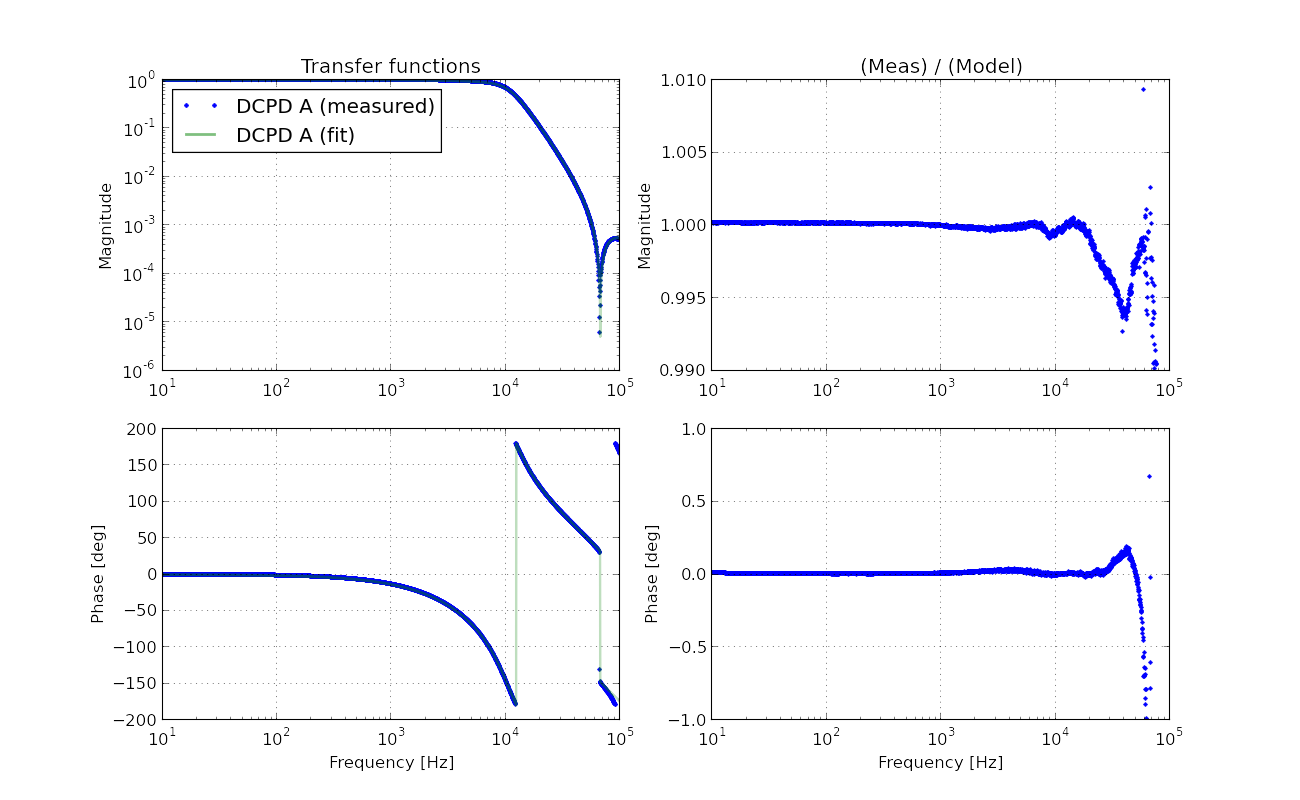
The result is shown in the attached pdf. By the way the lower panel in the plot says, "residual", but it should read "(measured)/(model)" instead. It shows the measured transfer function together with the expected model transfer function for comparison. It is very obvious that the measurement suggests that our model is missing some high frequency pole. The model is merely made of the analog AA response which I have already measured and fitted. Adding some random pole, I could see an extra pole at around 10.7 kHz making the fitting much better. In fact, I sort of knew that there seemed to be a high frequency pole by some other measurements which I did not post. We probably need to add this high frequency pole in our calibration model.

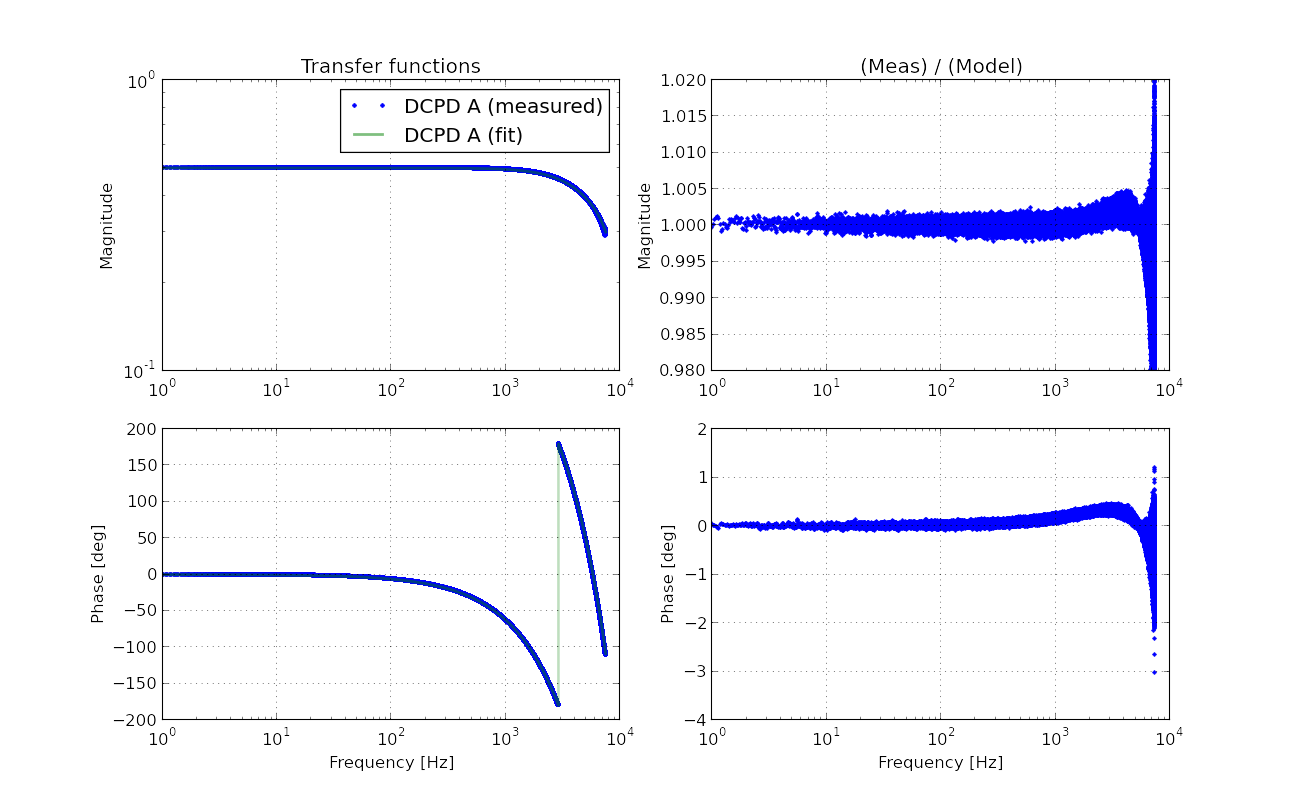
I have measured and fitted the AA filter response for DCPD A and B (ch13 and ch14 of S1102788 respectively). I used the same coil driver test box to produce differential signal and measured the transfer functions with SR785. The results don't show any unexpected additional high frequency poles.
The plots are shown below in line. The fitting is good up to 10 kHz.
The fitting code can be found at:
/aligocalibration/trunk/Runs/ER8/H1/Scripts/OMCDCPDs/Liso/fit_AA_OMC_DCPD_A.fil
/aligocalibration/trunk/Runs/ER8/H1/Scripts/OMCDCPDs/Liso/fit_AA_OMC_DCPD_B.fil
The analysis/plot code can be found at:
/aligocalibration/trunk/Runs/ER8/H1/Scripts/OMCDCPDs/python/OMC_DCPD_AA_filters.py
The figures in both pdf and png formats are available at:
/aligocalibration/trunk/Runs/ER8/H1/Results/OMCDCPDs/2015-08-27_AA_DCPD_A.pdf
/aligocalibration/trunk/Runs/ER8/H1/Results/OMCDCPDs/2015-08-27_AA_DCPD_A.png
/aligocalibration/trunk/Runs/ER8/H1/Results/OMCDCPDs/2015-08-27_AA_DCPD_B.pdf
/aligocalibration/trunk/Runs/ER8/H1/Results/OMCDCPDs/2015-08-27_AA_DCPD_B.png
Independently of the above measurements, I have measured the entire signal chain of the OMC DCPD A and B by injecting random signals from the extra DAC output in LSC (a.k.a. LSC-EXTRA_AO2).
It also showed a high frequency pole at around 10.7 kHz which is consistent with the result from the manual swept sine described above.
Measurement setup
- Random noise excitation in LSC-EXTRA_AO2
- Output of the LSC-EXTRA_AO2 at the ISC rack is connected to a spear RF patch panel and routed all the way to the HAM6 area.
-
In the HAM6 area, the excitation signal is split into two by a BNC tee and drives the A and B inputs (corresponding to ch4 and ch5 respectively) of the whitening board (D1002559, S1101603).
- Note that this time the connections are made in a single-ended manner, so that it does not exctie the negative leg of the differential receiver in the whitening board.
- I took a transfer function from the IOP channel of LSC-EXTRA_AO2 and that of OMC DCPD A and B in order to avoid confusion from IOP's up/down-sampling filters.
By the way, in the digital world particularly in the IOP world, LSC-EXTRA_AO2 is called DAC0_CH9, and DCPD A and B are called ADC0_CH12 and CH13 respectively.
AI filter for LSC-EXTRA_AO2 needed to be measured
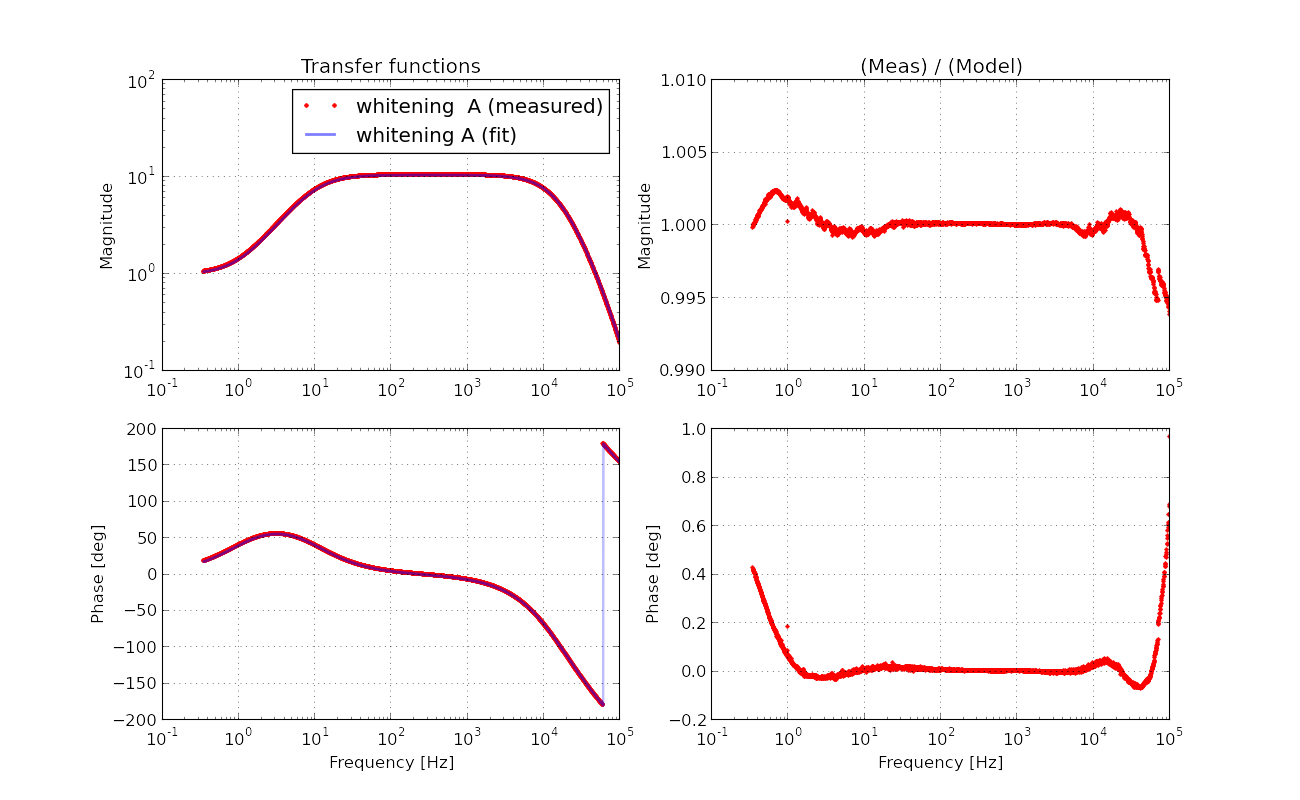
Since this measurement automatically includes the AI filter for LSC-EXTRA_AO2, we need to subtract this transfer function out of the resultant measurement. So I measured and fitted it (ch10 of S1102761) by using the coil driver test box (D1000931) and a SR7850. Here is the result.
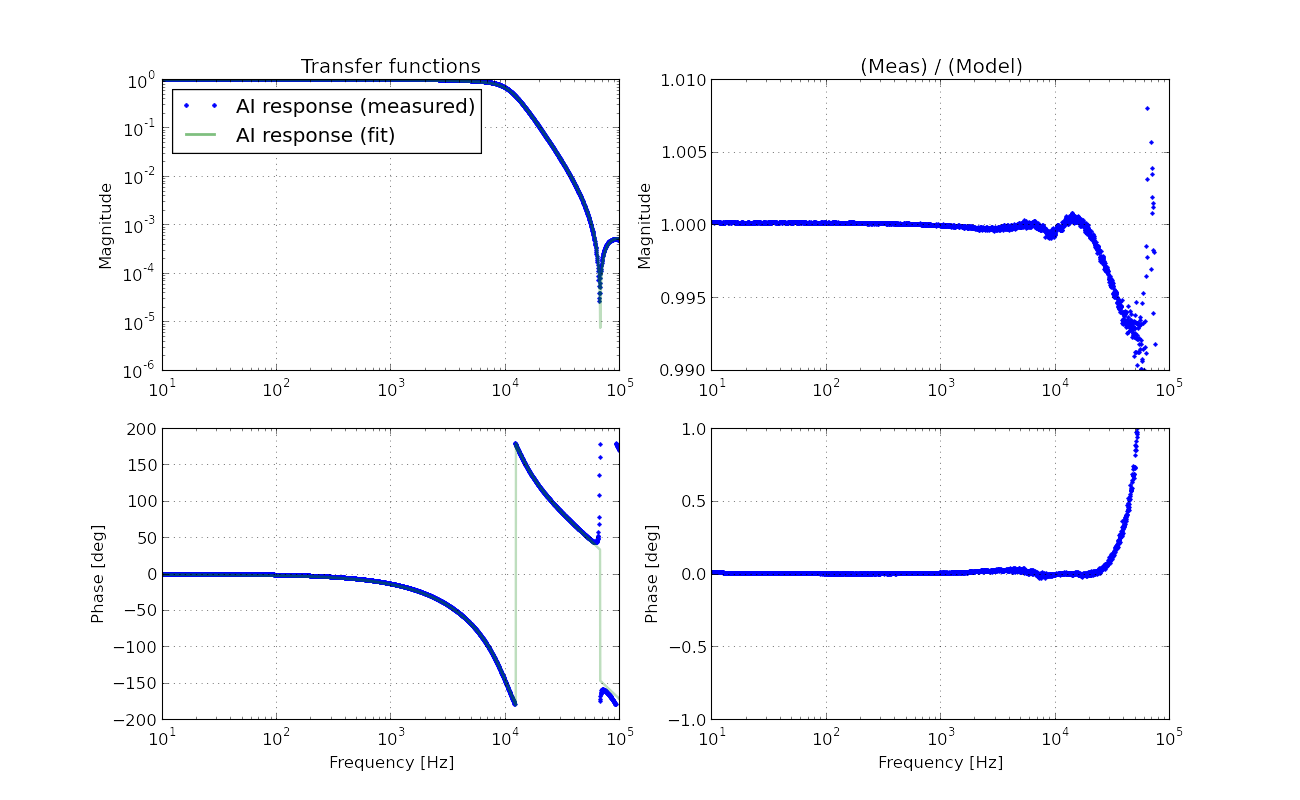
As shown in the plot above, the fitting is good up to 10 kHz. I did not see unexpected high frequency pole. The fitting code, data and results can be found at:
/aligocalibration/trunk/Runs/ER8/H1/Measurements/AAAI/LSC_EXTRA_AO_AI_v2.dat
/aligocalibration/trunk/Runs/ER8/H1/Scripts/AAAI/Liso/fit_AI_LSC_EXTRA_AO.fil
/aligocalibration/trunk/Runs/ER8/H1/Scripts/AAAI/python/LSC_EXTRA_AO2_AIfilter.py
/aligocalibration/trunk/Runs/ER8/H1/Results/AAAI/2015-08-27_AI_LSC_EXTRA_AO.png
/aligocalibration/trunk/Runs/ER8/H1/Results/AAAI/2015-08-27_AI_LSC_EXTRA_AO.pdf
This fitting result is then used in the subsequent analysis as decribed below.
Results
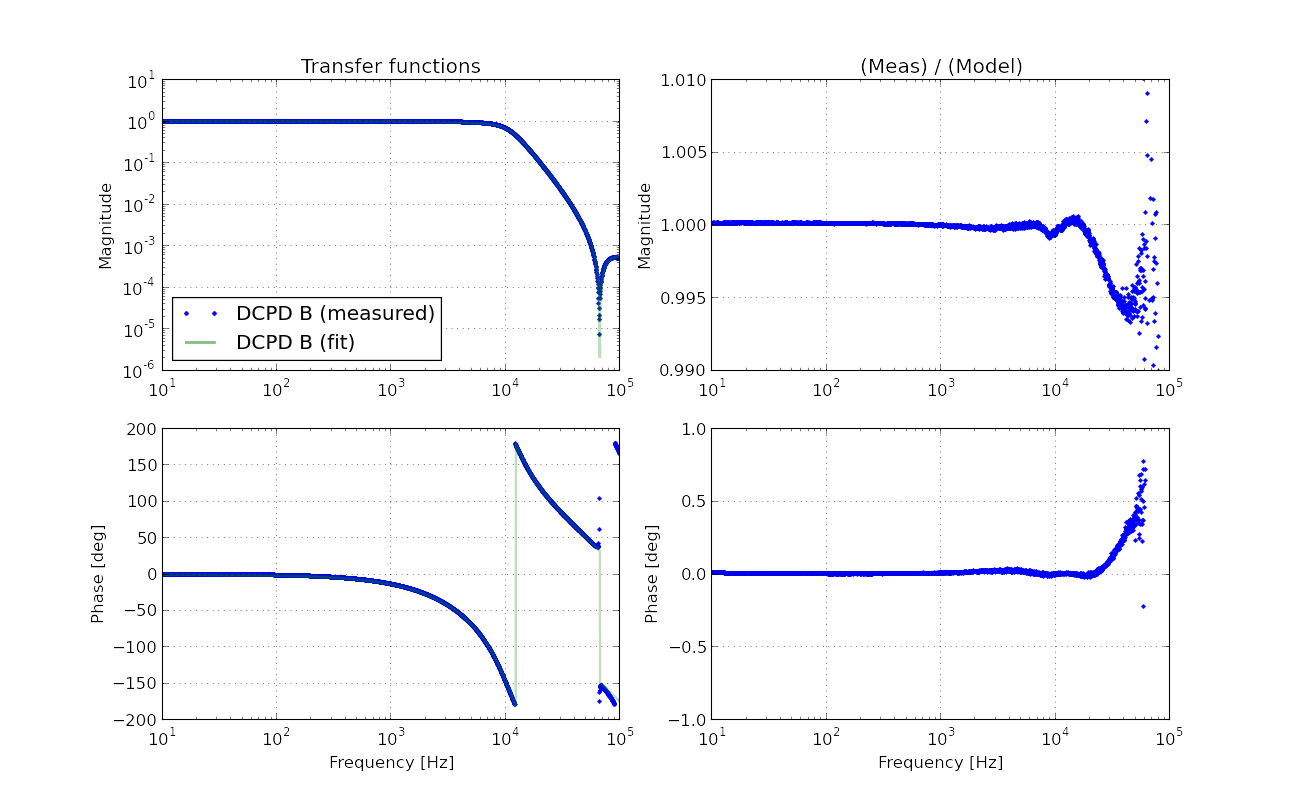
First of all, I attach the measured transfer functions together with the fitting result.
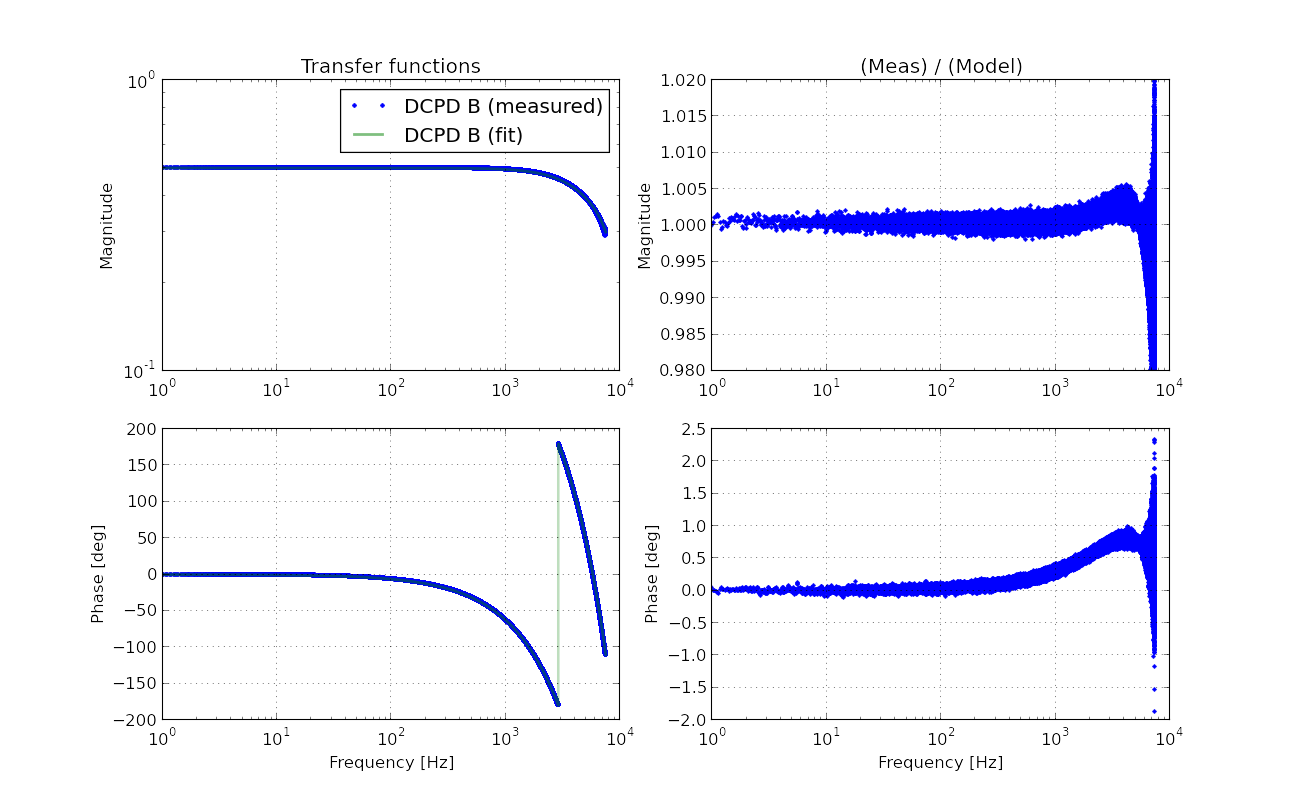
As I noted in the above subsection, the measured transfer functions include
- AI filter of LSC-EXTRA_AO2
- AA filter of DCPD A or B
- flat response of the whitening filters (as I set them to 0dB with no whitening stages engaged)
In my fitting model, I newly inserted a high frequency pole at around 11 kHz as an initial guess. Without this additional high-freq pole, the fitting would be miserable above 1 kHz similarily to the one shown in the above entry or alog 21101. As for the parameters of the AA and AI filters, I have used the fitted parameters and do not try to re-fit them in this anaysis. In other words, the fitting parameters in this analysis are:
- high-freq pole at around 11 kHz
- scale factor (which should be close to 0.5 because I am driving only one leg of the differential receiver)
- delay presumably due to some computation cycle
The below are the raw output from LISO:
#Best parameter estimates:

	 #pole6:f =  10.7609523979k +- 1.226 (0.0114%)
#Best parameter estimates:

	 #pole6:f =  10.7183613550k +- 1.209 (0.0113%)
The upper one represetns the fitting result for DCPD A and the lower one for DCPD B. Both of them have a pole at around 10.7 kHz.
Some SVN info
As usual, the data, codes and resultant figures are saved in svn. They can be found at:
/aligocalibration/trunk/Runs/ER8/H1/Measurements/OMCDCPDs/2015-08-27/LSC_AO_OUT_to_OMC_DCPDs_RandNoise_0whitenings.xml
/aligocalibration/trunk/Runs/ER8/H1/Measurements/OMCDCPDs/2015-08-27/IOPCH9to_IOPCH12_0whitening_tf.txt
/aligocalibration/trunk/Runs/ER8/H1/Measurements/OMCDCPDs/2015-08-27/IOPCH9to_IOPCH13_0whitening_tf.txt
/aligocalibration/trunk/Runs/ER8/H1/Scripts/OMCDCPDs/Liso/fit_LSCCH9toOMCCH12_0whitening.fil
/aligocalibration/trunk/Runs/ER8/H1/Scripts/OMCDCPDs/Liso/fit_LSCCH9toOMCCH13_0whitening.fil
/aligocalibration/trunk/Runs/ER8/H1/Scripts/OMCDCPDs/python/OMC_DCPD_AAandWhite.py
/aligocalibration/trunk/Runs/ER8/H1/Results/OMCDCPDs/2015-08-27_DCPD_A_AAand0White.pdf
/aligocalibration/trunk/Runs/ER8/H1/Results/OMCDCPDs/2015-08-27_DCPD_A_AAand0White.png
/aligocalibration/trunk/Runs/ER8/H1/Results/OMCDCPDs/2015-08-27_DCPD_B_AAand0White.pdf
/aligocalibration/trunk/Runs/ER8/H1/Results/OMCDCPDs/2015-08-27_DCPD_B_AAand0White.png
Next step
I will analyze equivalent data with one whitening stage engaged. This is more important because this is likely going to be the configuration we will run during O1.
I have measured the DCPD signal chain in the same fashion as the previous alog, but this time with the 1st whitening stage engaged.
Here is my conclusion:
- The whitening board seems to consistently show a high frequency pole at around 11 kHz
- The zero and pole location of the 1st whitening stage seem to be inaccurate by 12% at most
- We should re-measure the whitenig board in a wide frequency band
Measurement setup
The measurement setup is the same as the one in the previous alog shown above. I drove LSC-EXTRA_AO2 by random noise and took transfer functions from the IOP test point of LSC-EXTRA_AO2 to that of DCPD A and B. This time the 1st stage whitening filter is engaged with 0 dB gain.
Results
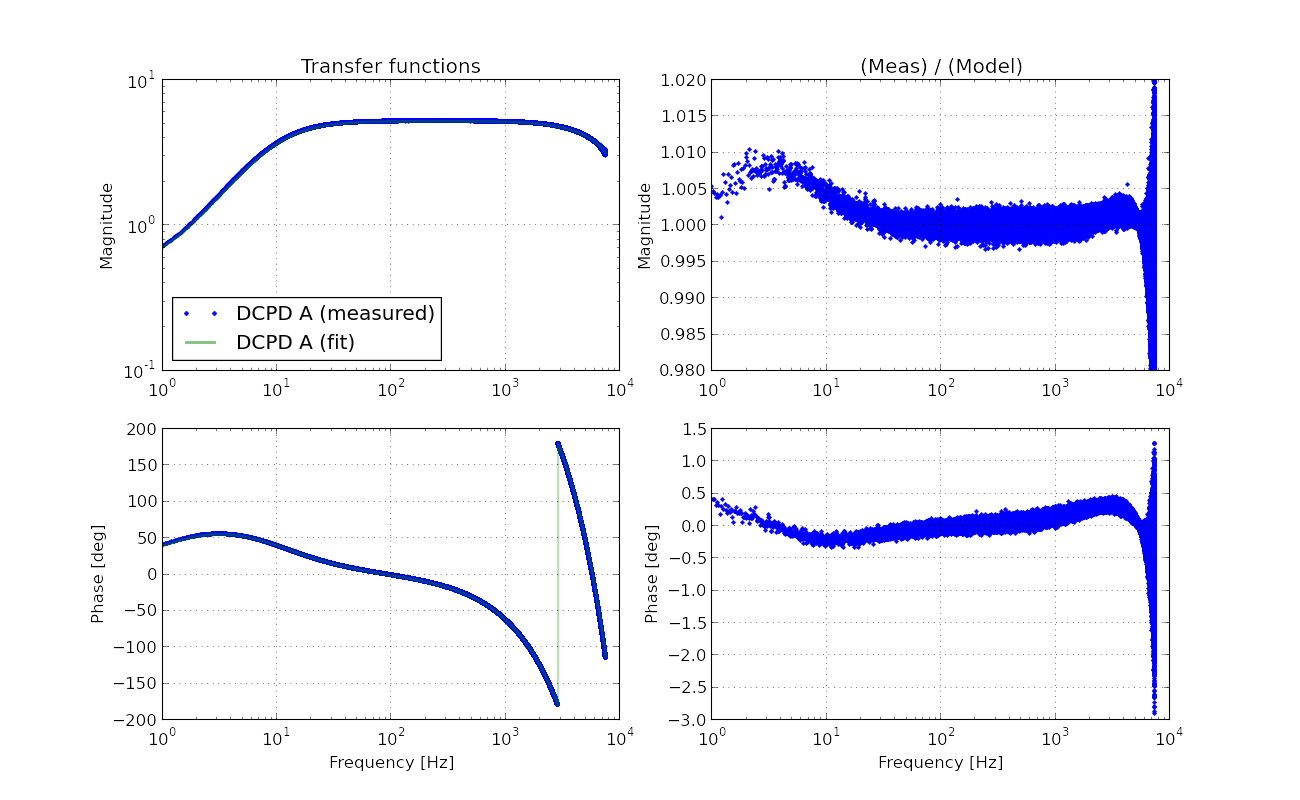
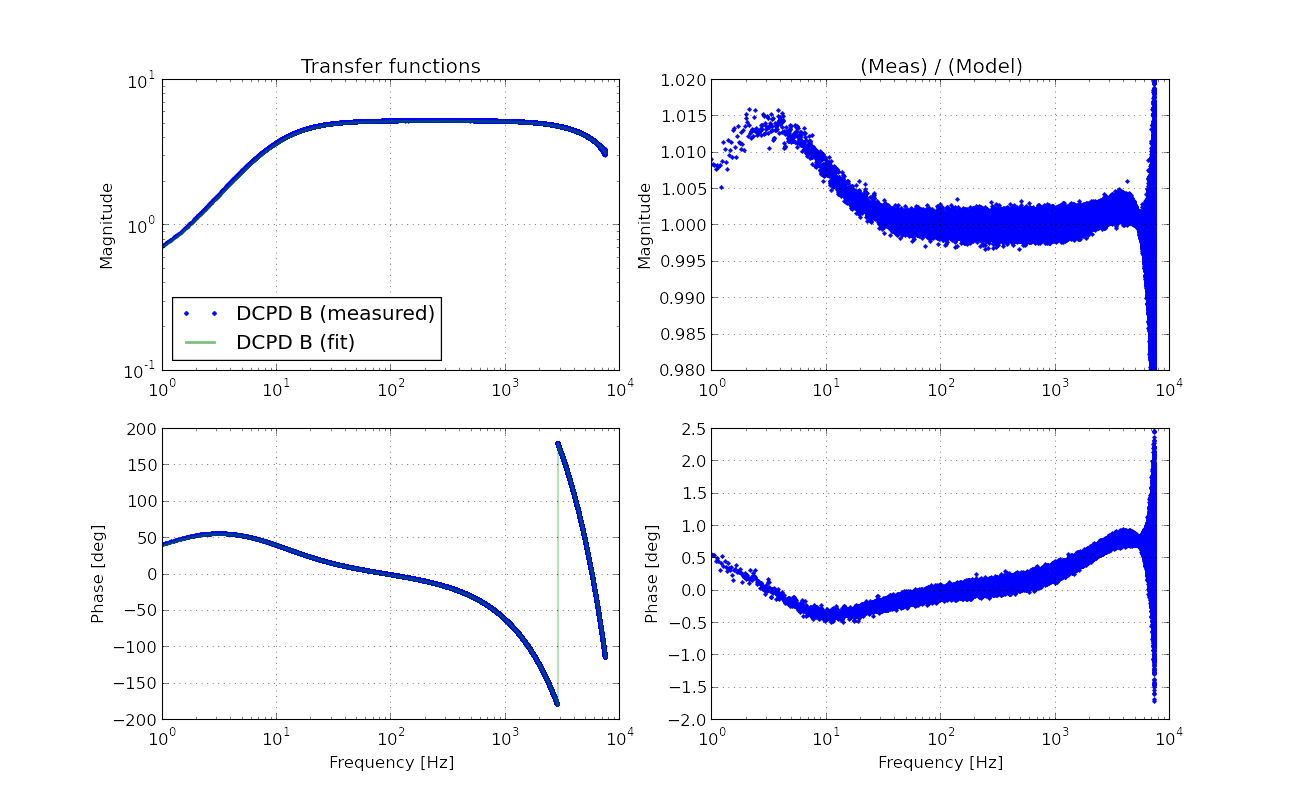
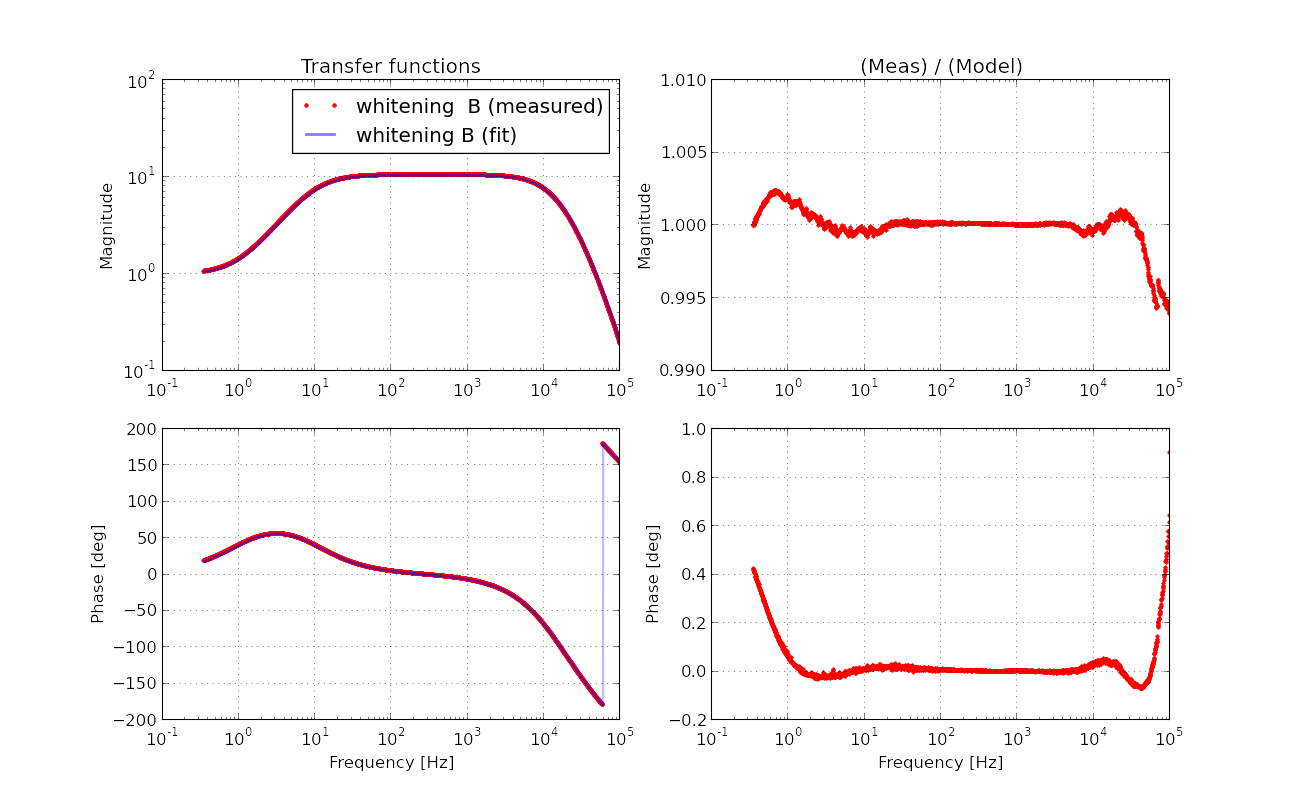
Here are the measured transfer functions with the fitting results.
LISO says:
#Best parameter estimates (for DCPD A):

	#pole6:f =  10.8756718522k +- 1.275 (0.0117%)

	#pole7:f =  10.3442465820 +- 4.165m (0.0403%)

	#zero2:f =  992.1541013425m +- 2.461m (0.248%)

	#factor =  500.1410089072m +- 1.112m (0.222%)
#Best parameter estimates (for DCPD B):

	#pole6:f =  10.8295424180k +- 1.26 (0.0116%)

	#pole7:f =  10.4145450914 +- 4.172m (0.0401%)

	#zero2:f =  998.2444937993m +- 2.463m (0.247%)

	#factor =  499.8306079302m +- 1.105m (0.221%)
The result suggests that the high frequency pole (called pole6 in the fitting code) moved up by 1-2% from 10.7-ish kHz to 10.8-ish kHz in both DCPD A and B compared with the previous data without the whitening filter engaged. I don't have a good explanation for why they moved up. But the point is that the high frequency pole does exist in the whitening configuration that we want to run during O1. Therefore we should definitely include this pole in our calibration model. Additionally, the measurement done at Caltech also shows a reduction in the magnitude as frequency reaches the end of the measurement frequency band at around 6 kHz (S1101603). Therefore I start believing that this high frequency pole is real and do exist in the whitening boards. I guess this effect was not visible in my intemnsity transfer function measurement (alog 20851) because ASC-AS_C, which was my intensity reference, also uses the same whitening circuit (D1001530) as OMC DCPDs.
Another interesting thing is that LISO reports different poles and zeros for the actual whitening filters than the ones reported in DCC (S1101603, or see nice summary by Koji at alog 17647). The pole location seem to be almost the same at a few % level, but the location of zeros differ by more than 10%. This is not cool. This also makes me think that we should re-measure the whitenig filter response.
SVN info
/aligocalibration/trunk/Runs/ER8/H1/Measurements/OMCDCPDs/2015-08-27/LSC_AO_OUT_to_OMC_DCPDs_RandNoise_1whitenings.xml
/aligocalibration/trunk/Runs/ER8/H1/Measurements/OMCDCPDs/2015-08-27/IOPCH9to_IOPCH12_1whitening_tf.txt
/aligocalibration/trunk/Runs/ER8/H1/Measurements/OMCDCPDs/2015-08-27/IOPCH9to_IOPCH13_1whitening_tf.txt
/aligocalibration/trunk/Runs/ER8/H1/Scripts/OMCDCPDs/Liso/fit_LSCCH9toOMCCH12_1whitening.fil
/aligocalibration/trunk/Runs/ER8/H1/Scripts/OMCDCPDs/Liso/fit_LSCCH9toOMCCH12_1whitening.fil
/aligocalibration/trunk/Runs/ER8/H1/Scripts/OMCDCPDs/python/OMC_DCPD_AAand1White.py
/aligocalibration/trunk/Runs/ER8/H1/Results/OMCDCPDs/2015-08-27_DCPD_A_AAand1White.png
/aligocalibration/trunk/Runs/ER8/H1/Results/OMCDCPDs/2015-08-27_DCPD_B_AAand1White.pdf
/aligocalibration/trunk/Runs/ER8/H1/Results/OMCDCPDs/2015-08-27_DCPD_B_AAand1White.png
/aligocalibration/trunk/Runs/ER8/H1/Results/OMCDCPDs/2015-08-27_DCPD_B_AAand1White.pdf
This should be a killer measurement for this long discussion which was triggered by the unexpected high frequency pole-ish behavior in the DCPD signal chain. I have measured the transfer function of the DCPD whitening filter using an SR785 tonight.
The current conclusions are that:
-
A measurement of the whitening filter tells that we need to have two poles at high frequencies-- one at around 18 kHz and the other ar around 14 kHz
- ( In addition, another pole at 98 kHz gives us a better fitting )
- The whitening zero-pole pairs need to be updated in the calibration model and perhaps in the OMC front end model in order to accurately compensate the filter response.
Motivation
There seemed to be one or perhaps multiple high frequency pole(s) at a frequency on the order of 10 kHz. We wanted to include them in the calibration model to be mroe accurately model the phase and time delay. Besides, independtly of the high frequency poles, we noticed that the whitening zero-pole pairs were not precisely at the frequencies specified in the DCC document of an early measurement (S1101603). These two things pushed us to re-measure the analog transfer function of the whitening filter, in particular the first stage which is the one we usually use in full lock.
Measurement
I again used the coil driver test box only for the reason that I wanted a single-ended-to-differential convertor. With an SR785, I performed a swept sine measurement for ch4 and ch5 which correpond to DCPD A and B respectively. The 1st stage of the whitening filter was engaged while the rest are disabled for both A and B whitening filters. The whitening gain was set to 0 dB for both A and B. These settings are nominal that we usually operate in full lock. The exctiation amplitude was 200 mVp-p in the positive and negative inputs which resulted in 2 Vp-p at highest at the positive and negative outputs. With a scope, I confirmed that there was an obvious distortion or saturation in the signal at the outputs.
Results
I fitted the measured data with four poles and one zero. See the fitting results shown below.
As shown in the plot, the fitting is good from 1 Hz to 10 kHz at 0.1% level in absolute amplitude and 0.02 deg level in the phase. Here are the raw output from LISO.
#Best parameter estimates (for DCPD A):

	#pole0:f =  18.6402825833k +- 20.23 (0.109%)

	#pole1:f =  14.5121291389k +- 12.5 (0.0861%)

	#pole2:f =  98.9771014448k +- 60.89 (0.0615%)

	#pole3:f =  10.2675781089 +- 660.2u (0.00643%)

	#zero0:f =  973.9581771978m +- 151.1u (0.0155%)

	#factor =  993.7495082788m +- 129.2u (0.013%)


	#Best parameter estimates (for DCPD B):

	#pole0:f =  18.4126906482k +- 21.61 (0.117%)

	#pole1:f =  14.6312083283k +- 13.88 (0.0949%)

	#pole2:f =  98.3231767285k +- 60.51 (0.0615%)

	#pole3:f =  10.3405121747 +- 667u (0.00645%)

	#zero0:f =  980.5696173840m +- 152.8u (0.0156%)

	#factor =  993.4759822630m +- 129.8u (0.0131%)
In order to get a better fitting, I ended up adding three poles at high frequencies -- two of them seem to stay between 10 and 20 kHz while the third one tends to be at around 98 kHz. I did not need to have a delay at all because this is just an analog circuit.
SVN info
/aligocalibration/trunk/Runs/ER8/H1/Measurements/OMCDCPDs/2015-09-02/DCPD_A_1whitening.dat
/aligocalibration/trunk/Runs/ER8/H1/Measurements/OMCDCPDs/2015-09-02/DCPD_B_1whitening.dat
/aligocalibration/trunk/Runs/ER8/H1/Scripts/OMCDCPDs/Liso/fit_whitening_1st_stage_DCPD_A.fil
/aligocalibration/trunk/Runs/ER8/H1/Scripts/OMCDCPDs/Liso/fit_whitening_1st_stage_DCPD_B.fil
/aligocalibration/trunk/Runs/ER8/H1/Scripts/OMCDCPDs/python/whitening_1st_stage.py
/aligocalibration/trunk/Runs/ER8/H1/Results/OMCDCPDs/OMCDCPDs/2015-09-02_whitening_1st_stage_DCPD_A.pdf
/aligocalibration/trunk/Runs/ER8/H1/Results/OMCDCPDs/OMCDCPDs/2015-09-02_whitening_1st_stage_DCPD_A.png
/aligocalibration/trunk/Runs/ER8/H1/Results/OMCDCPDs/OMCDCPDs/2015-09-02_whitening_1st_stage_DCPD_B.pdf
/aligocalibration/trunk/Runs/ER8/H1/Results/OMCDCPDs/OMCDCPDs/2015-09-02_whitening_1st_stage_DCPD_B.png
Are these above-Nyquist-freq poles the ones I've reported with LHO ALOG 17647?
If so, they are the high freq poles associated with the OMC DCPD in-vac preamps.
Since they exist above the Nyquist frequency (~8kHz), it is not straight forward to compensate them.
As they show up like a linear time delay at low freq, we decided to leave them uncompensated in April. (Refer Daniel S, Jeff K).
This corresponds to ~18us delay. I thought this was already accommodated in the DARM calibration model described in LHO ALOG 17951
and the following comments (particularly in LHO ALOG 18037). Were they dropped at some point?
Koji,
No. They are not the ones in DCPDC's preamp. These poles are found in the whitening board by directly measuring it.
As for preamp's super-nyquist poles, they have been incorporated in our calibration model and have been actually used in the upsampled FIR pipeline without approximating it as a time delay. So we did not drop the ones from the preamp.
For double chek my conclusion written above, I went back to the original plot in alog 21101. With the newly discovered high frequency poles of the whitening board (alog 21131) included, the measurement agrees with the model with 1-ish % descrepancy up to 5 kHz in magnitude as shown in the attached plot.
This is good enough  .
.
The code and figure:
/aligocalibration/trunk/Runs/ER8/H1/Scripts/OMCDCPDs/Matlab/OMC_DCPD_AnalogChain_TimeSeries.m
/aligocalibration/trunk/Runs/ER8/H1/Results/OMCDCPDs/2015-09-01_OMC_DCPDs_timeseries_analysis.pdf
The data for the whitening filters in the above entries are obsolete as of 30/6/2016.
The whitening chassis was replaced by a different unit on June 28th in 2016 (alog 28010). A new measurement was taken on June 30th in 2016 (alog 28087).