Kiwamu, Nutsinee
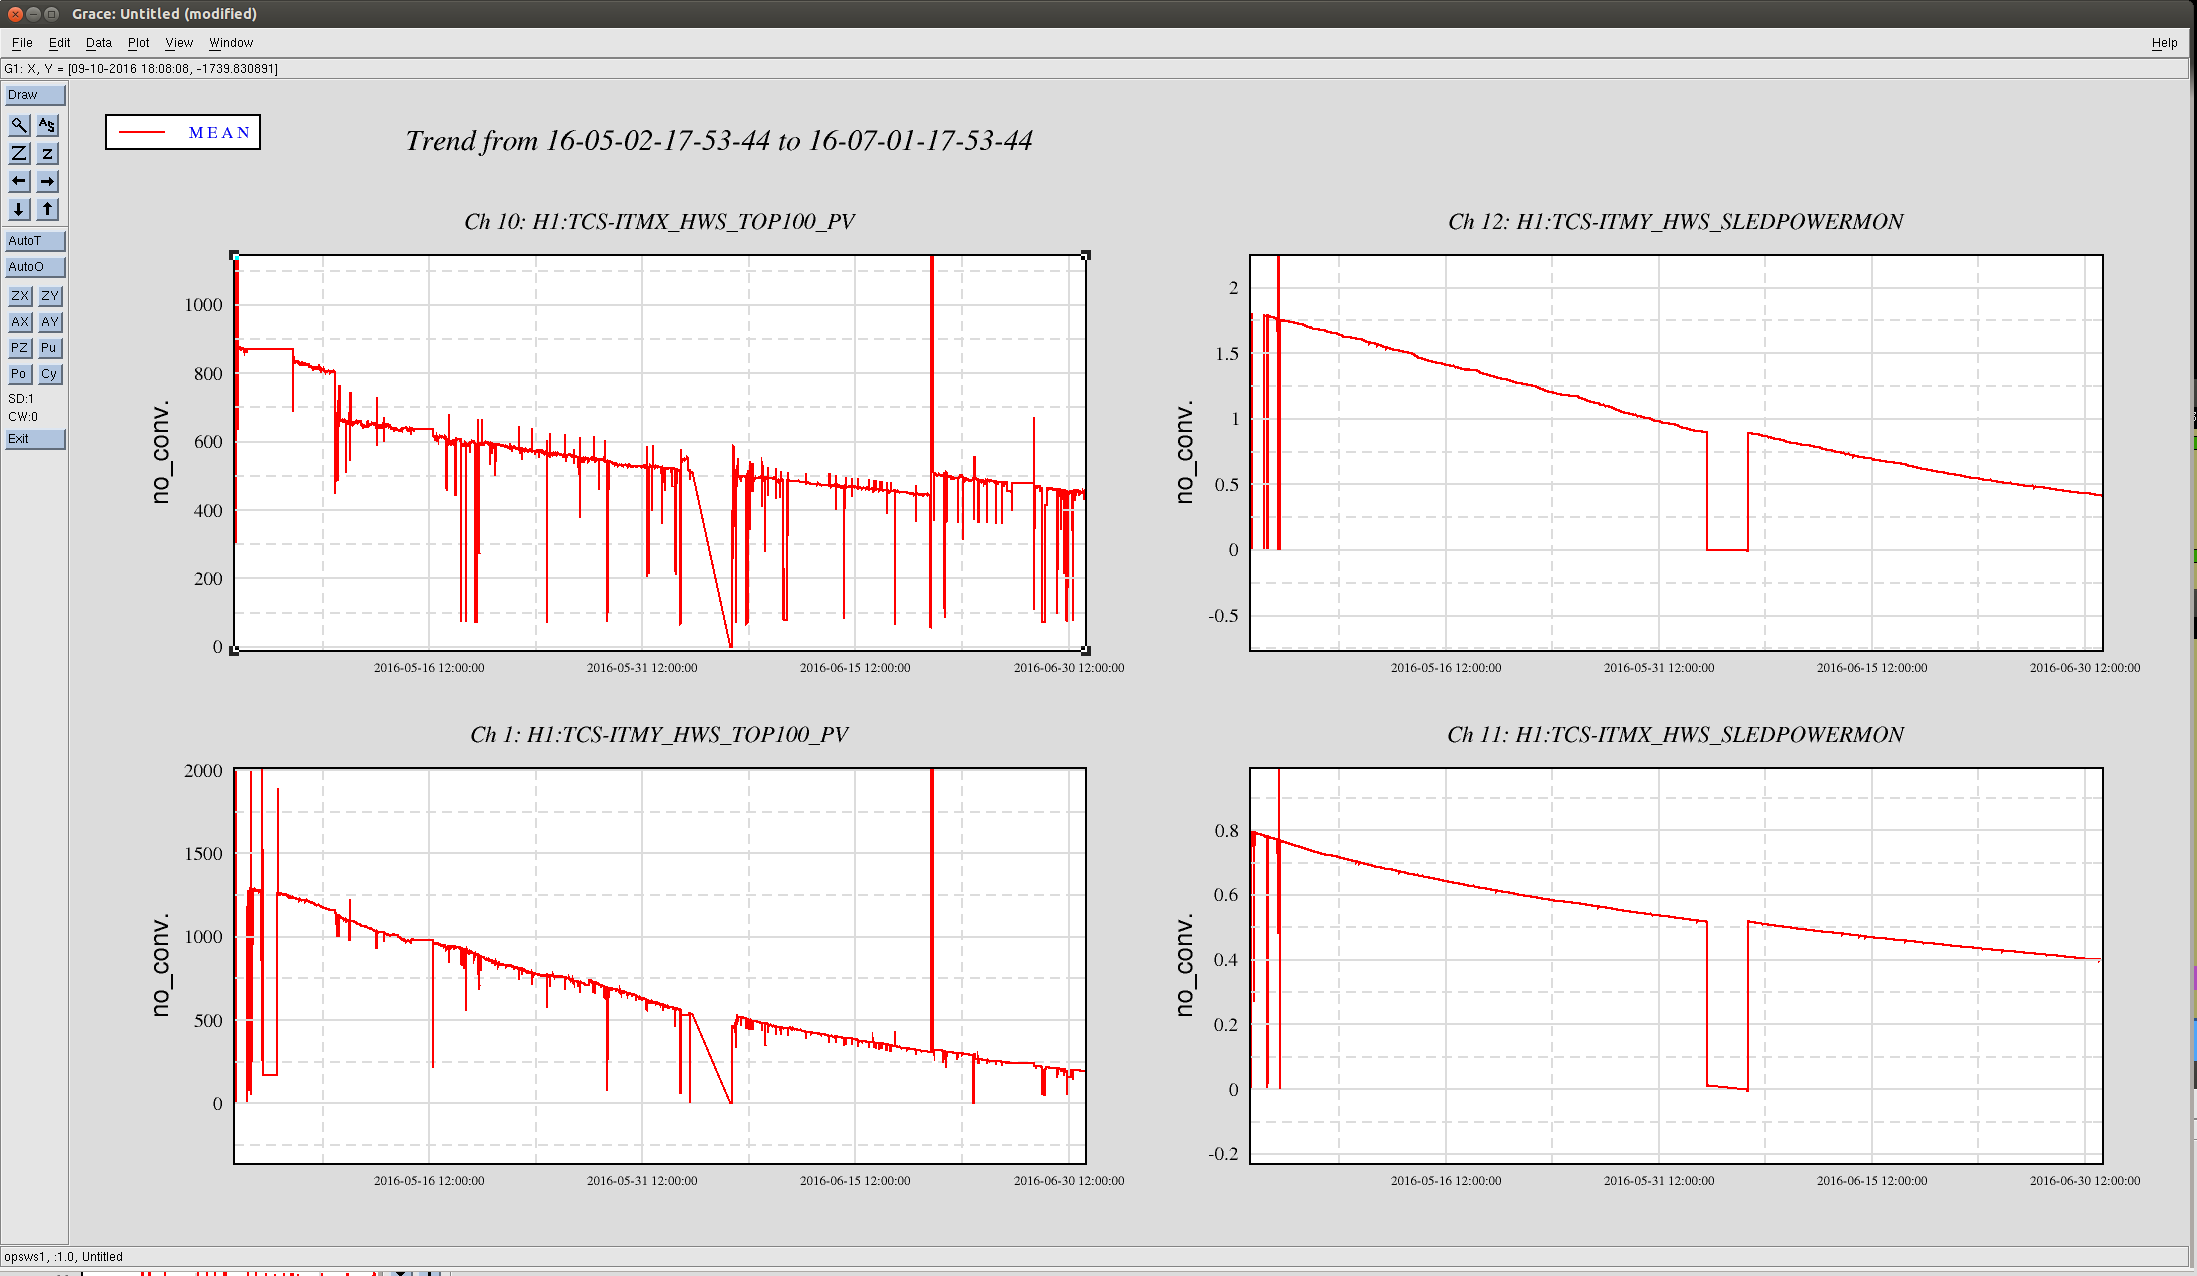
DIAG_MAIN complained about HWSY having bad peak counts so we investigated. The first plot shows both HWS mean sled power and peak counts trend over the past 60 days. *HWSY sled is losing 23 mW per day (running at 103 mA current) while HWSX sled is losing 6.5 mW per day (running at 98 mA current). HWSY SLED was replaced back in April 26th, 2015.
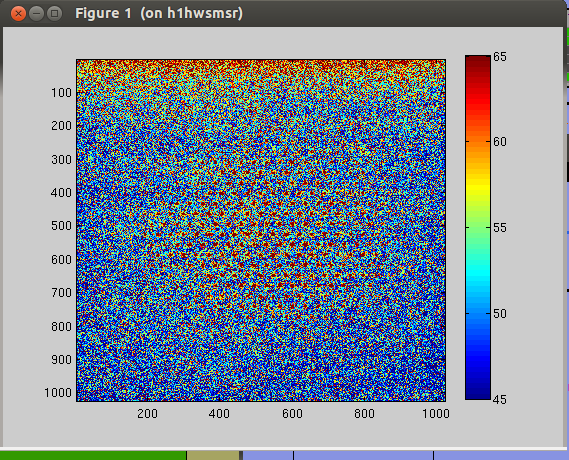
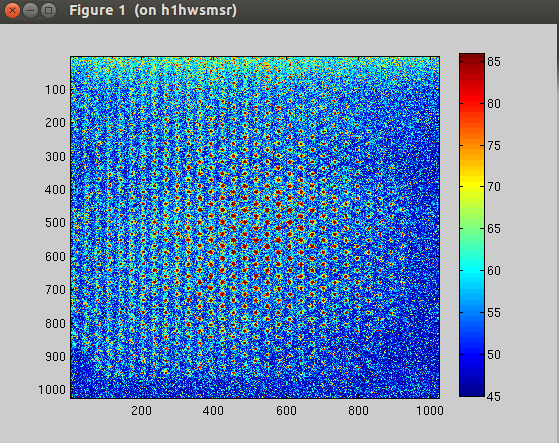
Here I attached screenshots of what the stream images looks like right now for both HWSX (right) and HWSY (left). The bright spots on HWSY stream images are not as bright compared to HWSX, suggesting that the low number of peak counts is caused by the deterioration of the sled power ("peak counts" are refered to number of red spots around the center).
We have some spares (I think Y sled is 840 nm. We have three of those). One thing we could do here is to replace the sled next Tuesday so we can get some useful (live) data during ER9.
Commissioners are using TCS HWS to investigate any unexpected absorbtion of the ITM optics. It can be use to look at the affect of the CO2 heating real time. So it's important to keep this thing running.
I keep the HWSY code running for now since Aidan was able to use the recorded data for offline analysis.
----------
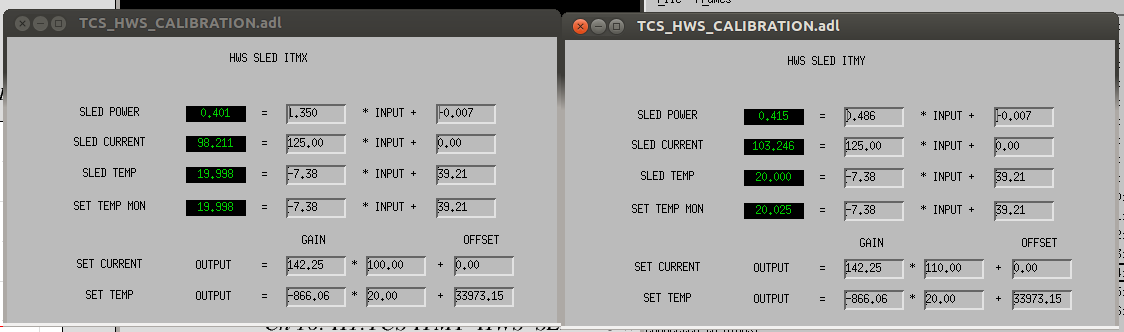
*Later I found out that the power calibration now is slightly off from calibration back in March 1st (alog25806). The below I attached the calibration as of today (Been these values since March 23rd). HWSY calibration stays the same but the rate of power loss per day for HWSX would be overestimated by ~30%. This also affects the previous analysis of sled power deterioration in alog26341 slightly.
Aidan has confirmed that HWSY code output bad data on his end. I stopped the code so it won't write anymore junk data to the disk.