carl.blair@LIGO.ORG - posted 11:48, Wednesday 06 July 2016 (28185)
Measurements of ETMY PI ESD
[Ross, Carl]
Measurements of the ETMY PI ESD path were made over the last week. The DAC was also driven to saturation to investigate its behaviour. We also drove multiple lines.
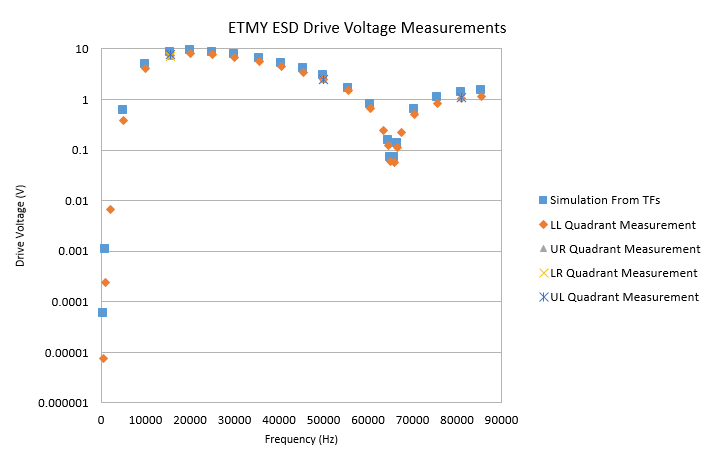
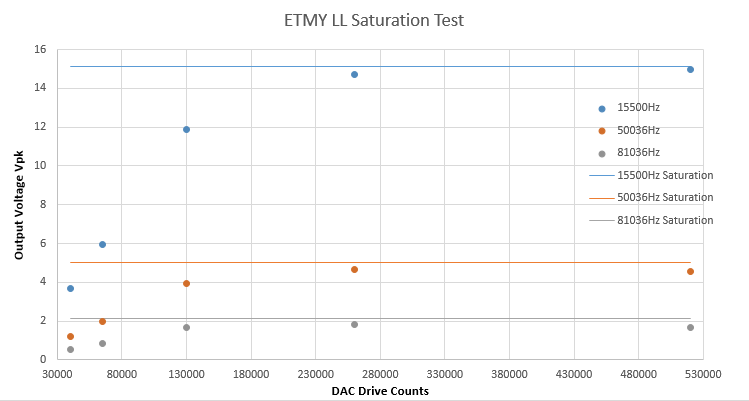
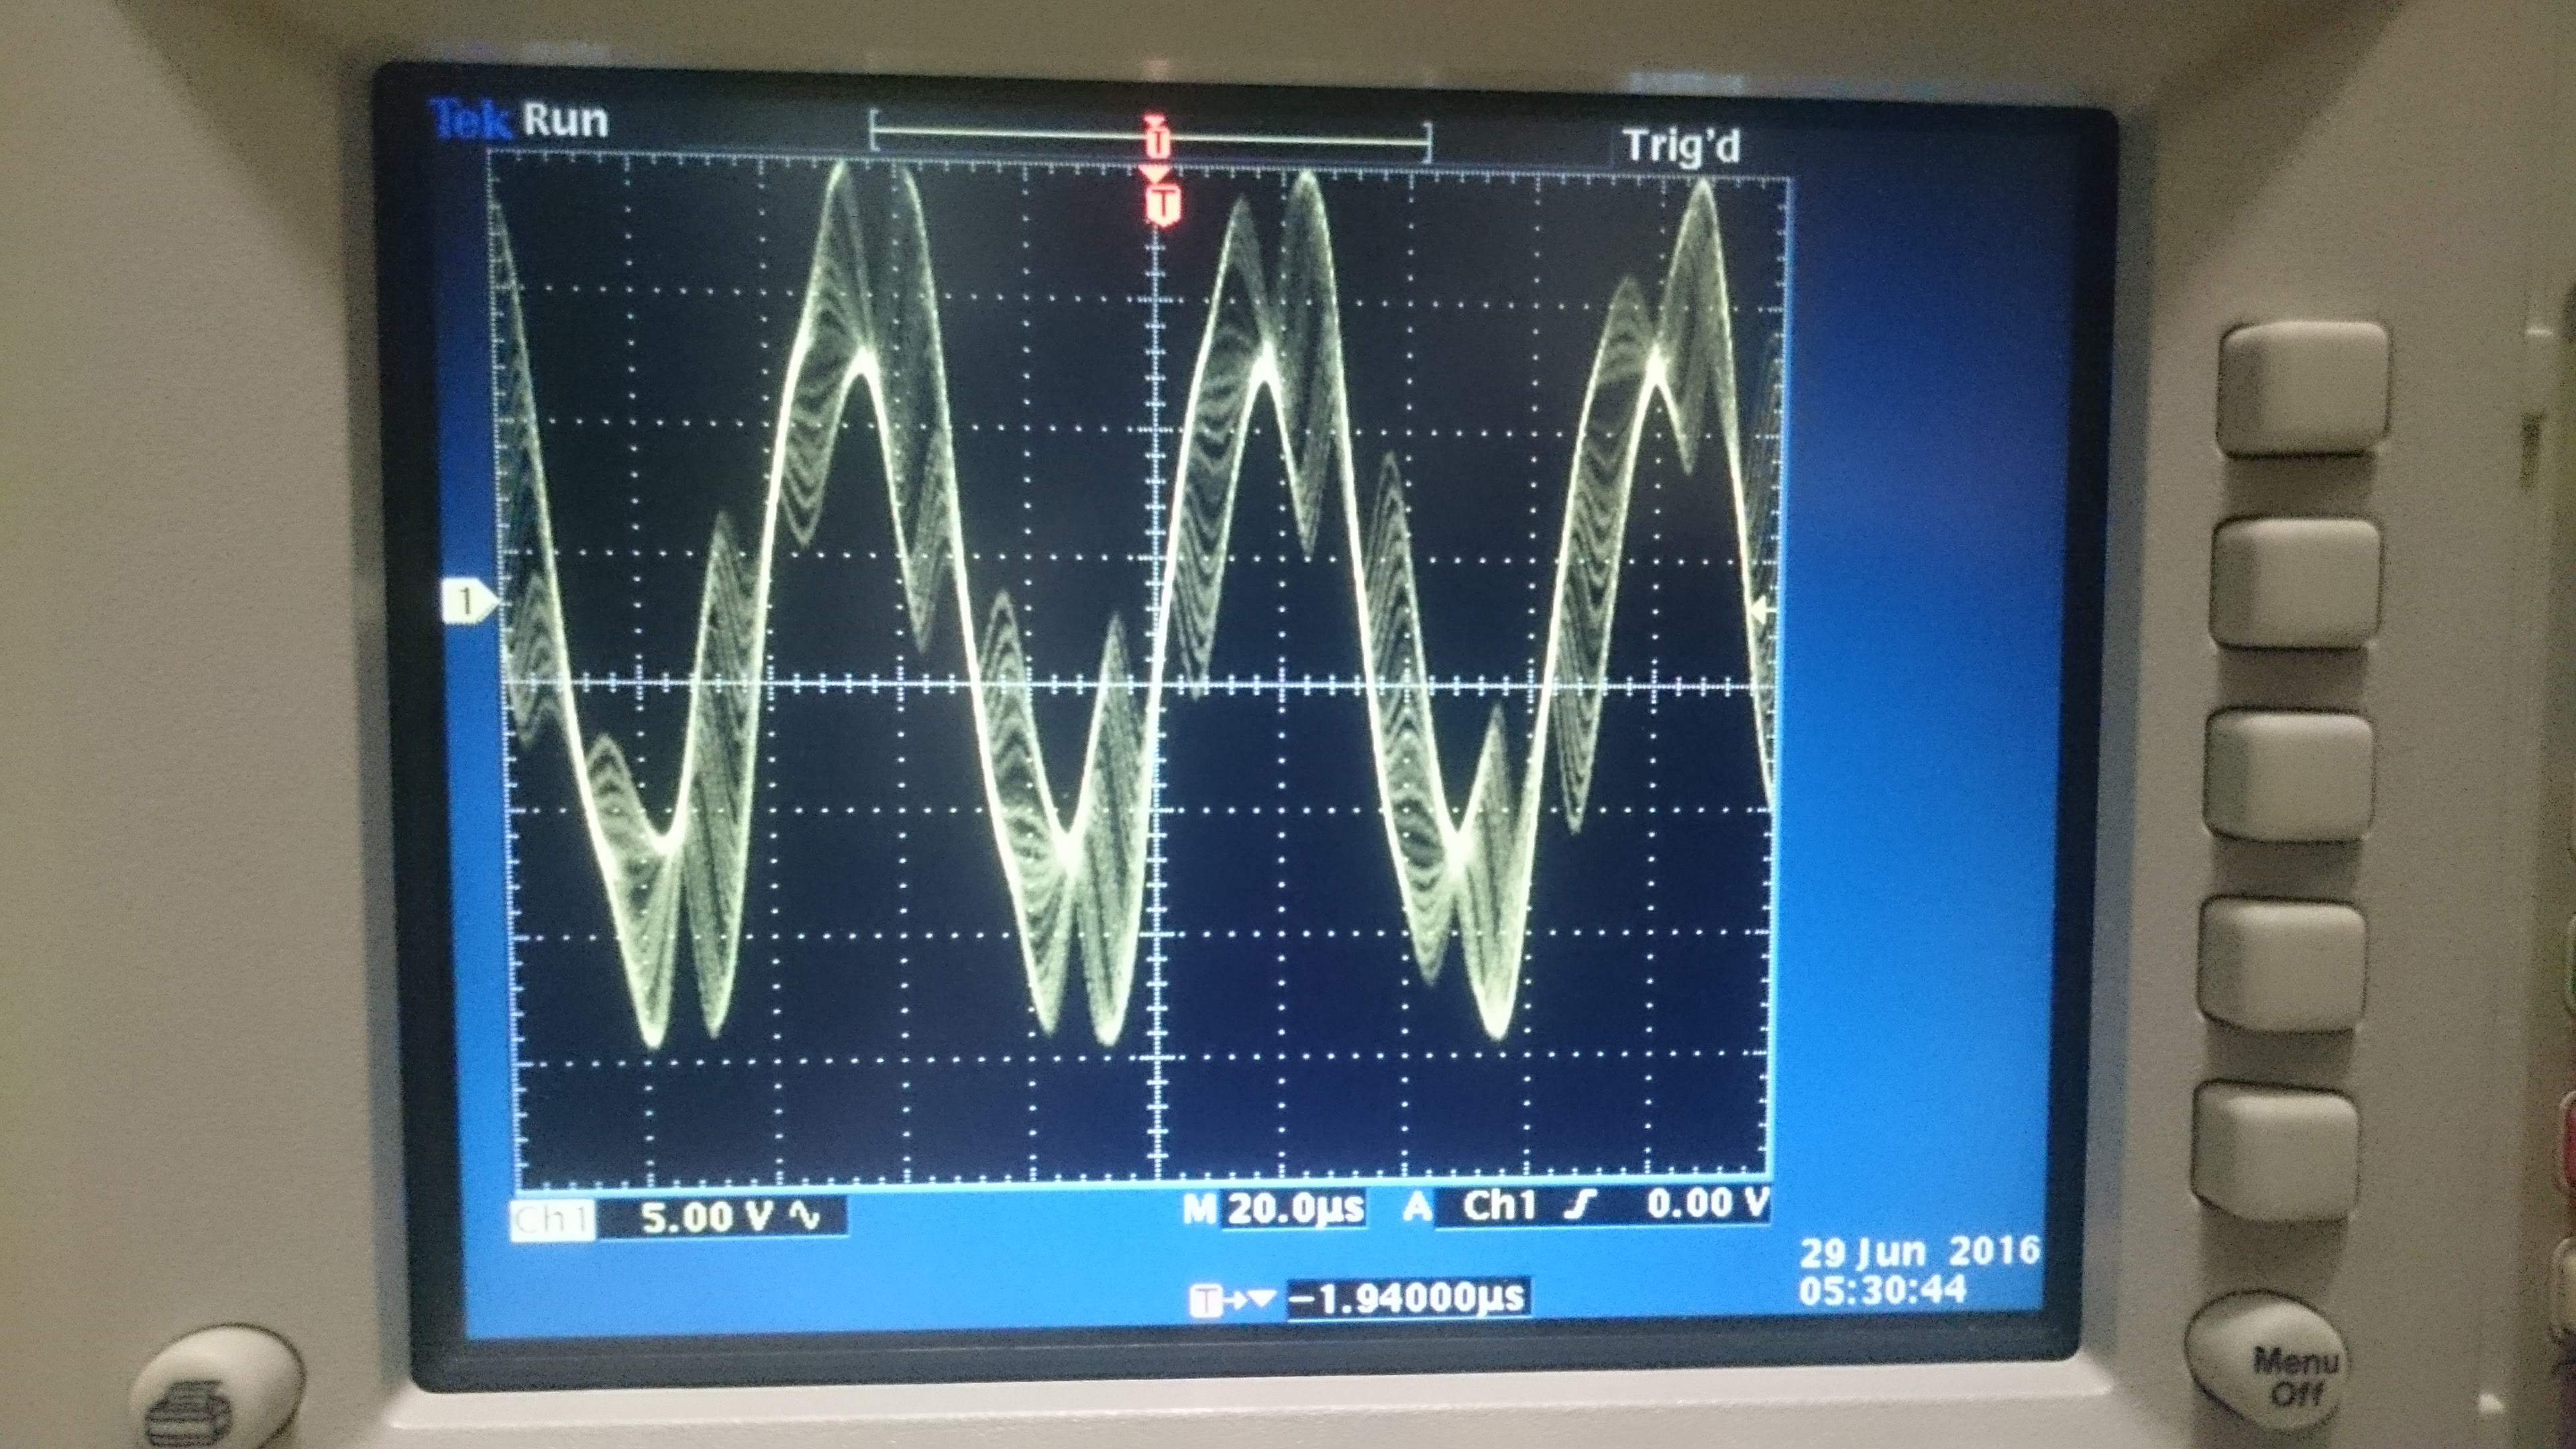
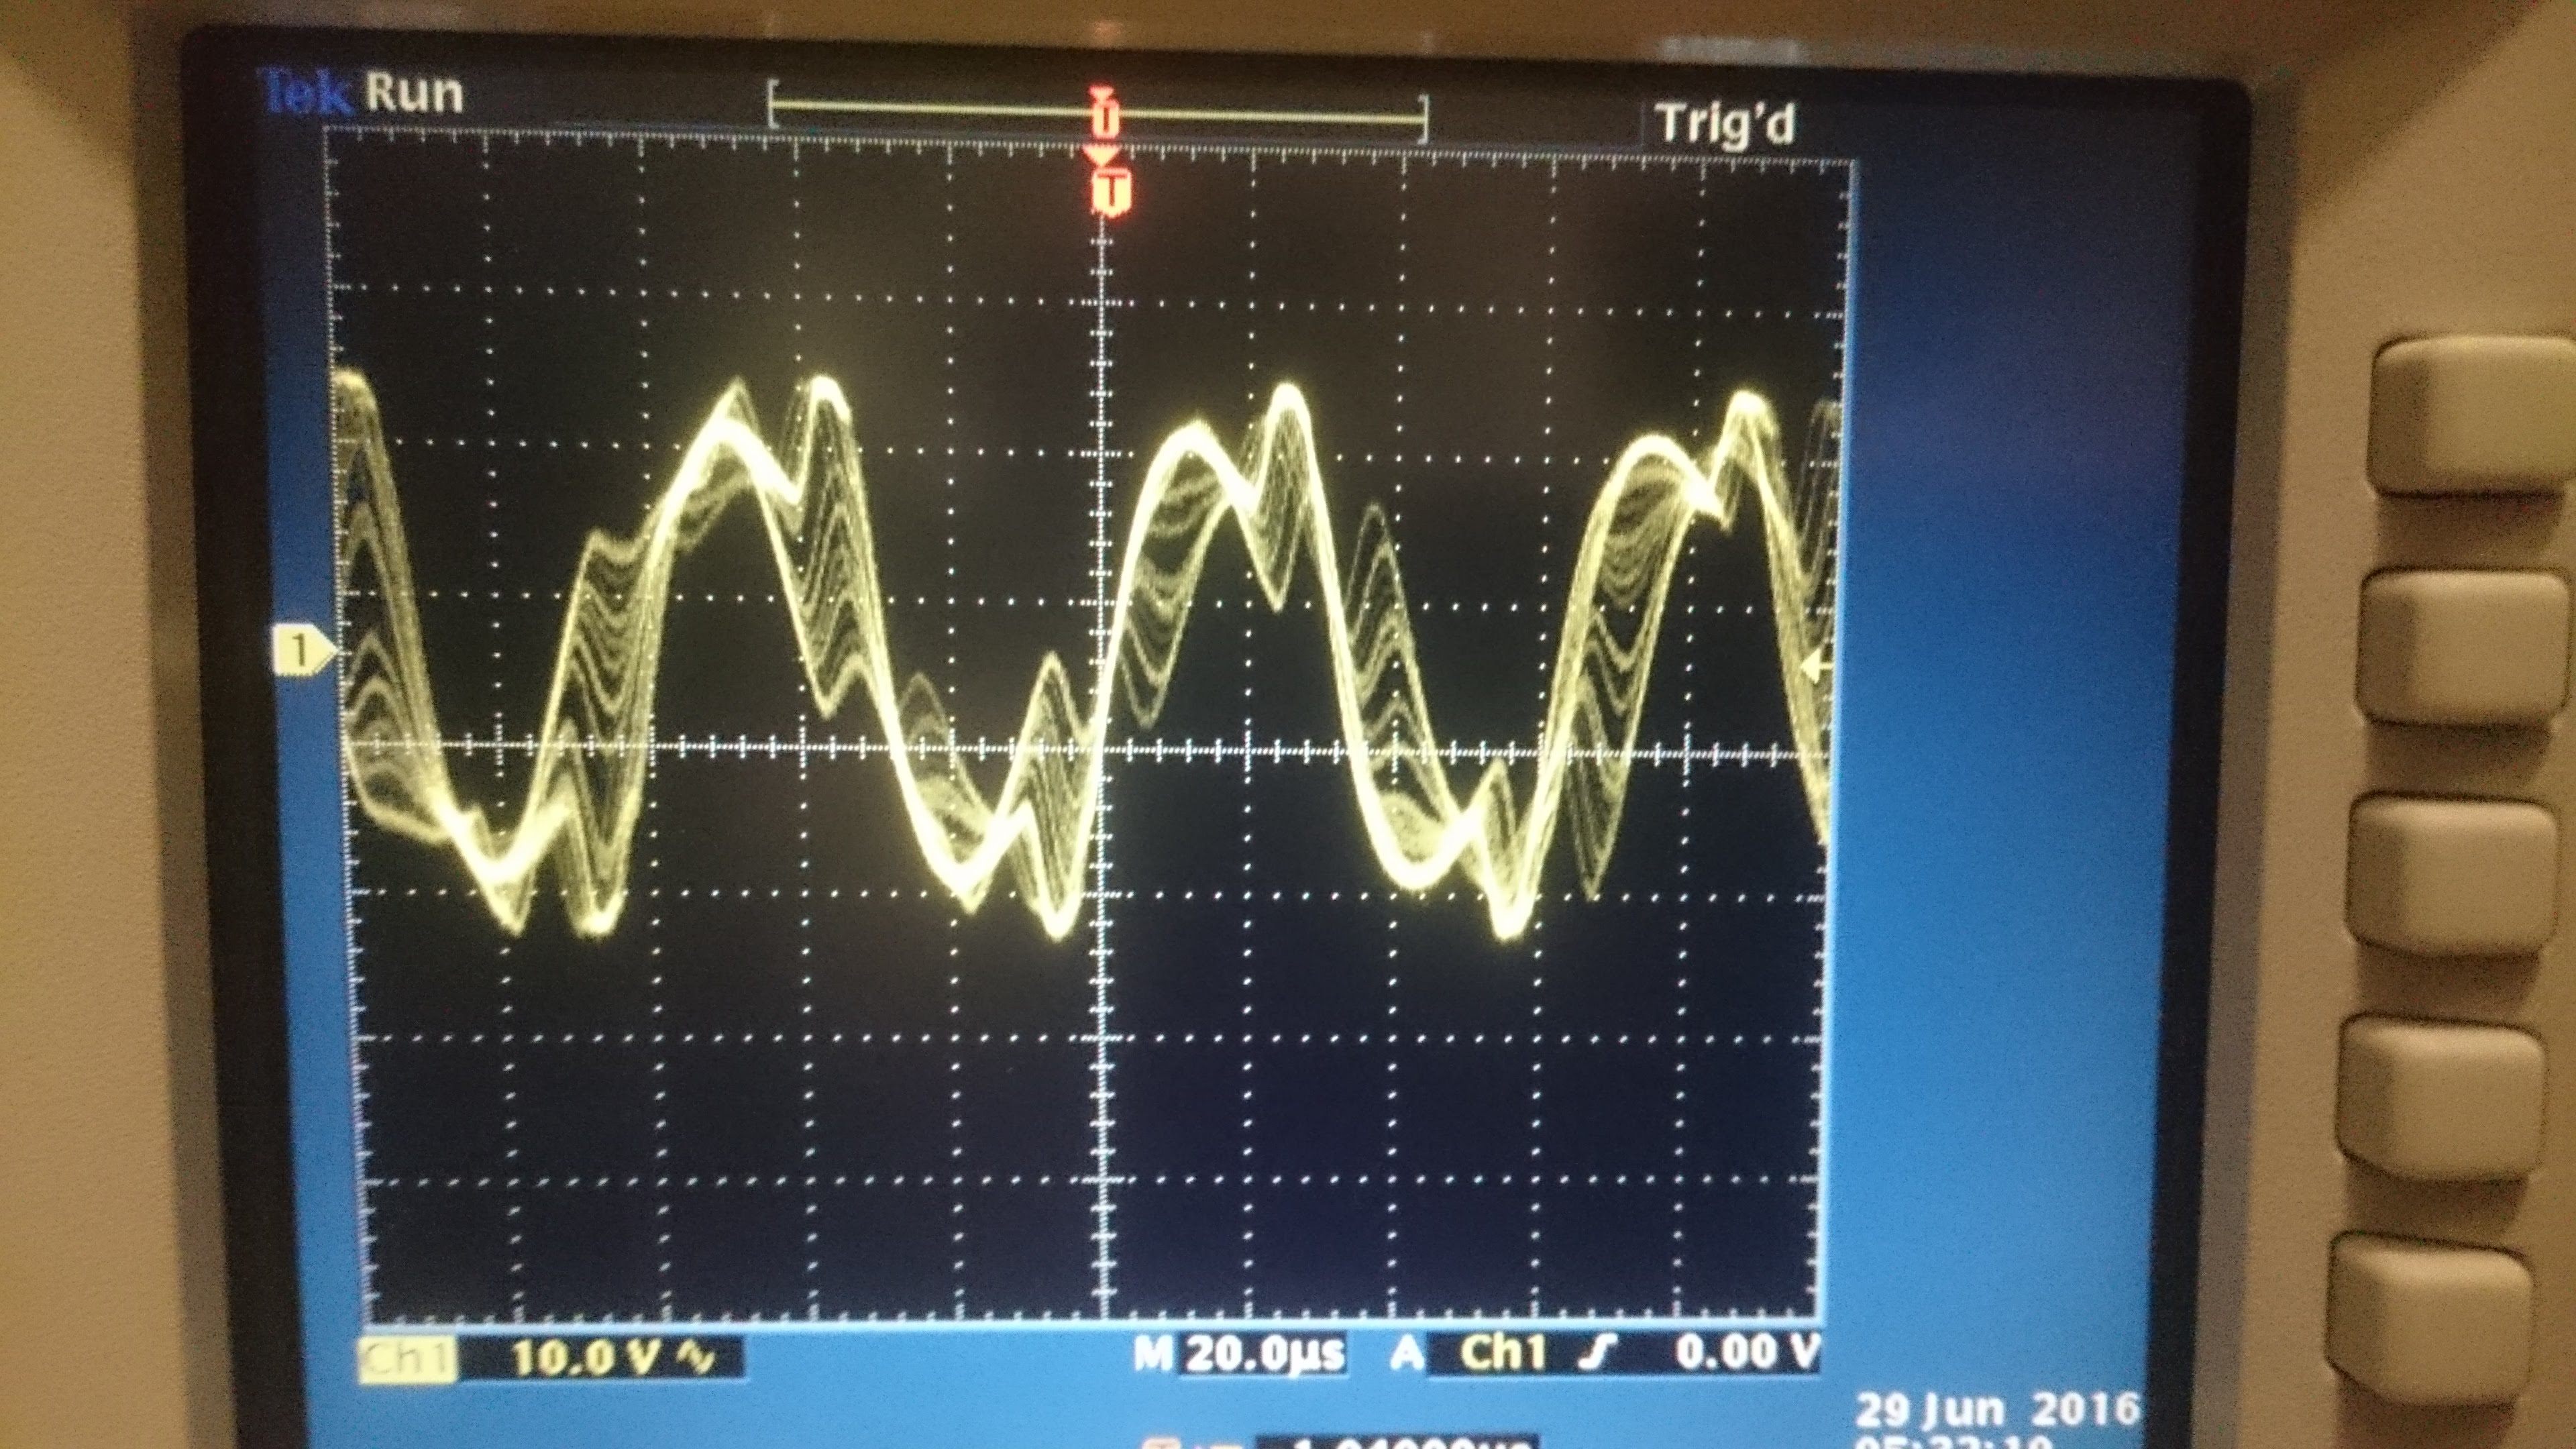
The measurement of the output voltage to the ESD with 80,000 counts drive is shown in the first figure. It is very similar to measurements from other test masses. The second image show the DAC saturation results. We see the sub nyquist signal reach approximately its expected first Fourier component of a square wave ~ 4/pi times the saturation sinusoidal amplitude. The super-nyquist frequencies do not reach this amplitude ratio. This makes sense, as the sub nyquist saturates it removes lower amplitude super-nyquist information. The saturated waveform does not however look like a square wave at all. See the third and fourth image for an example of the waveform unsaturated and saturated with the DAC driven with ~ one million counts.
[Ross, Carl]
Measuremets of the ETMY PI ESD path were made over the last week. The DAC was also driven to saturation to see if it behaved as expected. And we drove multiple lines.
The measurement of the output voltage to the ESD with 80,000 counts drive is shown in the first figure. It is ver similar to measurments from other test masses. The second image show the DAC saturation results. We see the sub nyquist signal reach approximately its expected first fourier component of a square wave ~ 4/pi times the saturation sinusoidal amplitude. The super-nyquist frequencies do not reach this amplitude ratio. This makes sense, as the sub nyquist saturates more it removes lower amplitude supernyquist information. The saturated waveform does not however look like a square wave at all. See the fourth image for an example of the waveform when the DAC is driven with ~ one million counts.
When two lines were driven the result was the expected beat signal. The short video shows the beat in the spectrum showing sidebands when saturating and the time domain waveform.
When two lines were driven the result was the expected beat signal. The short video shows the beat in the spectrum showing sidebands when saturating and the time domain waveform.
When two lines were driven the result was the expected beat signal. The short video shows the beat in the spectrum showing side-bands when the signals are in phase and saturating and the time domain waveform.[Ross, Carl]
Measuremets of the ETMY PI ESD path were made over the last week. The DAC was also driven to saturation to see if it behaved as expected. And we drove multiple lines.
The measurement of the output voltage to the ESD with 80,000 counts drive is shown in the first figure. It is ver similar to measurments from other test masses. The second image show the DAC saturation results. We see the sub nyquist signal reach approximately its expected first fourier component of a square wave ~ 4/pi times the saturation sinusoidal amplitude. The super-nyquist frequencies do not reach this amplitude ratio. This makes sense, as the sub nyquist saturates more it removes lower amplitude supernyquist information. The saturated waveform does not however look like a square wave at all. See the fourth image for an example of the waveform when the DAC is driven with ~ one million counts.
When two lines were driven the result was the expected beat signal. The short video shows the beat in the spectrum showing sidebands when saturating and the time domain waveform.
Images attached to this report
Non-image files attached to this report
