BS beam is not centered and it might be moving with power.
Last Friday, I placed a digital camera on a tripod in front of the CRT for the analog BS video looking at BS from BSHR side, and took some pictures. I conclude the following:
- BS beam position is systematically shifted to the left by some millimeters when viewing BS HR surface.
- When increasing the power from 10W to 40W, the beam moves to the left (i.e. more clipping loss) and down.
- BS beam position is also systematically lower by some millimeters.
It's only digital camera image of CRT screen of analog video that saturates at 40W (but not really badly). Take it with a grain of salt, but if you believe that the pictures are not unreasonable representation of the reality, the following shows the BS beam positions at each power.
| 10W | 40W | |
| PIT from center (mm, positive=low) | 7.5 | 8.2 |
| YAW (mm, positive=right viewed from BSHR side) | -5.5 | -6.5 |
Note that YAW offset is seen from the -X+Y direction. You need to divide YAW (but not PIT) by sqrt(2) to convert it to the lateral beam shift.
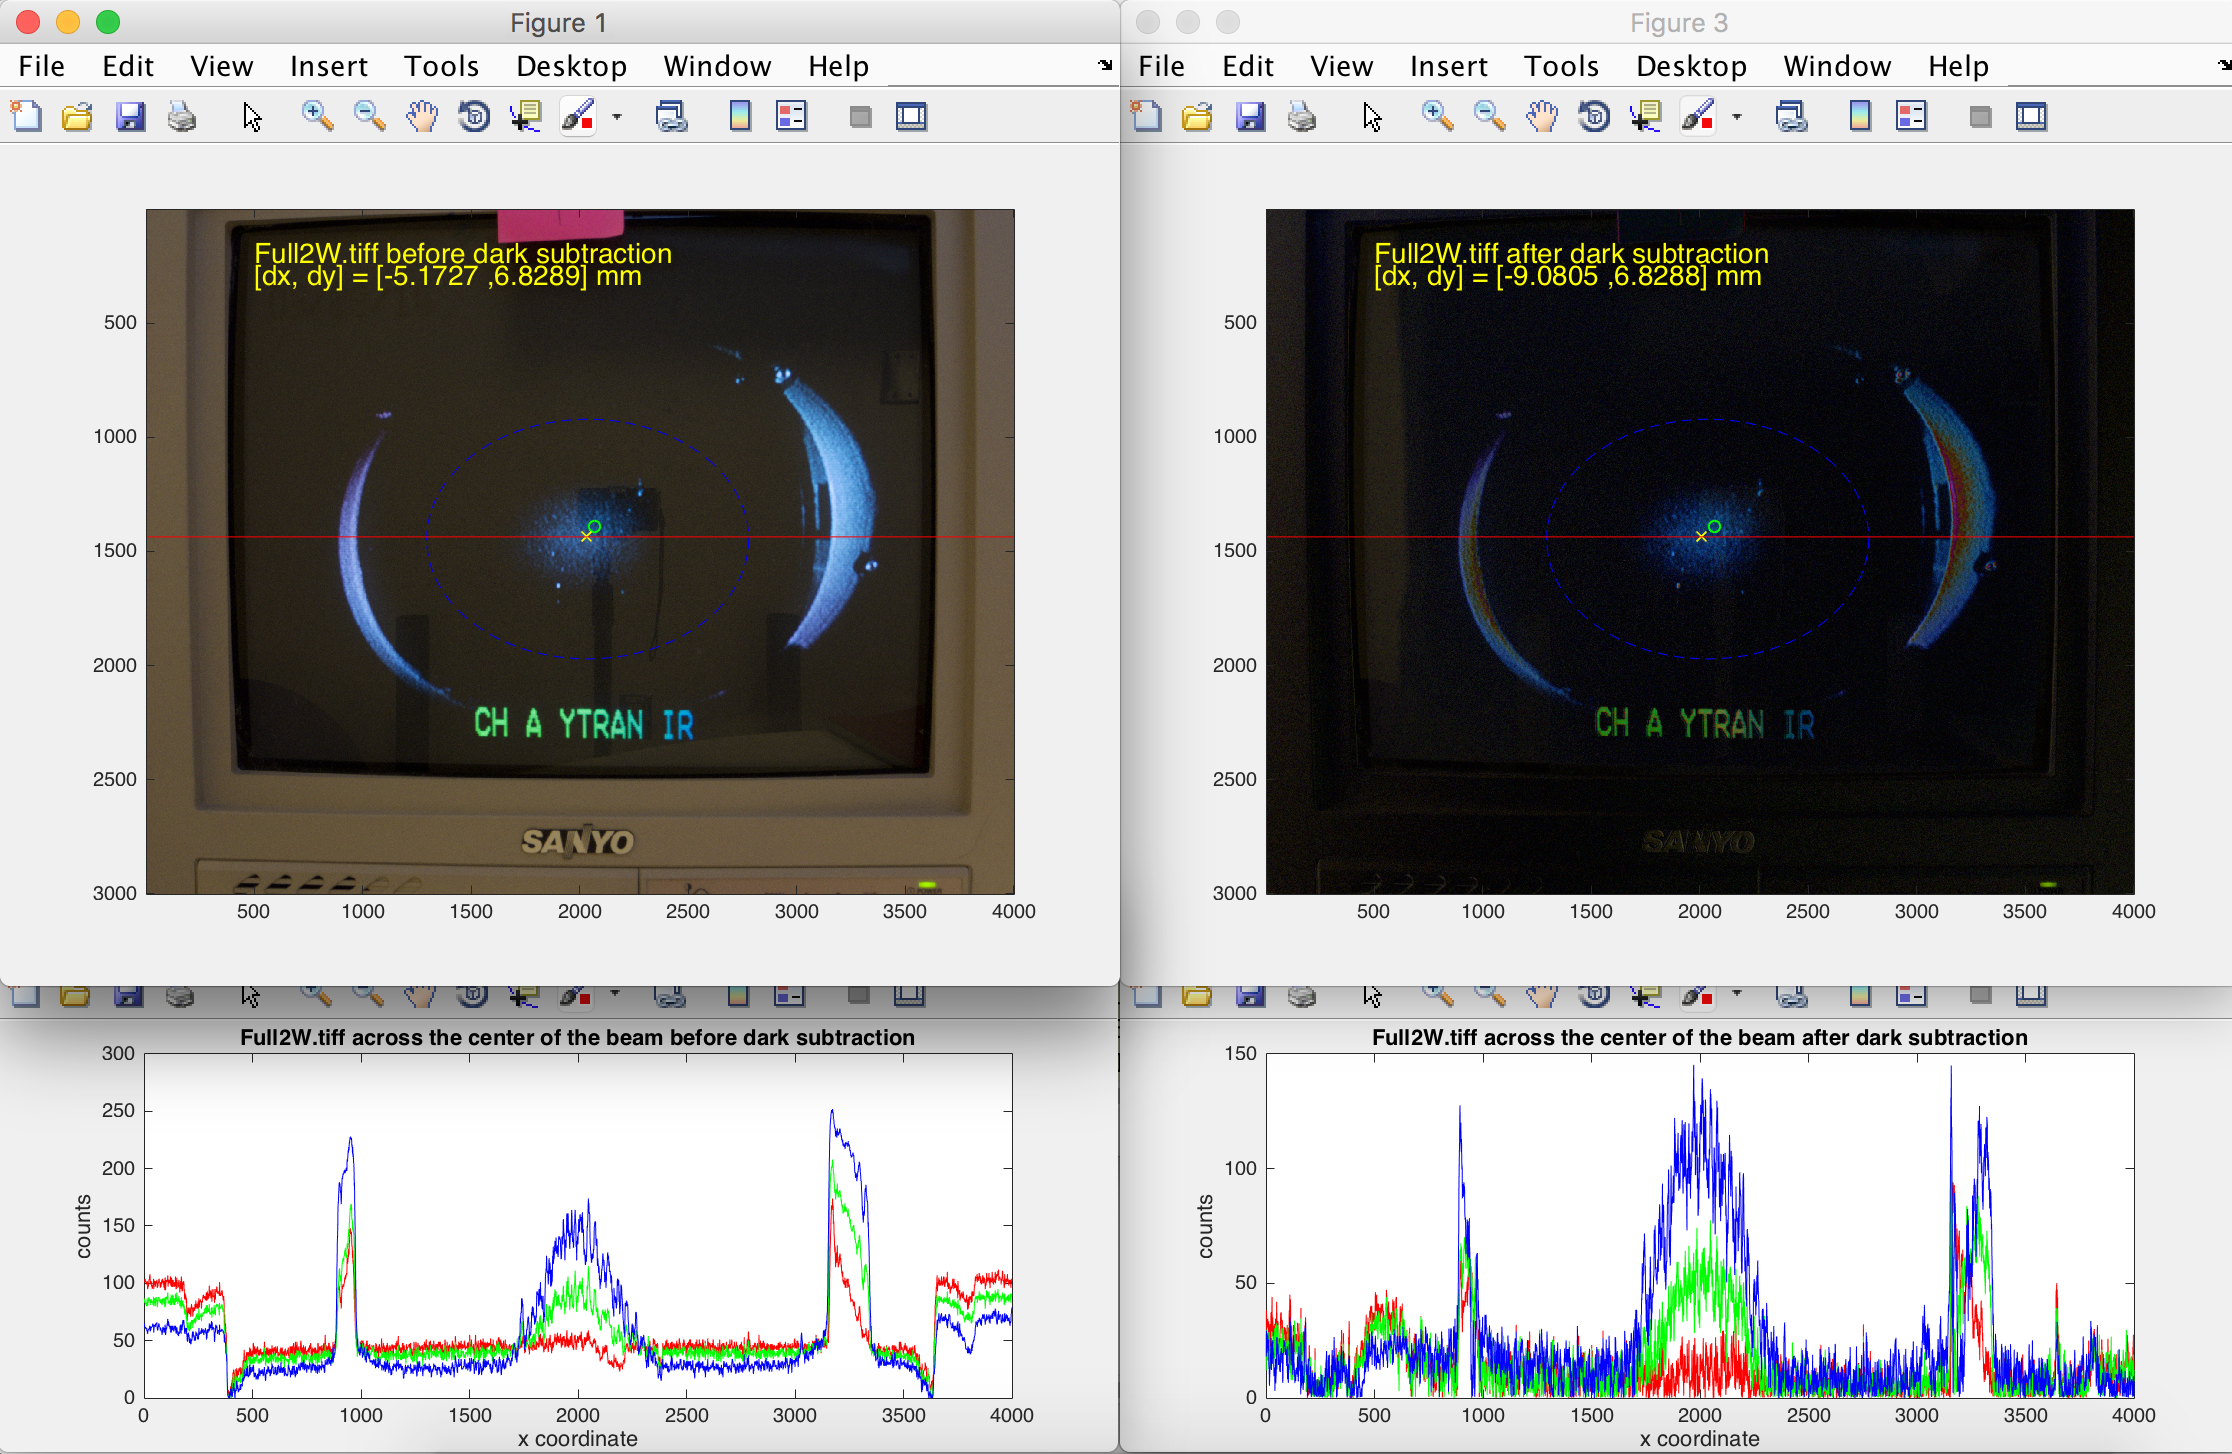
I also took 2W picture but it's dubious because the background (dark) image subtraction didn't work well (see below).
I don't know for now how significant this is as far as the recycling gain is concerned. I'll ask simulators.
In the mean time, it might be useful to explore CSOFT offsets.
Fundamental assumptions.
Video lens, CRT screen and the digital camera are all reasonably rectlinear.
Bright thing is the beam on BSHR, not on BSAR.
BS X and Y elliptical baffle are as in D1200704, 703, 750, and the position of BS relative to baffles is exactly as in D1500239.
Mapping from picture to the physical position.
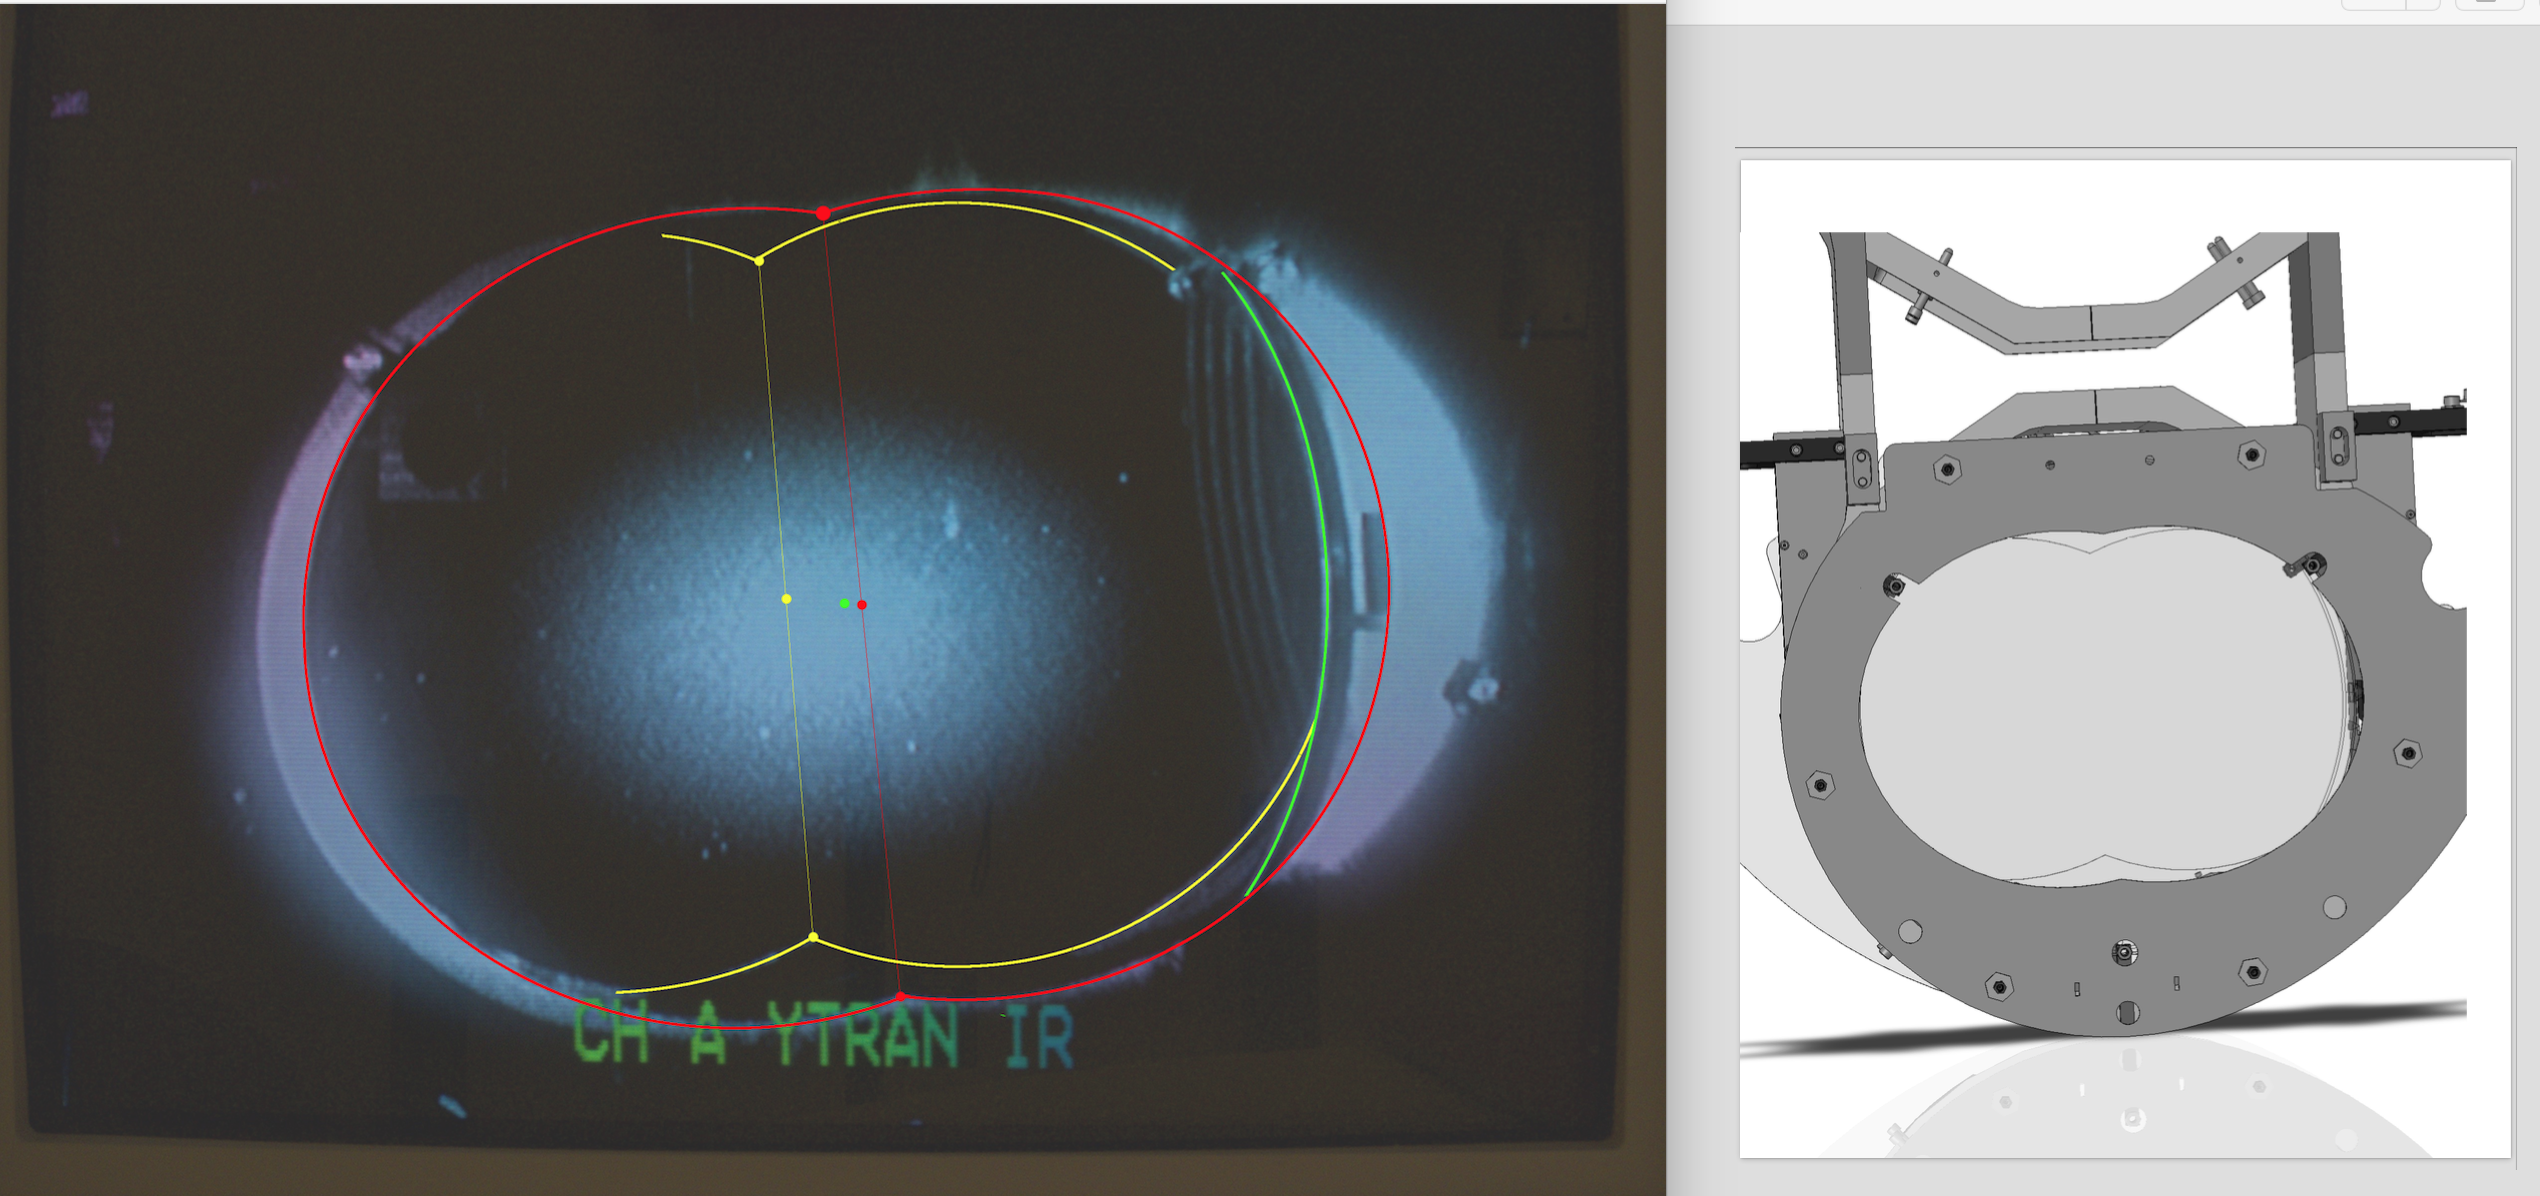
The first attachment is an annotation, so to speak, of one of my pictures (40W full lock) and the screen shot of CAD drawing D1500239 looking at the BS from roughly the same POV.
In the picture, red line is the edge of the BS Y elliptical baffle hole, yellow is X, green is the back side (AR) edge of the BS.
There are two black rectangular things between the red and the green line. Larger one is the side of the wire protection baffle structure. Smaller one is probably the ear on BS.
Baffle hole edge comprise two identical ellipses. The narrowest part is defined by two apexes (apices?) or points where two ellipses intersect. For mapping purpose I ignore all edges and only use these two points per baffle. Red and yellow vertical lines and dots on the picture are the center lines and the center point of Y and X baffle hole, respectively.
Since I know the physical position of these four points (two per baffle), distance from Y baffle to the BSHR surface, and from BSHR surface to X baffle, I can map e.g. the physical center of BSHR surface to this image shown as green dot in the first attachment. I can also map (X, Y) coordinate of any point on the BSHR surface in this picture to the physical coordinate.
Note that you need to account for the fact that we're looking through 60mm-thick BS to look at X baffle (but not Y and BSHR).
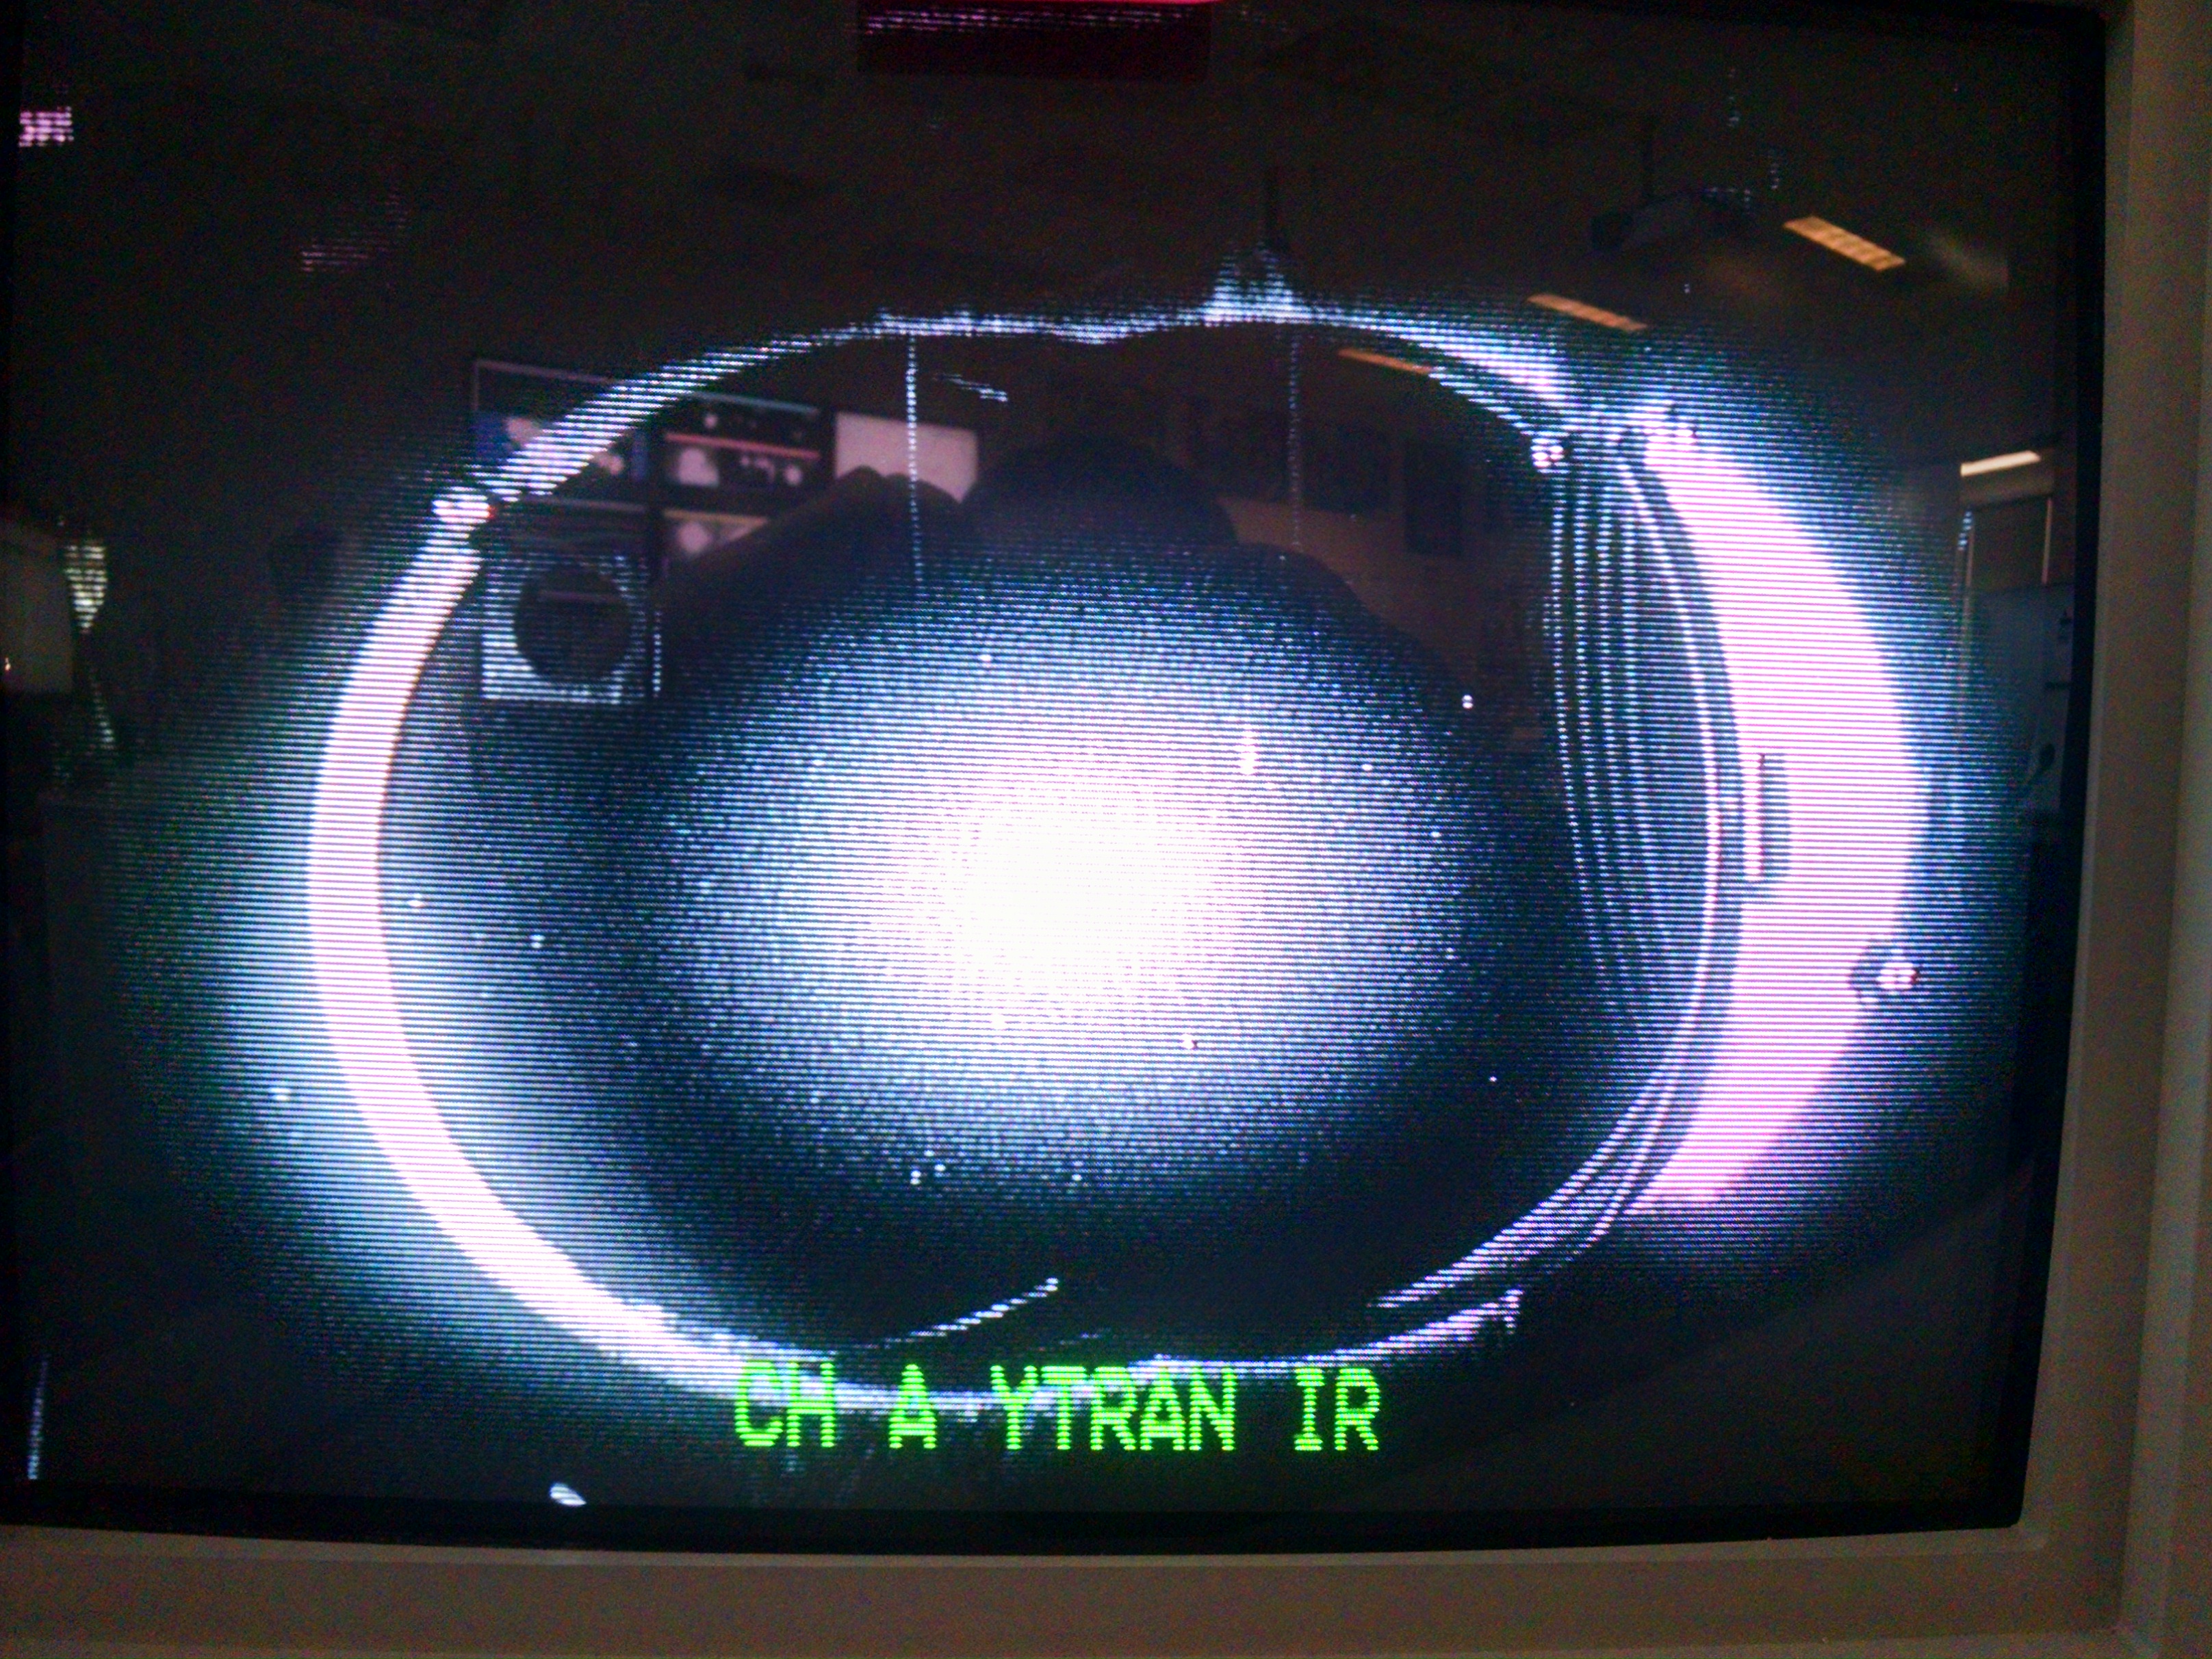
The position of two apexes for the Y baffle is quite well defined, but X is somewhat dubious because none of the pictures shows both sides of the apexes on X baffle (see e.g. second attachment). I assume that the edge on the picture ends at one of the points. This means that the yellow line could be to the right than in the picture, which subsequently push the BSHR center to the right, which subsequently push the YAW offsets in the table above more negative (i.e. larger YAW offset).
The length calibration on this image at BSHR surface is about 0.15mm/pixel. This is mostly determined by the distance between the Y baffle apexes and only weakly dependent on the X baffle because BSHR is much closer to the Y baffle than X.
How the images were taken and processed.
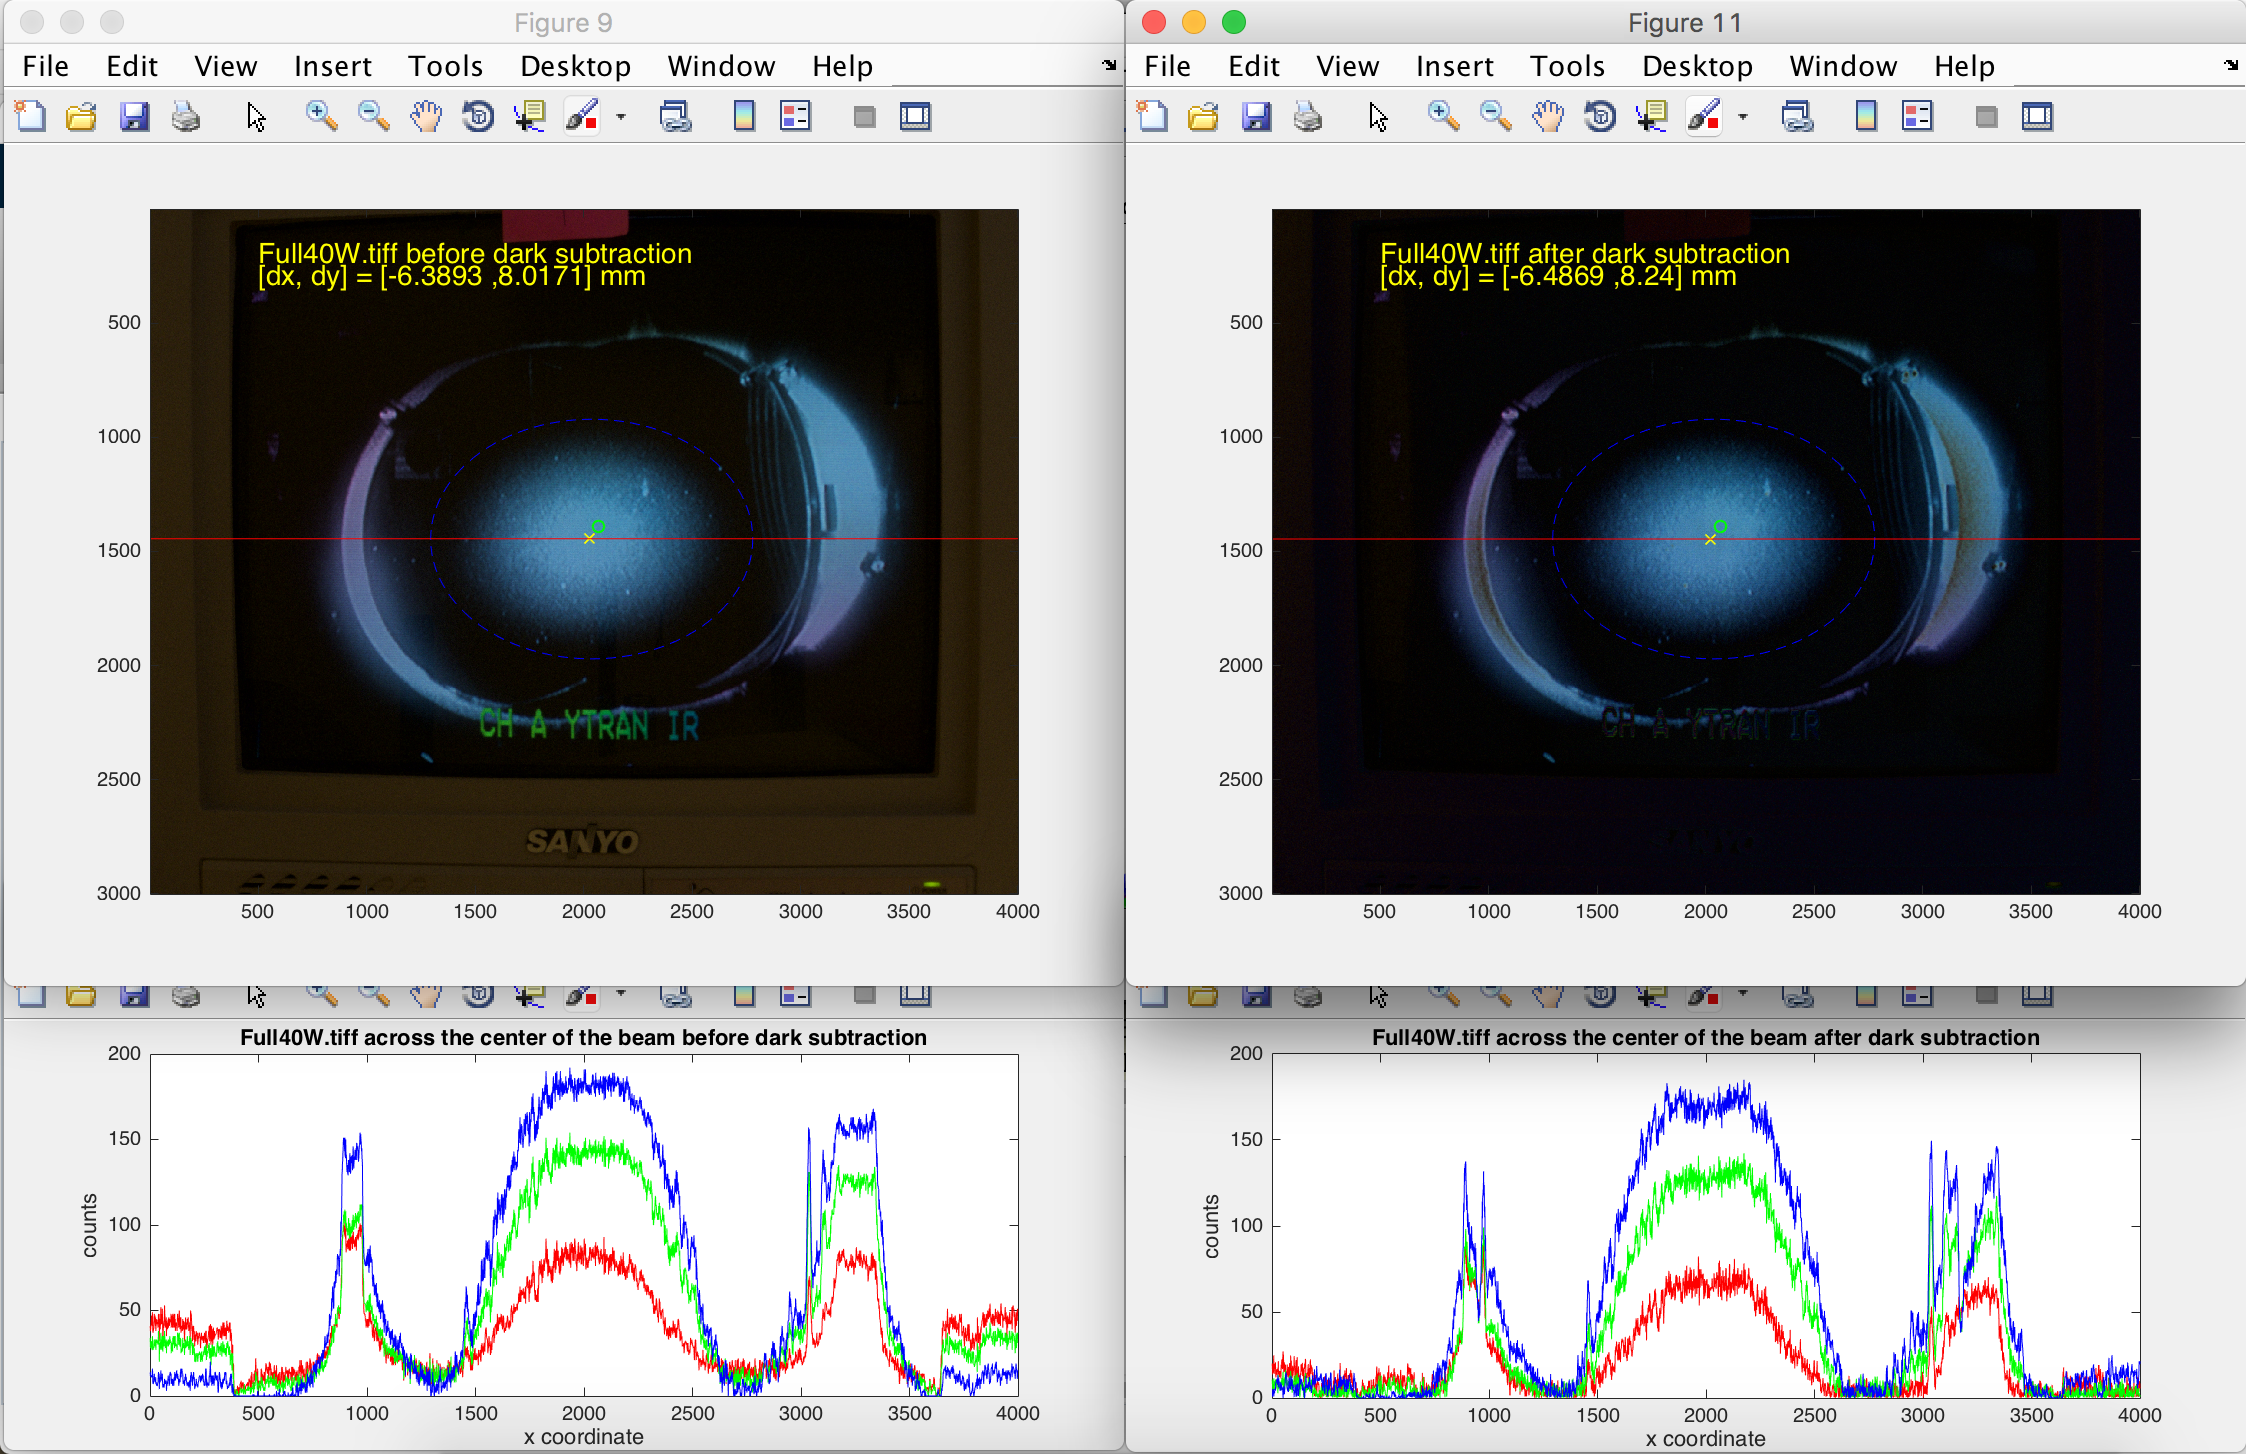
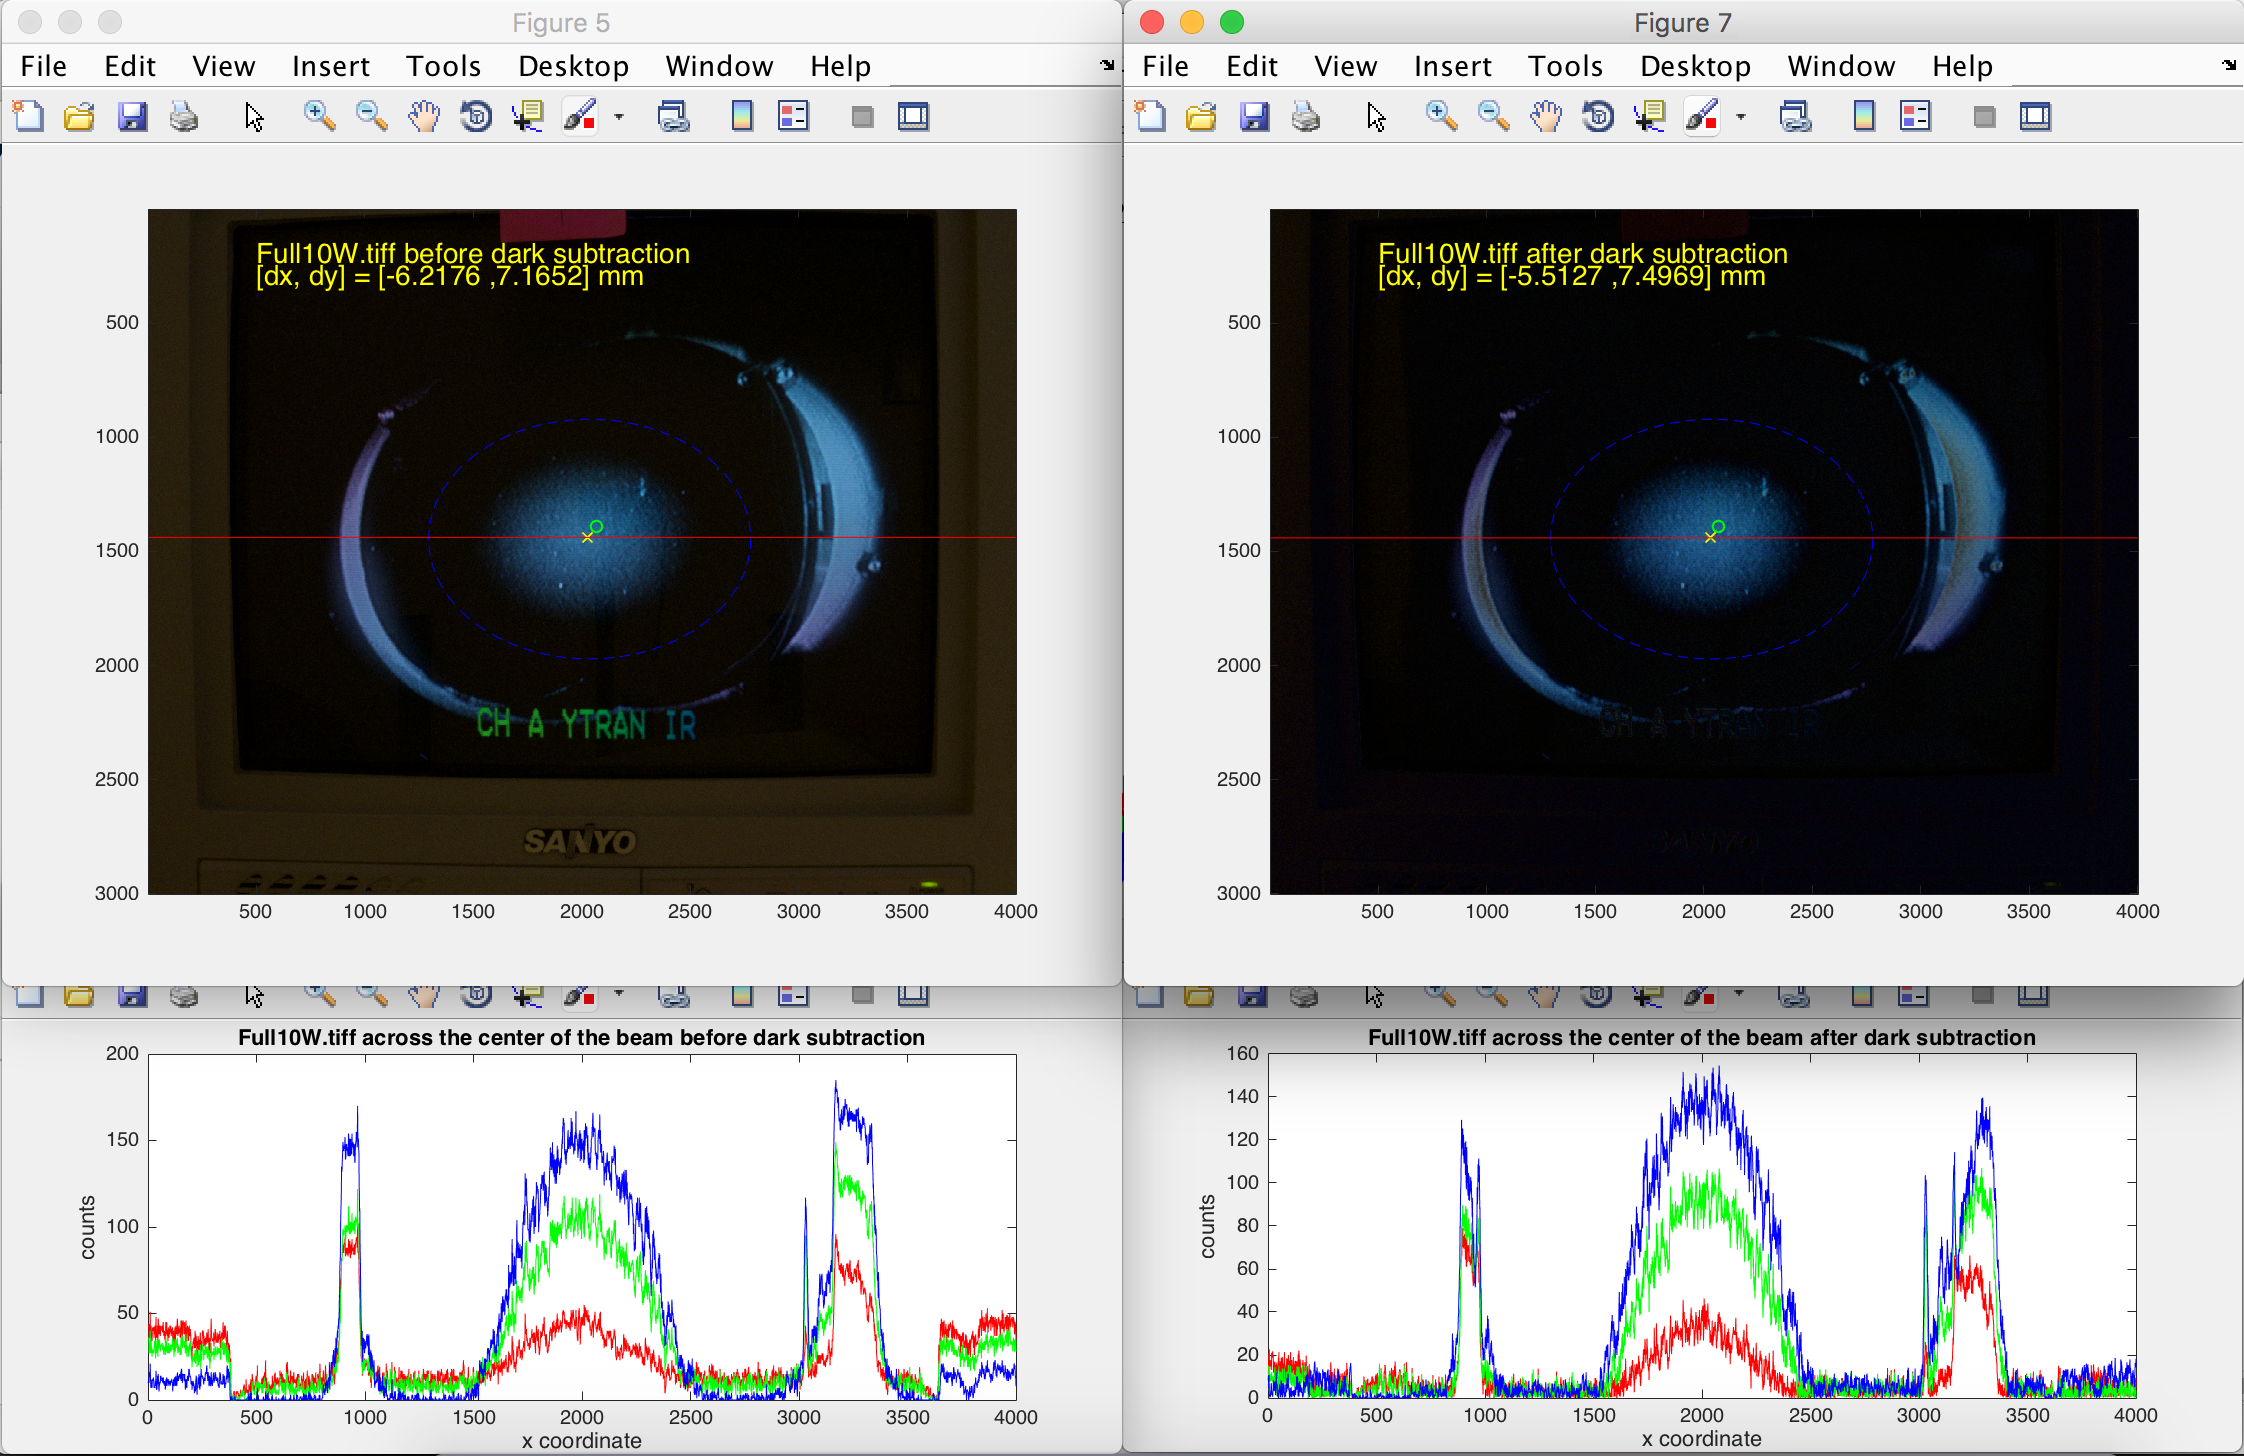
The third attachment shows the 40W image with and without dark image subtraction. I calculate the image COG inside the blue circle to find the center of the beam (yellow cross). The green circle is the center of BSHR.
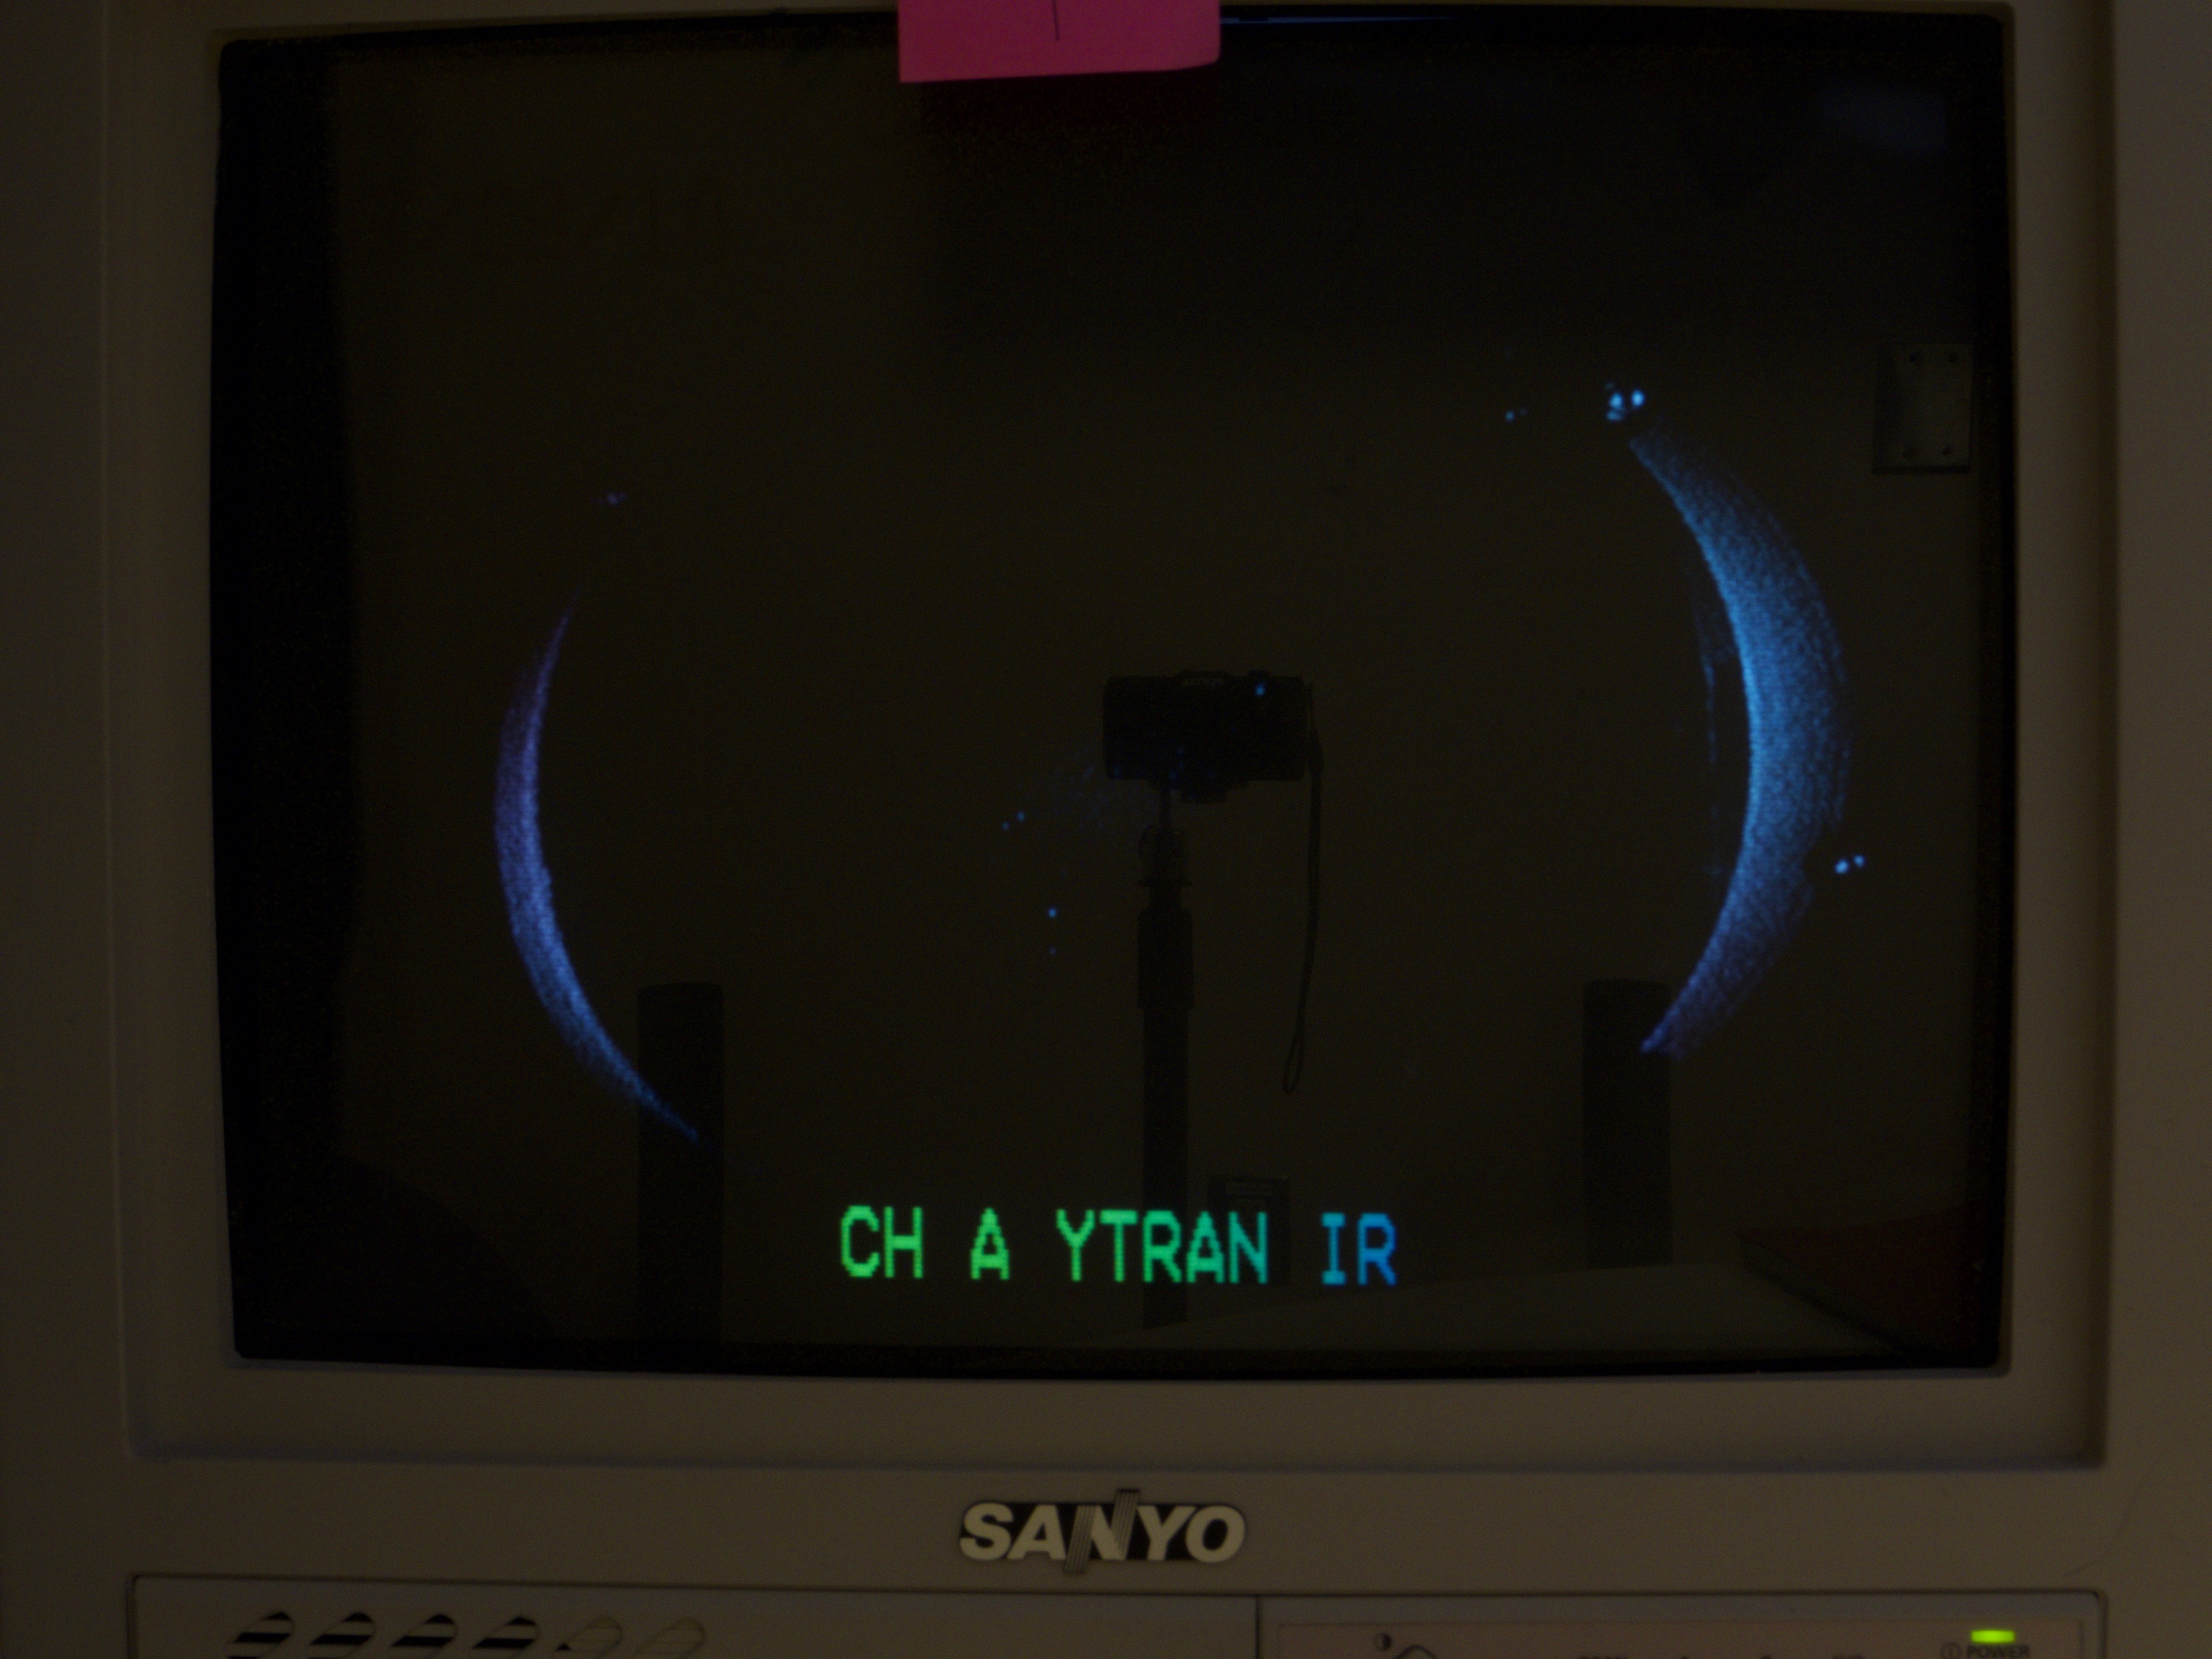
The baffle looks odd after "dark" subtraction because the "dark" image is not dark for baffle scattering. That's because I used DRMI as a "dark" image (4th attachment). No true "dark" image was taken because I didn't want to interrupt locking activities. You can see in the dark image that the scattering from the baffle is already significant but not at the beam on BSHR, and that there's a reflection of the camera and the tripod on the CRT screen. Anyway, this is subtracted from the left of the third attachment to produce the right after taking into account the exposure time difference.
The beam position doesn't change much with or without dark subtraction.
Plots under the pictures show the red, green and blue channels across red horizontal lines in the pictures to see if the video image or the camera image itself was saturating, and it seems the video was, but not really badly.
The 5th and 6th attachments show 10W and 2W, respectively.
At 10W, maybe it's hard to see the benefit of dark image subtraction on the image itself, but if you look at the beam center cross section plot, removing the shadow of the camera and the tripod actually made the beam shape nicer.
At 2W, dark subtraction didn't work well. If you look at the frame of the CRT it's apparent that the dark subtraction failed. If you look at the edge of "SANYO" or the left edge of orange-ish sticky note, it's apparent that the digital camera was off in YAW significantly. But the bright image clearly shows the shadow of the camera and the tripod, and I don't know if the bright image is useful for guessing the beam position either.