andrew.lundgren@LIGO.ORG - posted 01:52, Saturday 09 July 2016 - last comment - 21:03, Sunday 10 July 2016(28299)
Spectrum deteriorating due to glitches
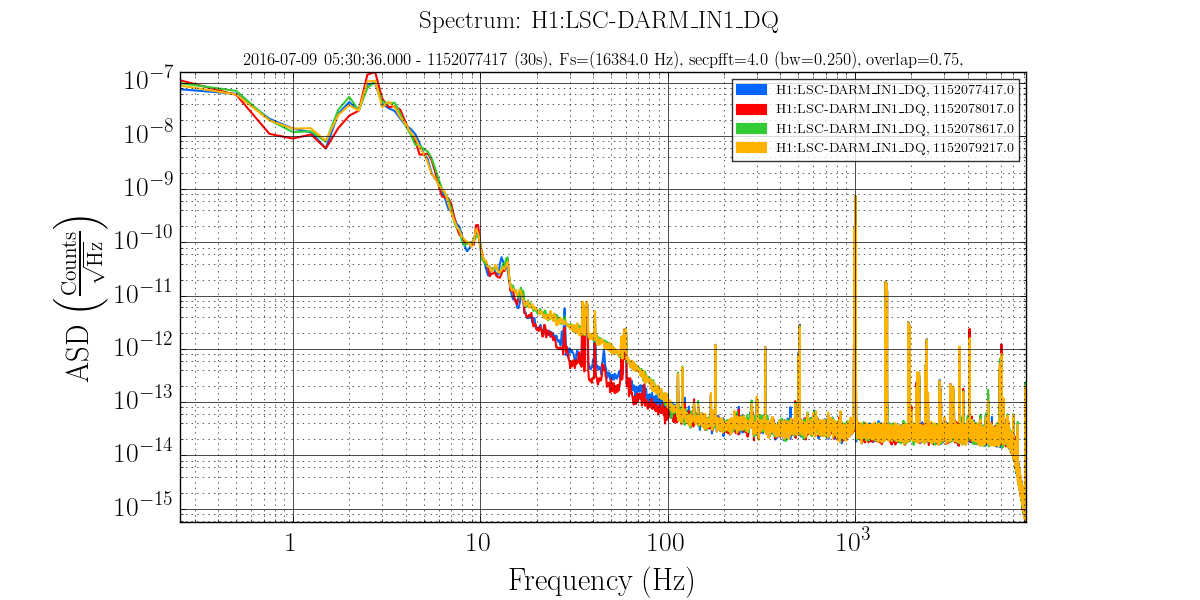
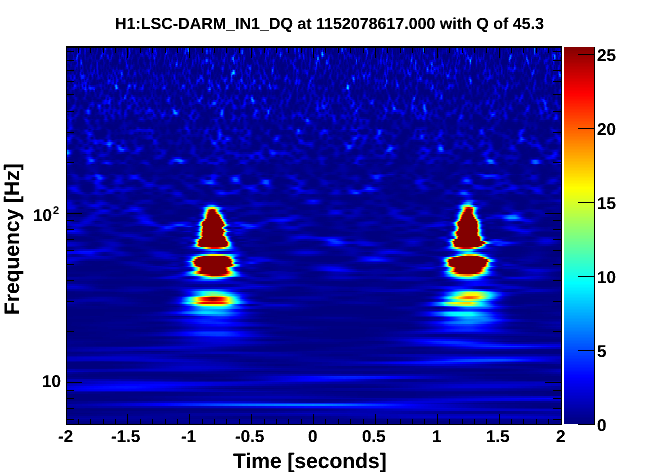
Around 5:45 UTC, DARM started to glitch about every two seconds. The period is not exactly 2 seconds (I think it's just a little bit longer) but it does look pretty regular. I checked that the Pcal spectra look fine, so that's not the problem.

Attached is the change in the DARM spectrum. I wanted to use GDS-CALIB_STRAIN, but I get something that looks like it has dynamic range issues. We need to look into why that's not working. In addition, I'm attaching a Omega scan of the glitches.
Images attached to this report
Comments related to this report
Andy, could you elobrate (probably with some examples) of what dynamic range issues you are having with GDS-CALIB_STRAIN? We have recently switched to double precision numbers to get rid of whitening/dewhitening and also there were a few filter changes. It would be nice to make sure that there are no problems on that side.
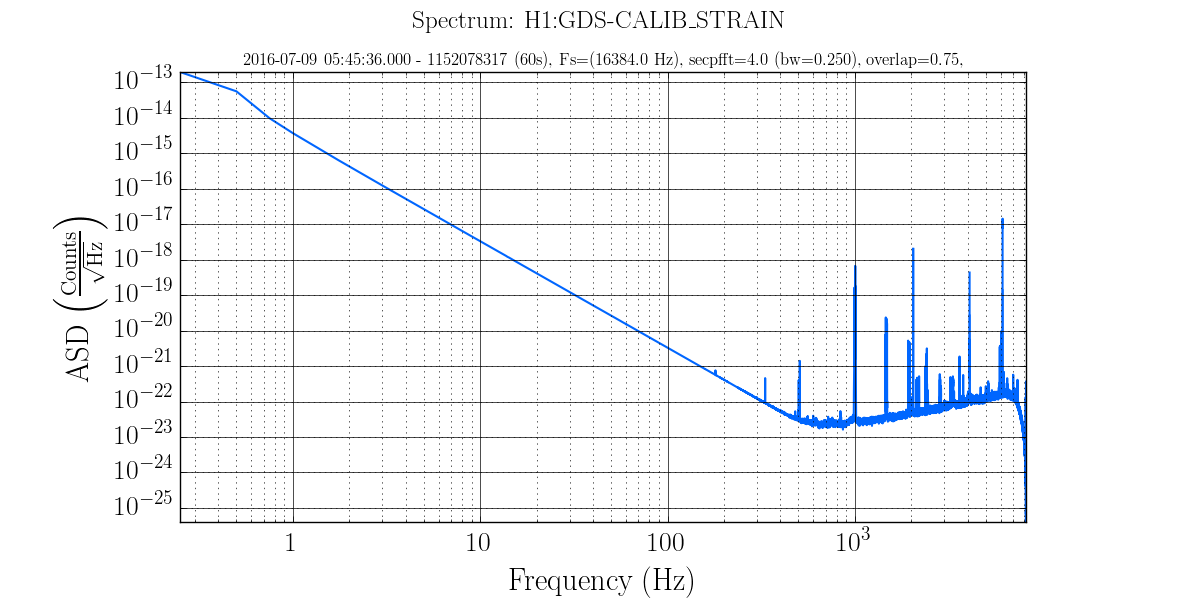
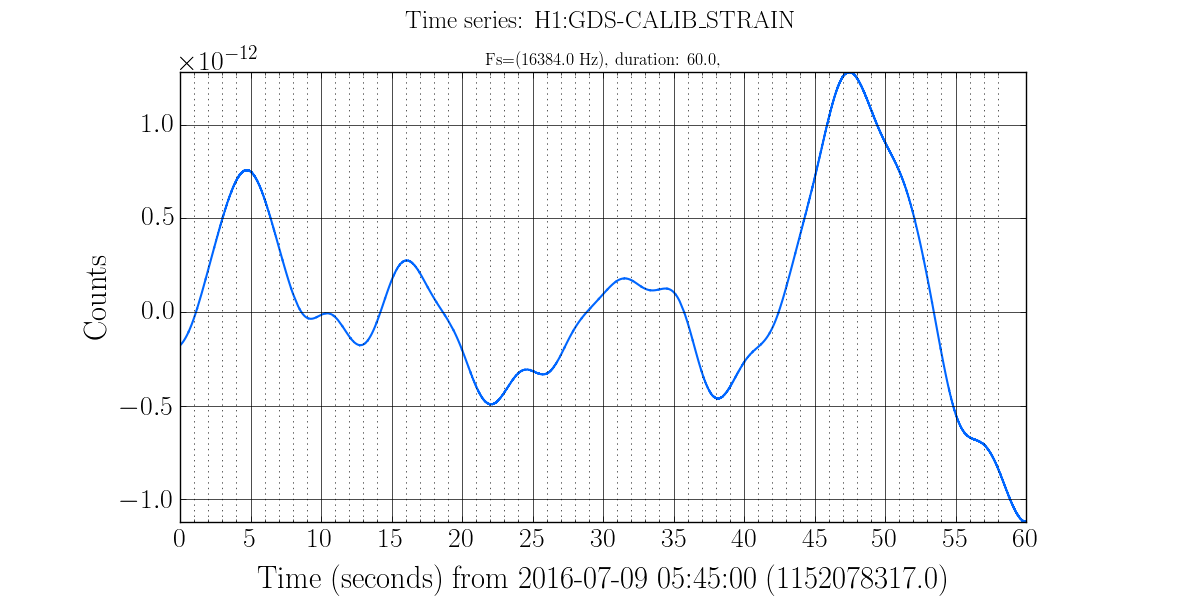
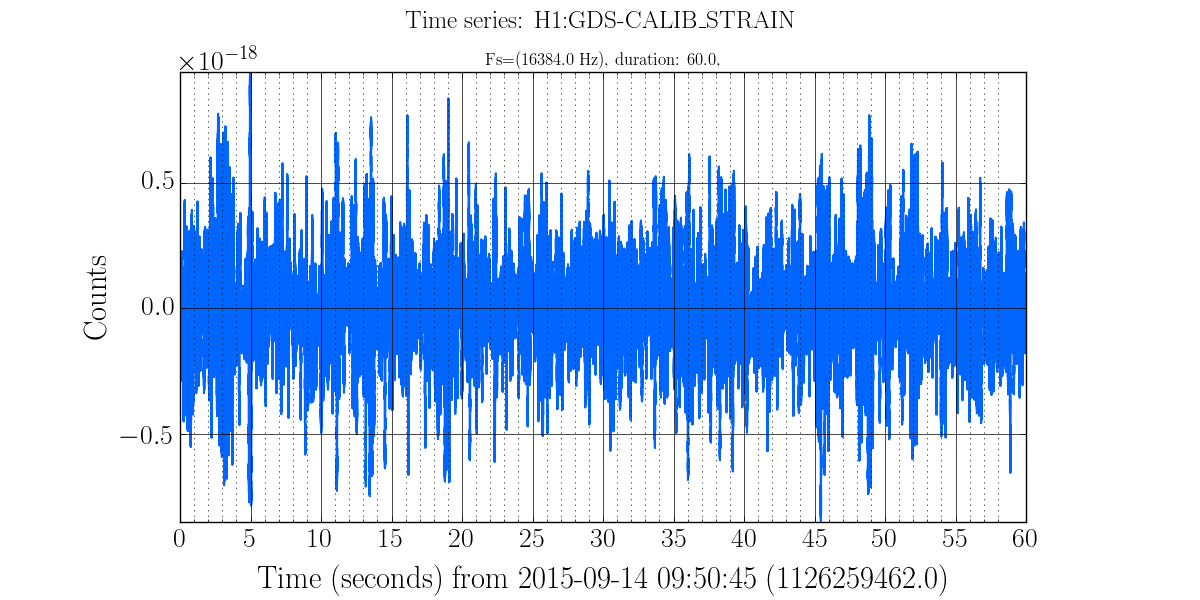
When I take a spectrum of GDS-CALIB_STRAIN, it looks like the first plot. This looks like an issue with spectral leakage from too much low frequency. The time series has a very large low-frequency component around 10^-12 (second plot). It used to be around 10^-18 (third plot), and not so much low frequency.

I'm sure the plot could be fixed by detrending and using the right window, or at worst high passing, but it would be preferable not to have such a big low-frequency component, unless it's useful for something.
Images attached to this comment
I'm still working my way throughout the ER9 run-averaged spectrum
to compile a detailed line / comb list, but one artifact that jumps out
at me is a strong 0.4853-Hz comb I haven't seen before, visible from
its 19th harmonic at about 9.2 Hz to its 316th harmonic at about 153.4 Hz.
This is likely related to the periodic glitches Andy found.

There is also a new near-1-Hz comb (spacing = 0.9968 Hz), visible from
its 21st harmonic at about 20.9 Hz to its 204th harmonic at about 203.3 Hz.
This is a higher harmonic than I've seen before, despite having many fewer
FScan SFTs to work with than in O1 (hence having a fuzzier noise floor to
pick out harmonics from).

Details and plots to come...