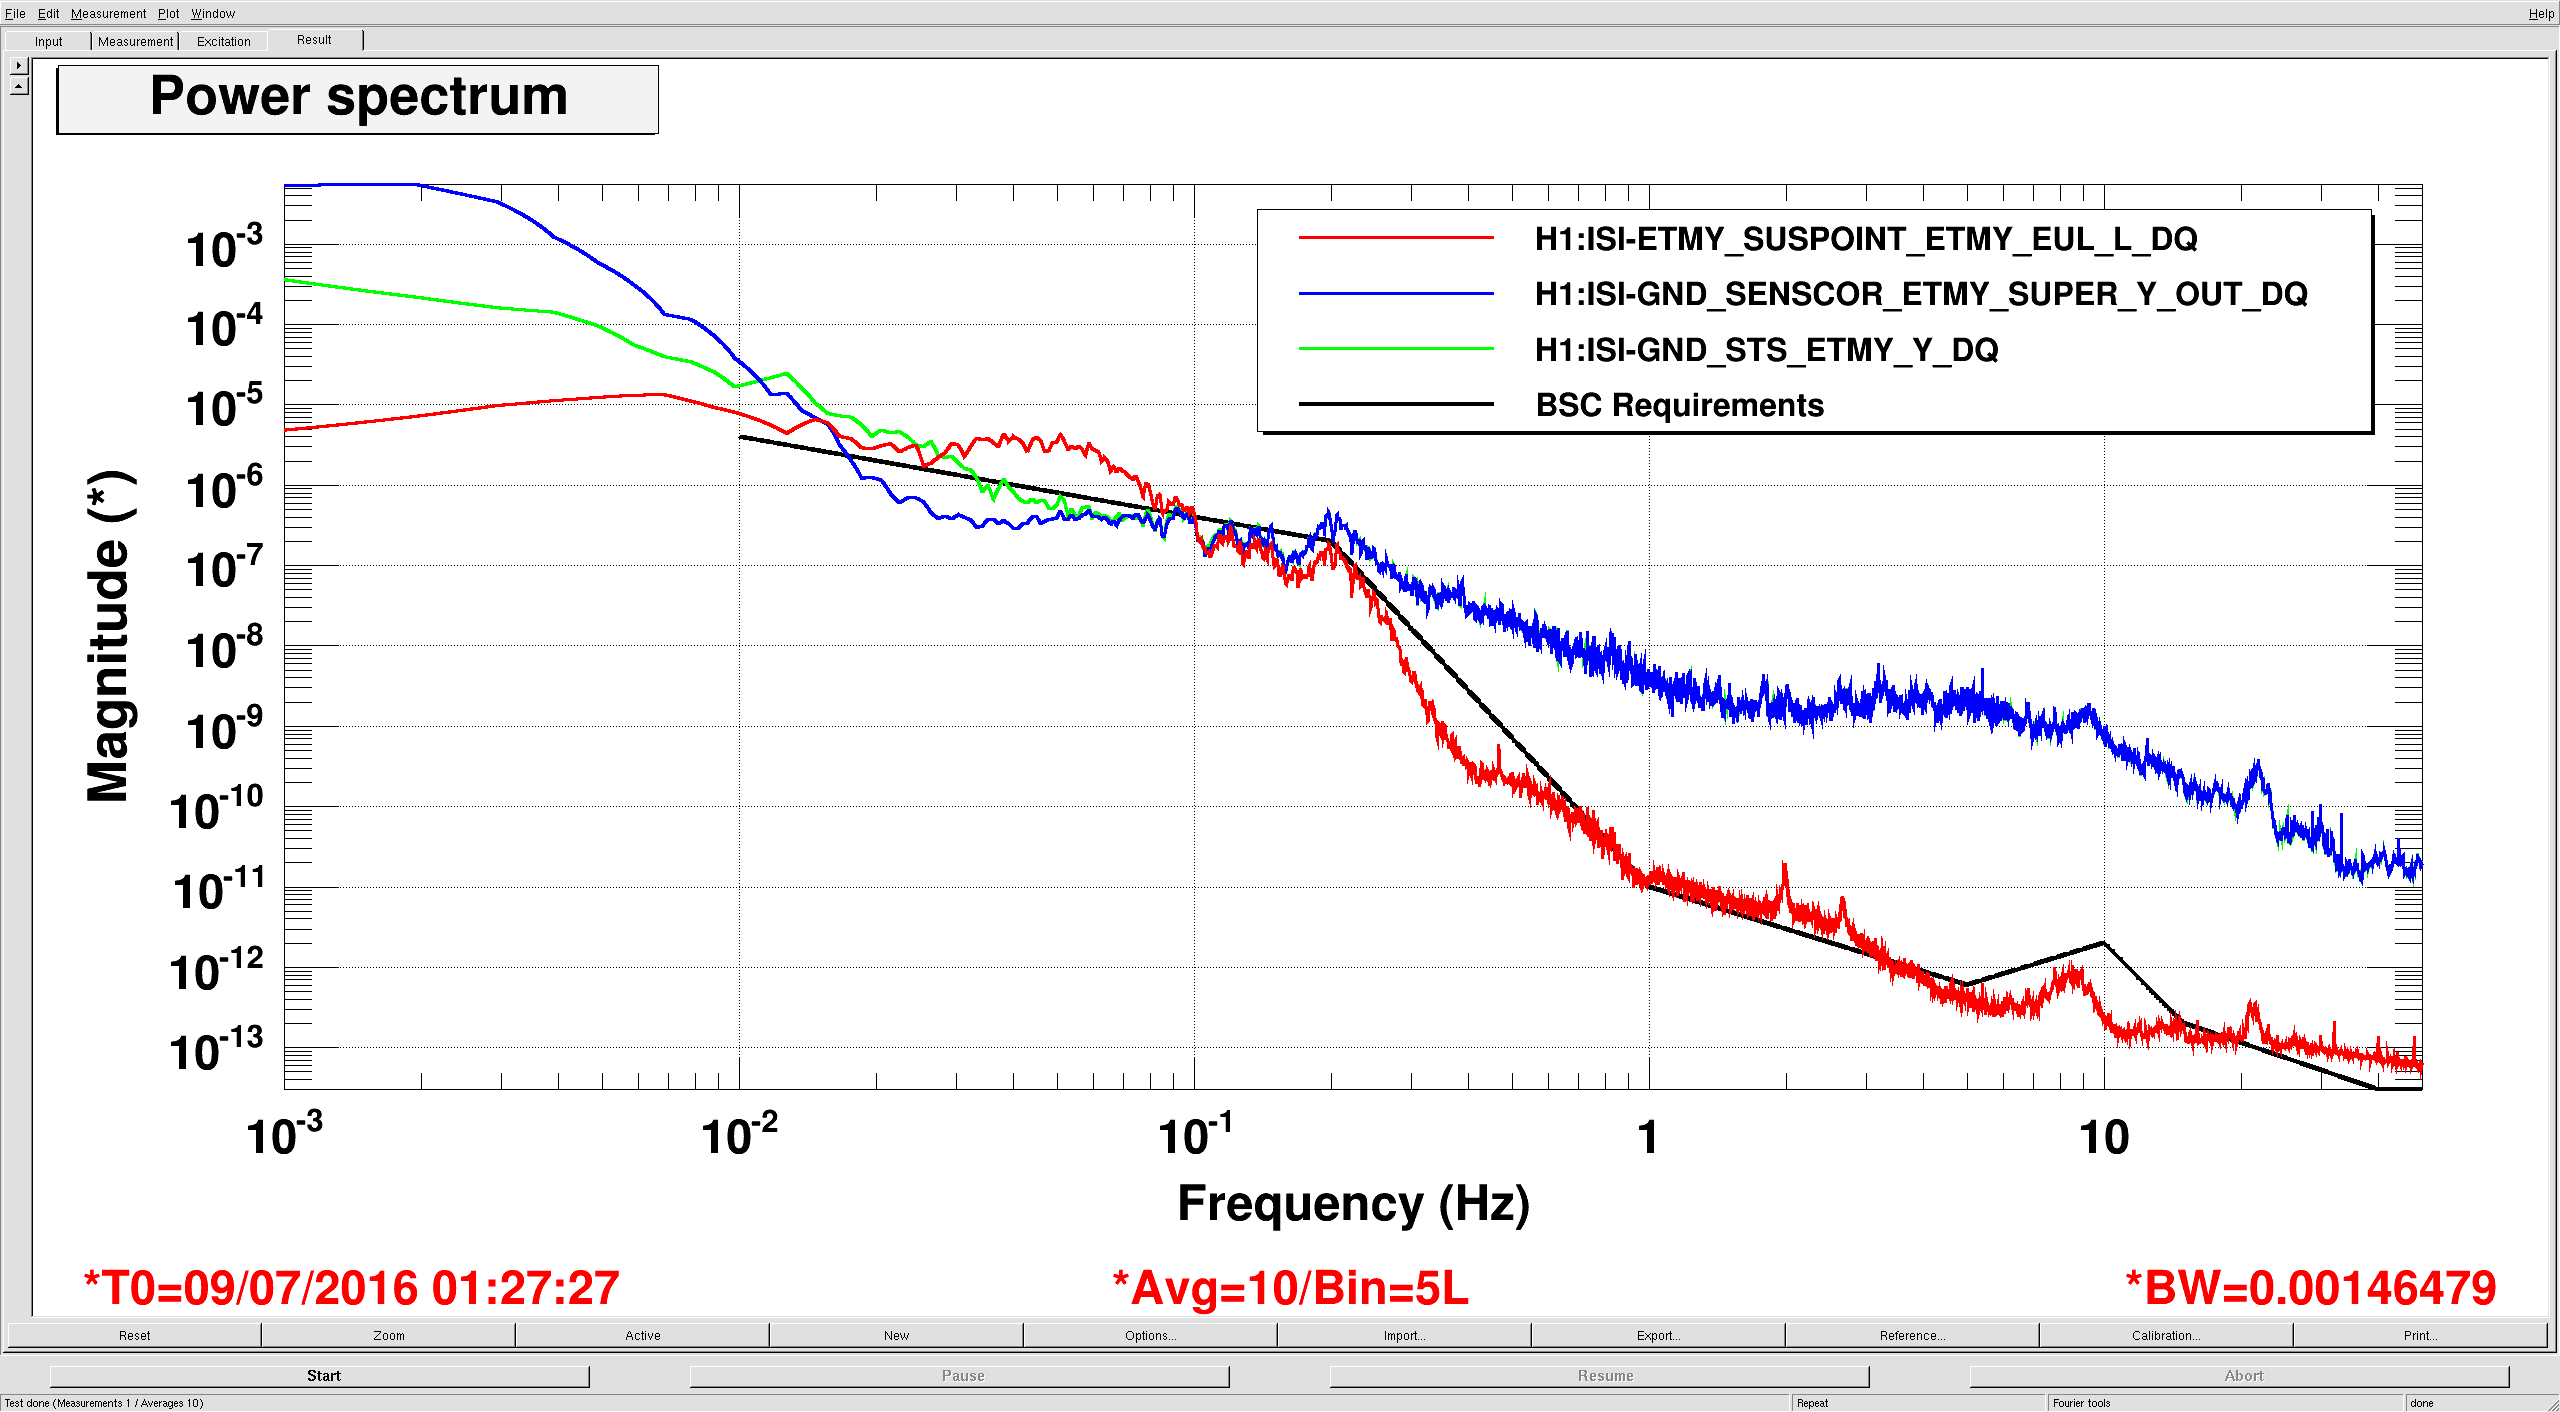
There was a request for a representative example of BSC-ISI performance during ER9. My attached plot shows the ETMY L(ength) suspoint motion of the ST2 GS13s versus the ground motion. The red curve is the ISI's longitudinal motion (using the calibrated SUS_POINT channel), blue is the ETMY BRS/STS Y super sensor (showing the tilt subtracted low frequency ground motion) and green is the calibrated STS Y ground motion. Somethings to note:
1. Below .1hz the height of the green trace above the blue gives you an idea of how windy it was. In this frequency range the L motion is mostly ISI Y, so much of the height of the red trace above blue is due to tilt. The bump between 30 & 100mhz is from the gain peaking of the sensor correction filter. As Conor said on Friday, this should be mostly common mode between all of the tables.
2. Between .1 and 1 hz the blend filters are rolling off from the CPSs to the inertial instruments. It doesn't look like we are getting much at the microseism, but this is probably limited by performance of the sensor correction. We should do "better" here when the microseism comes up, during O2.
3. Above 1 hz the St2 L motion is limited by St2 RX/RY motion, because we can't turn on those loops on St2. GS13 noise is too high below 1 hz so it's hard to make a blend filter that improves >1 hz motion that doesn't spoil lower frequency motion.
4. Above 10hz we are limited by GS13 noise and loop gain.