Executive summary:

* Good news - as expected, the 16-Hz comb due to the OMC length dither is gone (at least at this sensitivity level)
* Bad news - low-frequency 1-Hz combs remain, and some new low-frequency combs & lines have appeared

Some details:
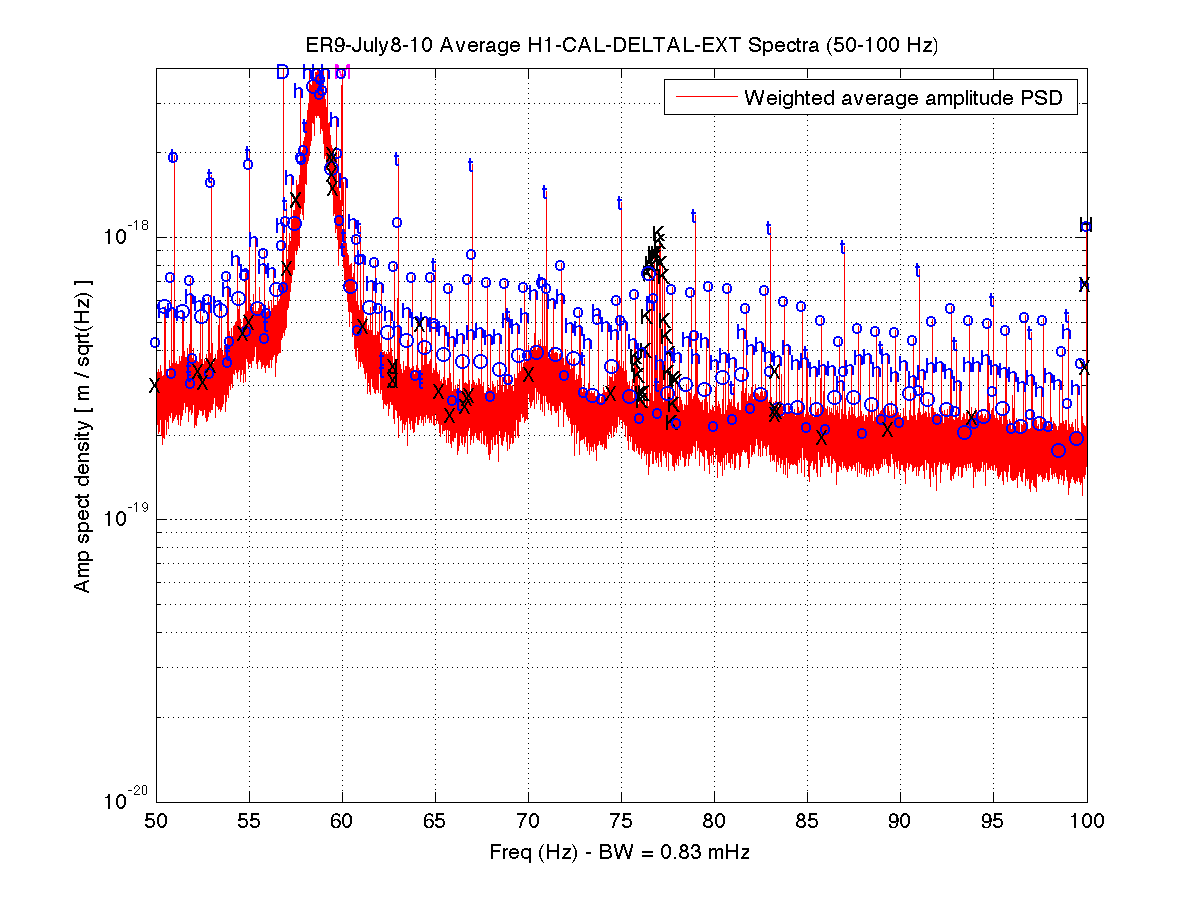
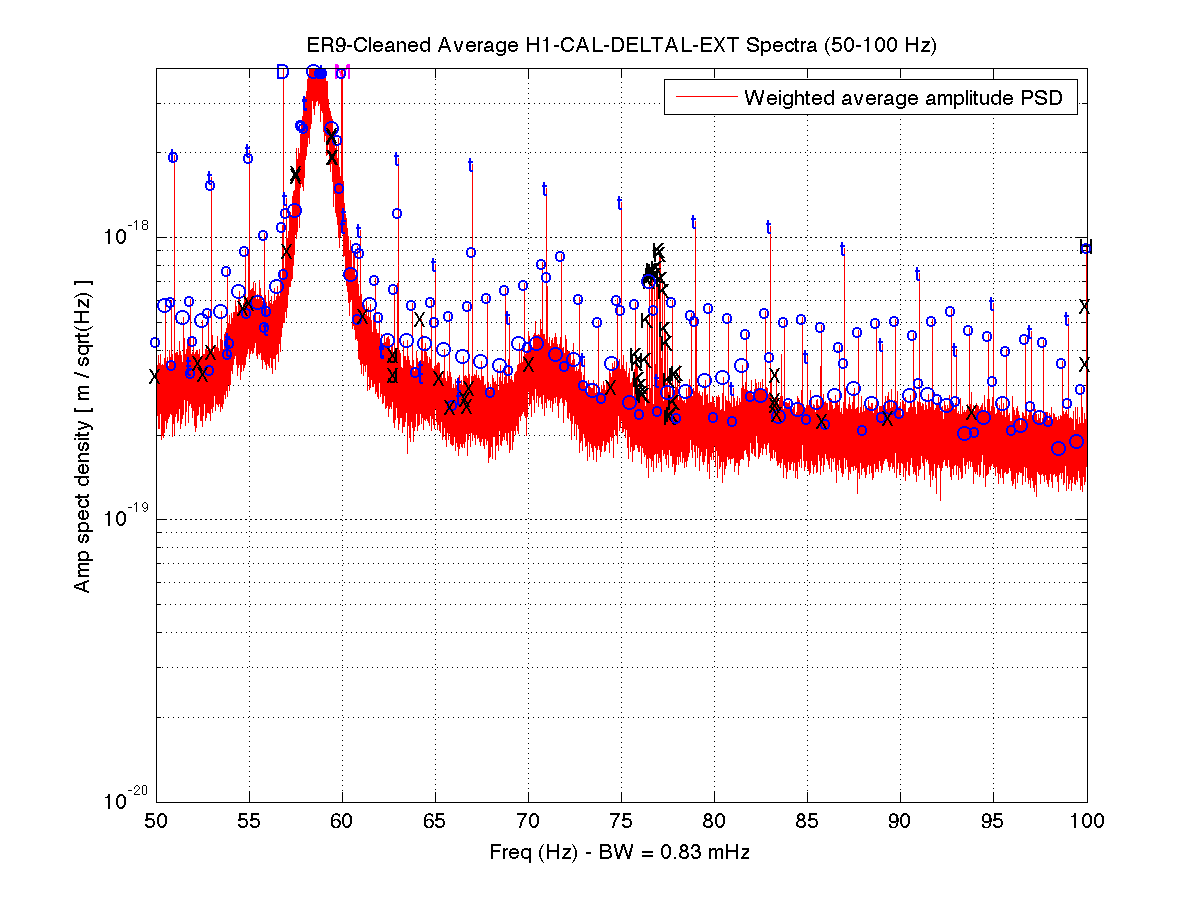
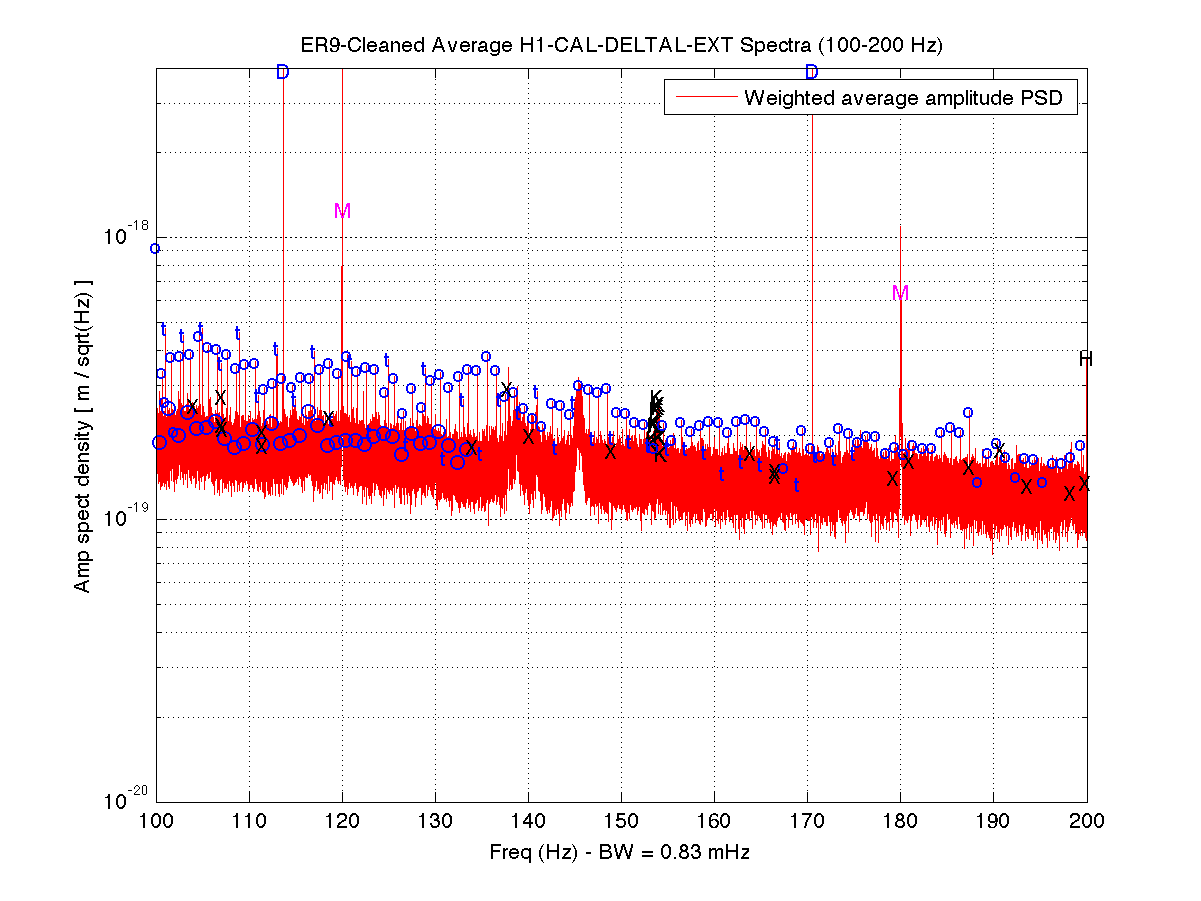
- I initially looked at 15 hours of 30-minute FScan DELTAL_EXTERNAL SFTs (30 SFTs) generated during ER9 and was aghast at how bad the low-frequency spectrum looked, with a pervasive 0.485308-Hz comb ranging up to its 446th harmonic at 216.4 Hz, but when I exclude the three hours of SFTs when the 2-second ALS- glitches were present, things don't look quite so bad (see figure 1 for a sample without removal and figure 4 with removal). I dewhiten according to the new 6-pole / 6-zero, 0.3 / 30 Hz algorithm.
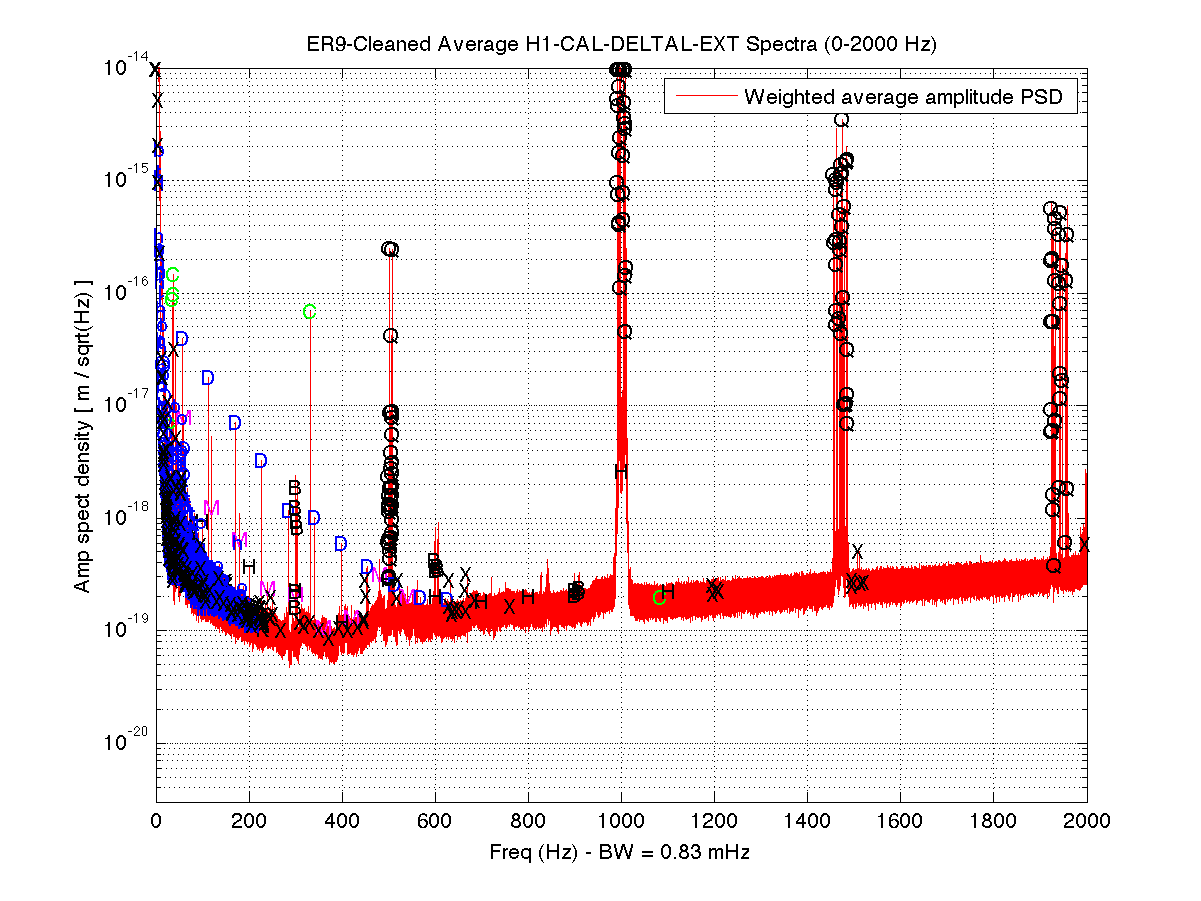
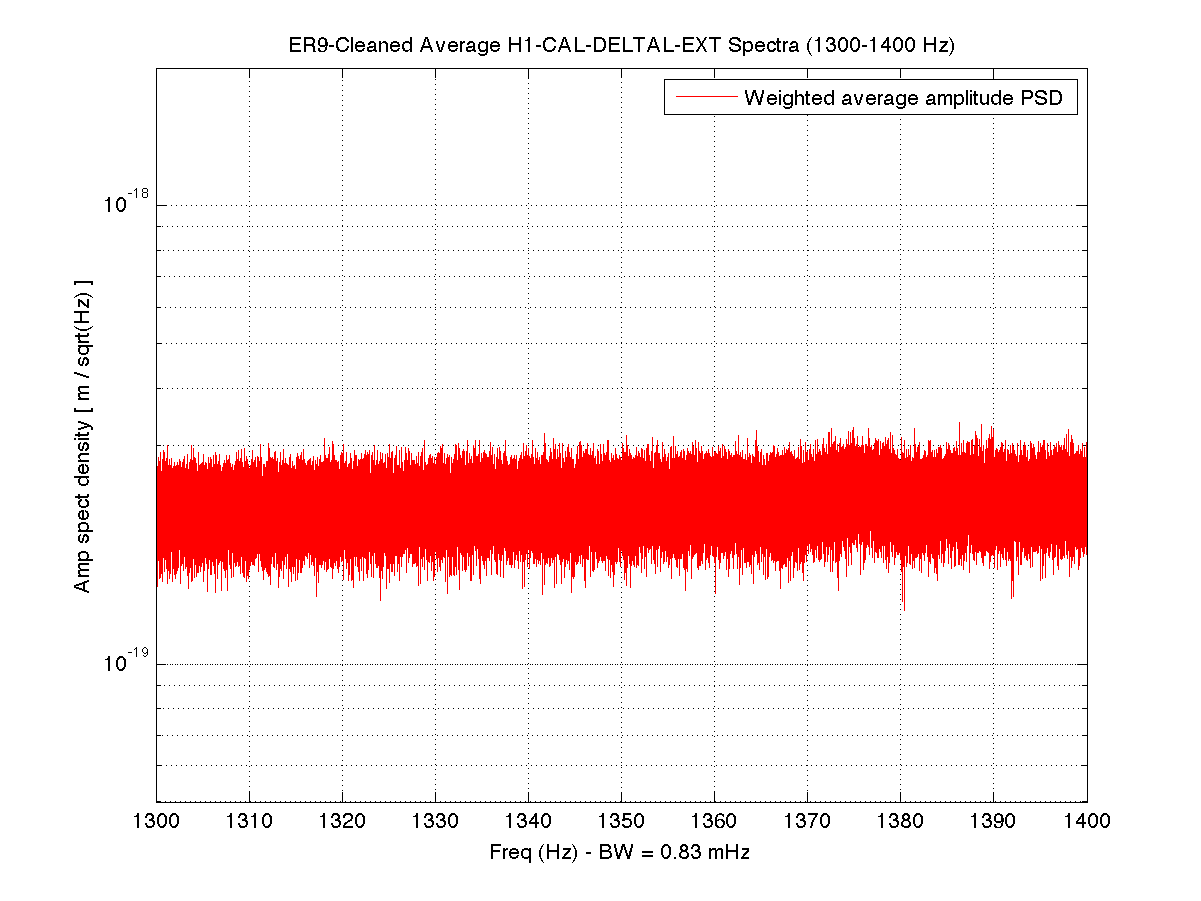
- The infamous 16-Hz comb due to the OMC length dither tracked down and killed here is gone (at least at this sensitivity level and these SFT statistics). As a result the high-frequency band (up to 2 kHz) is remarkably smooth with only violin modes and sporadic isolated artifacts.
- The 1-Hz comb with 0.5-Hz offset remains pervasive, but other prior 1-Hz or near-1-Hz combs with different offsets (e.g., 0.25 Hz) are not strong.
- On the other hand, there is a new near-1-Hz comb (0.996798-Hz spacing) visible to its 204th harmonic at ~203.3 Hz.
- There is also a new near-2-Hz comb (1.999951-Hz spacing) visible on approximate odd-integer-Hz frequencies, starting from ~9 Hz and visible up to ~175 Hz. This is likely the same 2-Hz comb reported in May by Bryn Pearlstone (which Ansel Neunzert kindly reminded me about today).
- There is a "new" 56.8406-Hz comb visible to its 11th harmonic at ~625.25 Hz, which in hindsight I can see was buried in the O1 spectrum (I overlooked the pattern and indicated the teeth as isolated lines). This time the pattern was strong enough to jump out at me and to jog my memory that this comb was seen in H2 1-arm data in 2012 in both the arm feedback channel and a quiet sensor-noise-dominated OSEM channel. This seemed to indicate a DAQ system problem at the time. I can see from O1 NoEMi line lists that this comb is pervasive in ISI, SUS and PEM channels at the corner station and both end stations.
- The old "K" comb-on-comb (0.088425-Hz fine comb attached to teeth of a coarse 76.3235-Hz comb) has more 11 more fine teeth visible on the lowest-frequency coarse-tooth comb.
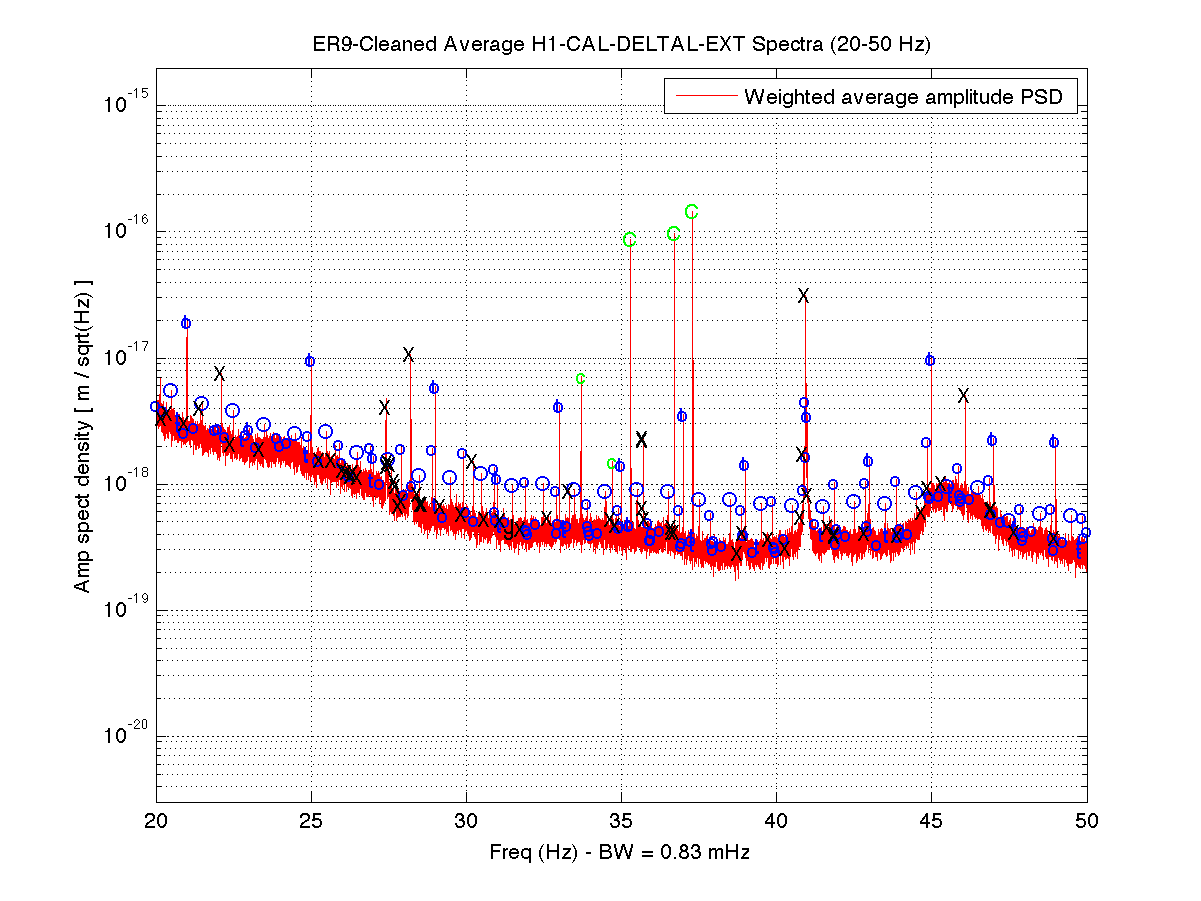
- The old calibration line at 35.9 Hz has been moved to 35.3 Hz. The new excitation lines at 33.7 and 34.7 Hz are easily visible, but not as strong as the primary calibration lines. I found these changes documented here.
- There are sporadic new isolated lines here and there (indicated in line list - see below)
- There is a "crab-killer" broad bump centered at about 58.6 Hz which degrades sensitivity in the Crab Pulsar band of interest (~59.3 Hz). On the other hand, the whole noise floor is elevated w.r.t. O1, anyway. So it may be premature to worry about the bump.


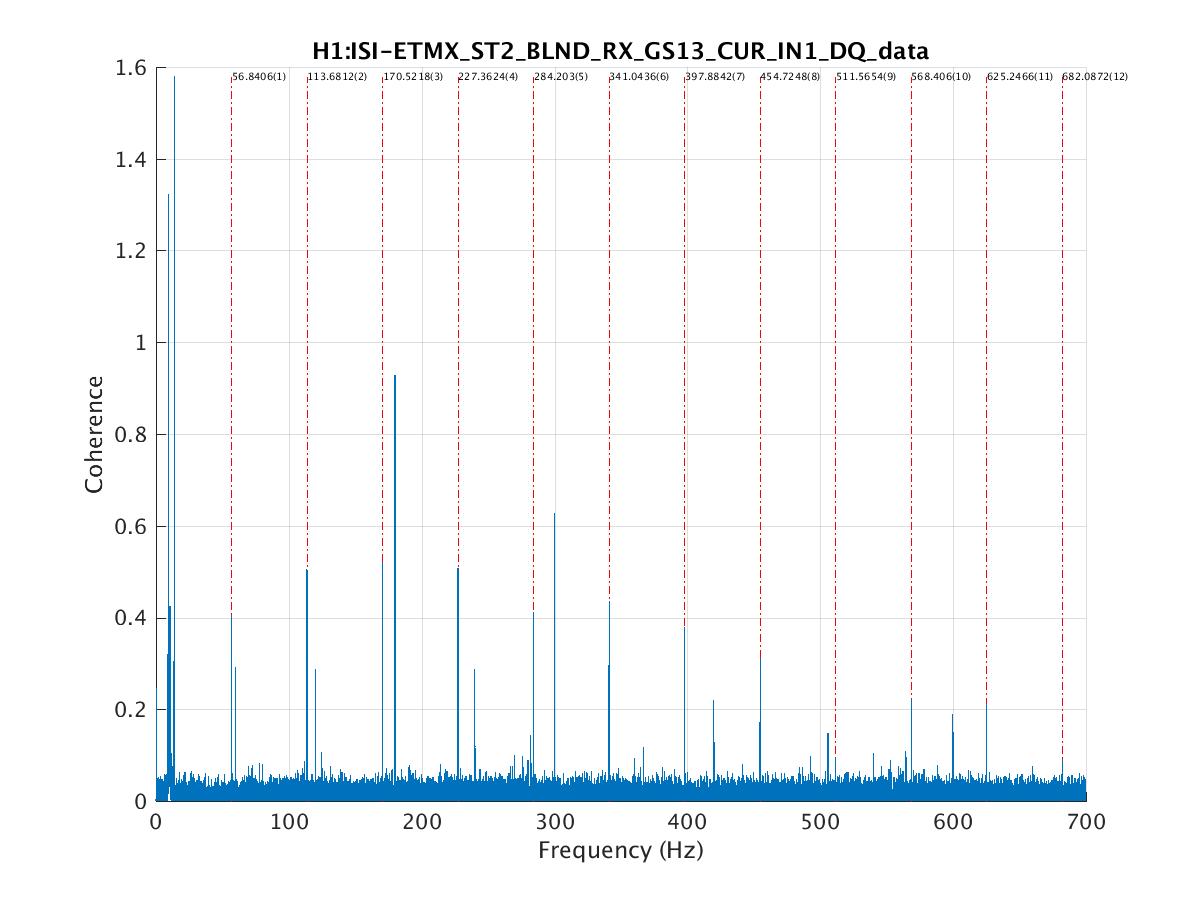
I analyzed the 56.8406Hz comb with coherence tool and here are the results. The same structure is found to be significant in 35 channels in ER9, distributed in ISI, SUS, PEM and LSC subsystems. Among all the 35 channels, 22 of them does not have a range up to its 11th harmonic, 625.25 Hz.
Keith indicated in his slog entry that a DAQ malfunction is suspected to be the ultimate source of this, and these findings suggest it's in an EX electronics crate.
Here are a few interesting observations:
-
The 9th harmonic at 511.56Hz is the weakest in most channels, sometimes buried in noises.
-
In some PEM channels, there are missing lines at low frequency (< 200 Hz) and high frequency (> 500 Hz).
-
In PEM and ISI channels, there seems to be another comb structure with a frequency slightly larger than 56.8406Hz coexists. That one is usually most significant at its third harmonics.
-
Generally, the structure is more clearly seen in LSC, SUS and ISI channels
Sample plots from each subsystem:
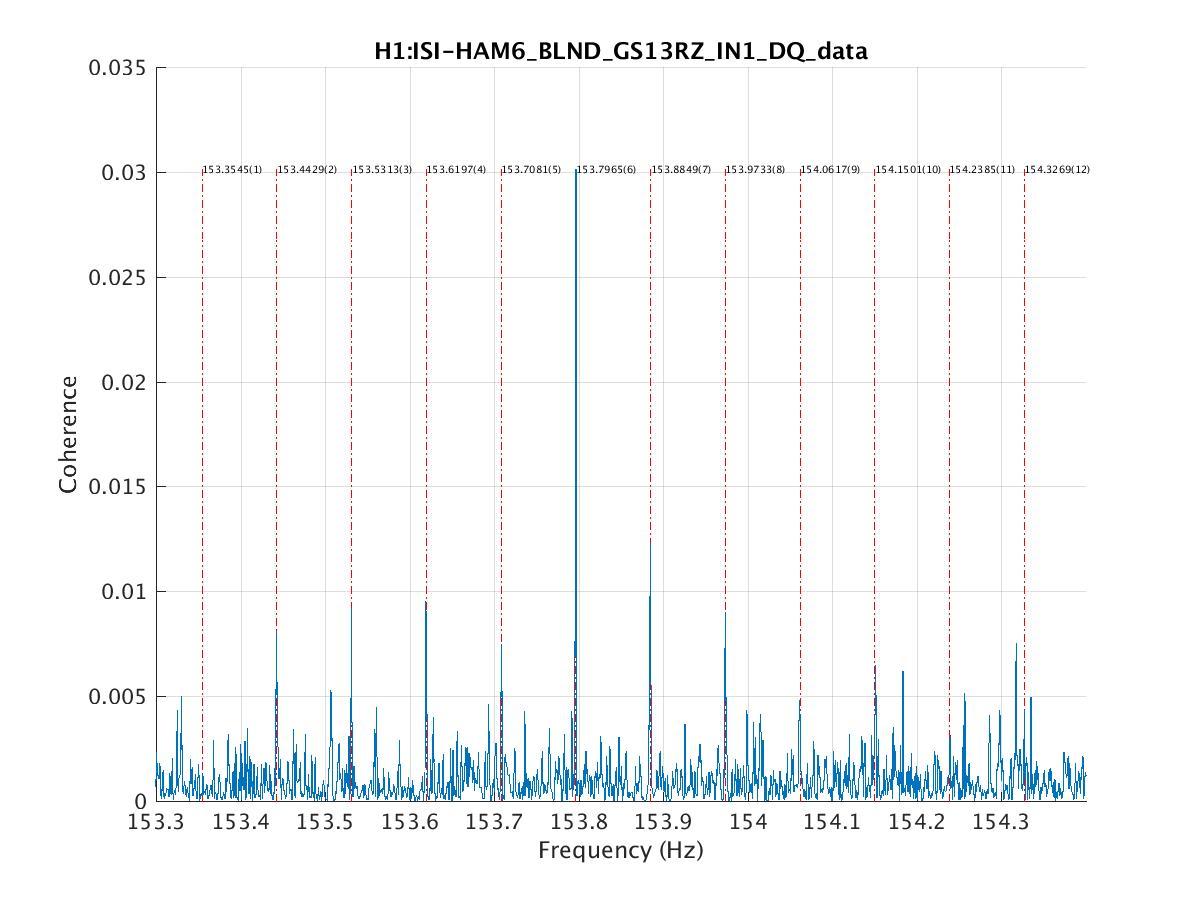
Figure 1: We can see the 56.8406Hz comb structure exists with its 9th harmonic weakest in ISI.
Figure 2: PEM channels have more noises and, as in ISI channels, the other comb structure coexists.
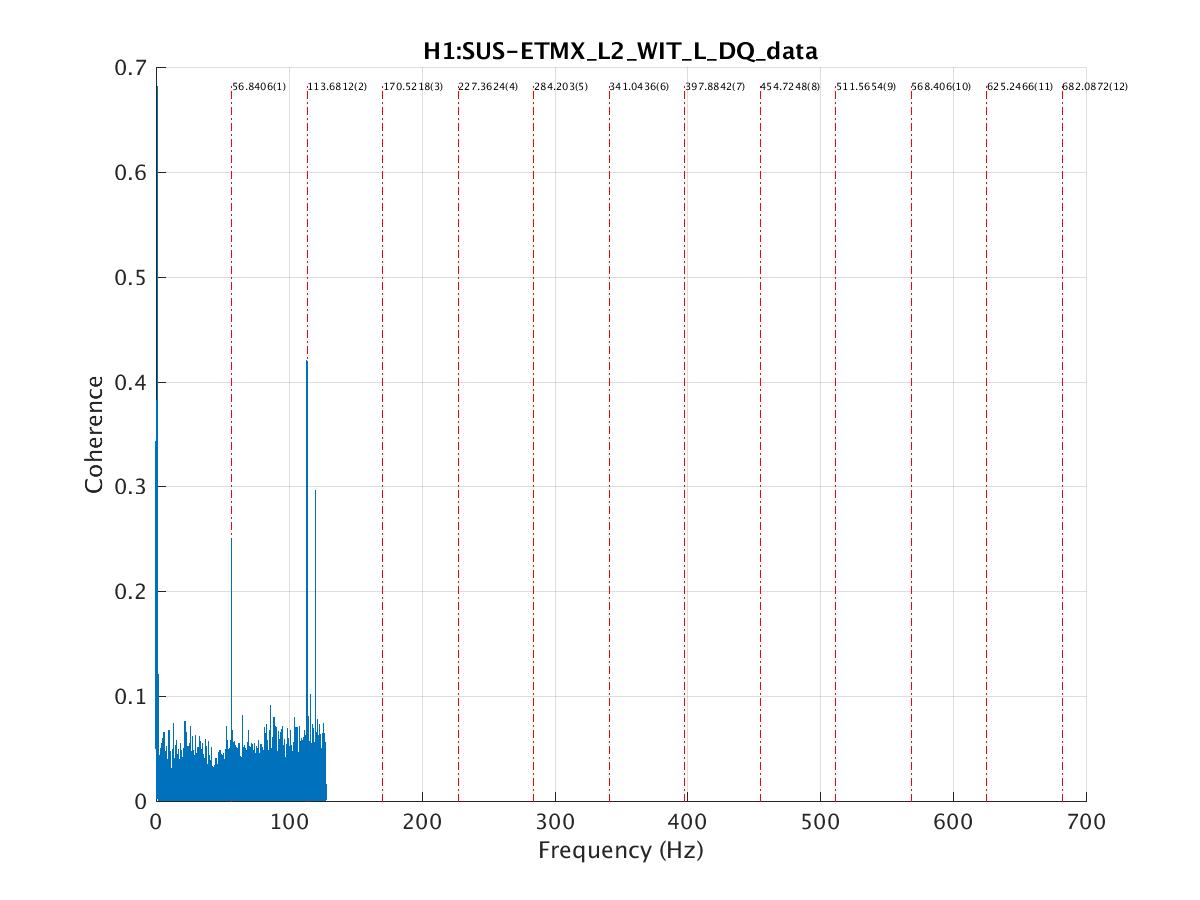
Figure 3: SUS channels do not have enough range up its 11th harmonic but we can see its first and second harmonic here.
Figure 4: There is only one channel from LSC but the structure is very clear.
All plots and a list of channels are attached in the zip file.
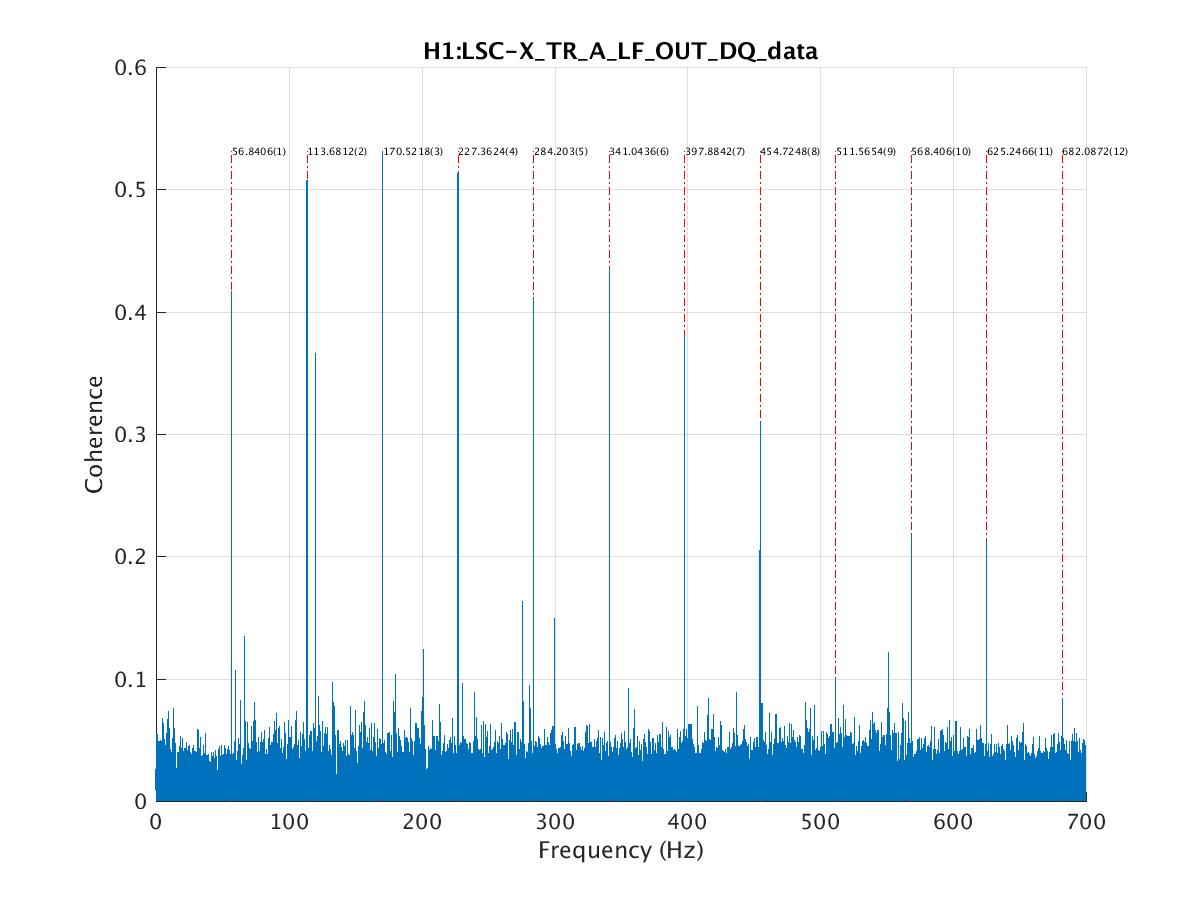
Just to be clear. Here are the channels that the coherence tool is finding the comb. This is what is supporting Keith's assumption that the problems could be in an EX electronics crate.

Channels List:
H1:ISI-ETMX_ST2_BLND_RX_GS13_CUR_IN1_DQ_data
H1:ISI-ETMX_ST2_BLND_RY_GS13_CUR_IN1_DQ_data
H1:ISI-ETMX_ST2_BLND_RZ_GS13_CUR_IN1_DQ_data
H1:ISI-ETMX_ST2_BLND_X_GS13_CUR_IN1_DQ_data
H1:ISI-ETMX_ST2_BLND_Y_GS13_CUR_IN1_DQ_data
H1:ISI-ETMX_ST2_BLND_Z_GS13_CUR_IN1_DQ_data
H1:LSC-X_TR_A_LF_OUT_DQ_data
H1:PEM-EX_ACC_BSC9_ETMX_Y_DQ_data
H1:PEM-EX_ACC_BSC9_ETMX_Z_DQ_data
H1:PEM-EX_ACC_ISCTEX_TRANS_X_DQ_data
H1:PEM-EX_ACC_VEA_FLOOR_Z_DQ_data
H1:PEM-EX_MIC_VEA_MINUSX_DQ_data
H1:PEM-EX_MIC_VEA_PLUSX_DQ_data

H1:ISI-ETMX_ST1_BLND_Y_T240_CUR_IN1_DQ_data
H1:ISI-ETMX_ST1_BLND_Z_T240_CUR_IN1_DQ_data
H1:ISI-GND_STS_ETMX_X_DQ_data
H1:ISI-GND_STS_ETMX_Y_DQ_data
H1:PEM-EX_MAINSMON_EBAY_1_DQ_data
H1:PEM-EX_MAINSMON_EBAY_2_DQ_data
H1:PEM-EX_MAINSMON_EBAY_3_DQ_data
H1:PEM-EX_SEIS_VEA_FLOOR_X_DQ_data
H1:PEM-EX_SEIS_VEA_FLOOR_Y_DQ_data
H1:SUS-ETMX_L1_WIT_Y_DQ_data
H1:SUS-ETMX_L2_WIT_L_DQ_data
H1:SUS-ETMX_L2_WIT_P_DQ_data
H1:SUS-ETMX_L2_WIT_Y_DQ_data
H1:SUS-ETMX_M0_DAMP_L_IN1_DQ_data
H1:SUS-ETMX_M0_DAMP_P_IN1_DQ_data
H1:SUS-ETMX_M0_DAMP_T_IN1_DQ_data
H1:SUS-ETMX_M0_DAMP_V_IN1_DQ_data
H1:SUS-ETMX_M0_DAMP_Y_IN1_DQ_data
I chased Comb 23 (type K) in Keith’s post, shown in Keith's original post as
This comb has an offset of 153.3545 Hz and a fundamental frequency of 0.0884Hz. It starts at 153.3545 Hz and goes up to its 11th harmonic, 154.3272 Hz. As is listed in Keith's txt file:
Comb 23 (type K, offset=153.354500):
Frequency (offset + harmonic x fund freq) Ampl (m/rtHz)  Bar (logarithmic)
K  153.3545 (   0  X    0.0884) 1.844961e-19   ****
K  153.4429 (   1  X    0.0884) 1.949756e-19   ****
K  153.5314 (   2  X    0.0884) 2.165192e-19   *****
K  153.6198 (   3  X    0.0884) 2.181833e-19   *****
K  153.7082 (   4  X    0.0884) 2.457840e-19   *****
K  153.7966 (   5  X    0.0884) 2.243089e-19   *****
K  153.8851 (   6  X    0.0884) 2.709562e-19   *****
K  153.9735 (   7  X    0.0884) 2.499596e-19   *****
K  154.0619 (   8  X    0.0884) 2.562208e-19   *****
K  154.1503 (   9  X    0.0884) 1.945817e-19   ****
K  154.2388 (  10  X    0.0884) 1.951777e-19   ****
K  154.3272 (  11  X    0.0884) 1.703353e-19   ****
I found the comb structure in two channels of ISI subsystem.
Figure 1 shows the plot of channel H1:ISI-HAM6_BLND_GS13RZ_IN1_DQ. Descriptions of this channel can be found here:
https://cis.ligo.org/channel/314371
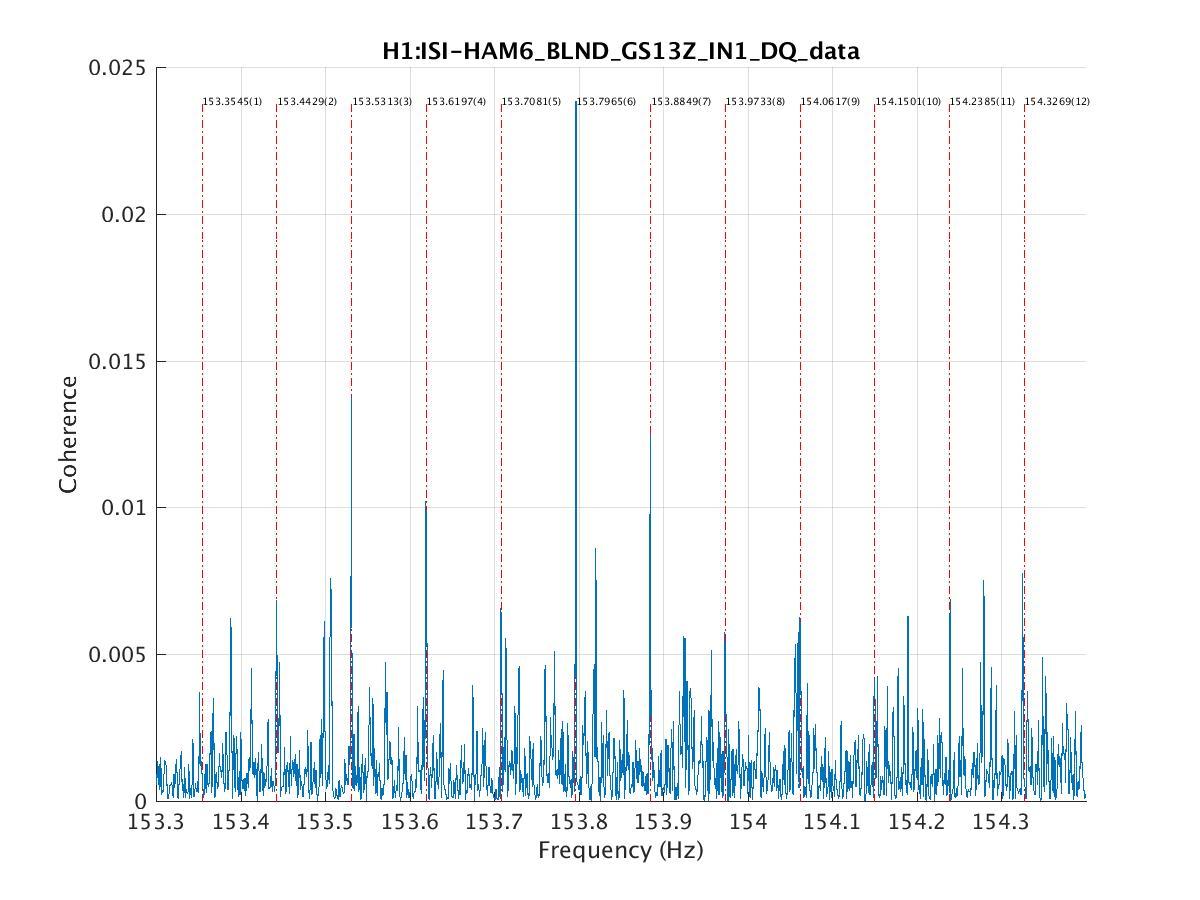
Figure 2 shows the plot of channel H1:ISI-HAM6_BLND_GS13Z_IN1_DQ. Descriptions of this channel can be found here:
https://cis.ligo.org/channel/314374
In the plots of both channels, we can see a comb structure stands out at the positions of harmonics. We are wondering about the reason for this:
Why these seismic isolation channels?
This post is supplementary to the first post about coherence analysis result for the 56.8406Hz Comb at
https://alog.ligo-wa.caltech.edu/aLOG/index.php?callRep=28619
The first post is addressing the 56.8406Hz comb found in Keith's original post (marked as D comb):
https://alog.ligo-wa.caltech.edu/aLOG/index.php?callRep=28364
Information about this comb from the txt file in Keith's post:
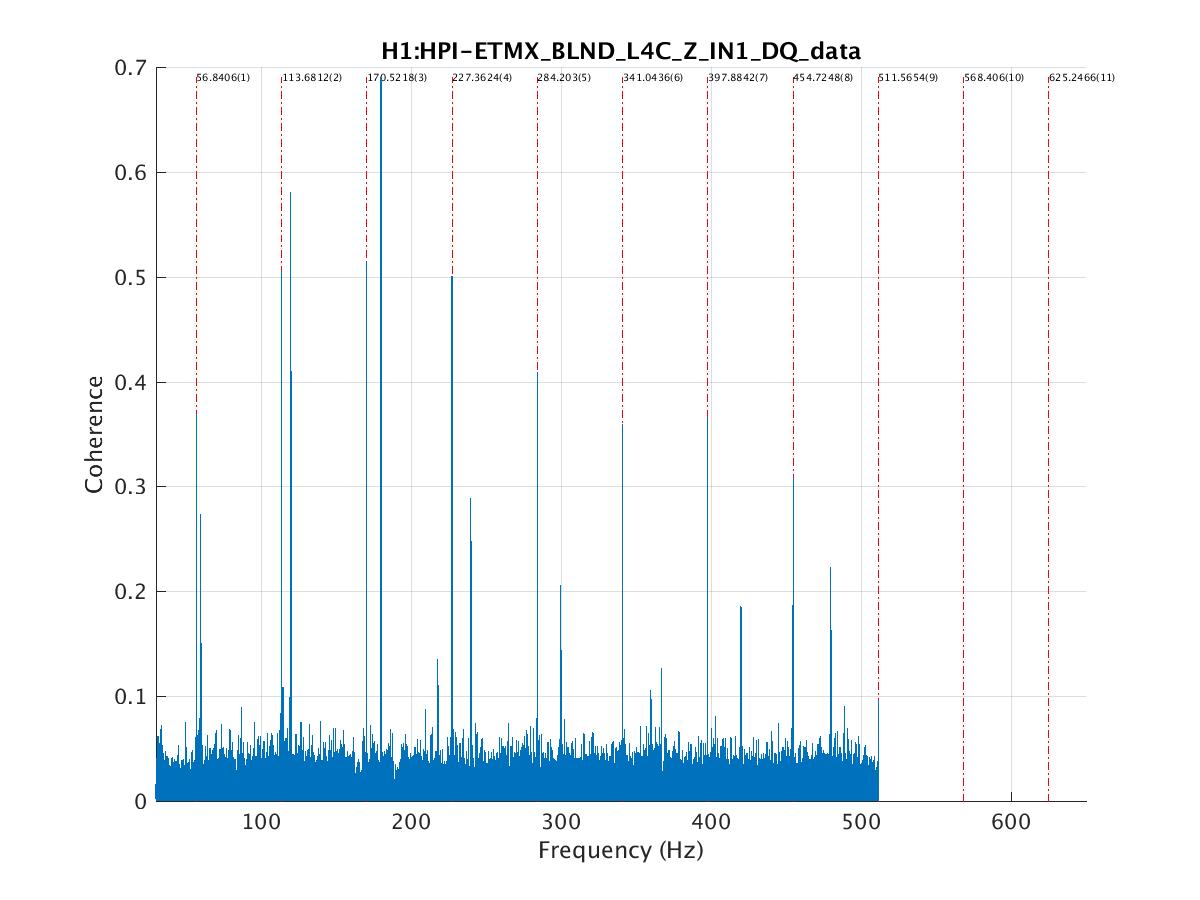
Comb 35 (type D, offset=0.000000):
  Frequency (offset + harmonic x fund freq) Ampl (m/rtHz)  Bar (logarithmic)
D   56.8406 (   1  X   56.8406) 3.968800e-17   ***********
D  113.6811 (   2  X   56.8406) 1.773964e-17   **********
D  170.5217 (   3  X   56.8406) 7.121580e-18   *********
D  227.3622 (   4  X   56.8406) 3.232935e-18   ********
D  284.2028 (   5  X   56.8406) 1.166094e-18   *******
D  341.0433 (   6  X   56.8406) 1.007273e-18   *******
D  397.8839 (   7  X   56.8406) 5.962059e-19   ******
D  454.7245 (   8  X   56.8406) 3.752194e-19   *****
D  511.5650 (   9  X   56.8406) 2.577108e-19   *****
D  568.4056 (  10  X   56.8406) 1.964393e-19   ****
D  625.2461 (  11  X   56.8406) 1.891774e-19   ****
--------------------------------------------------------------
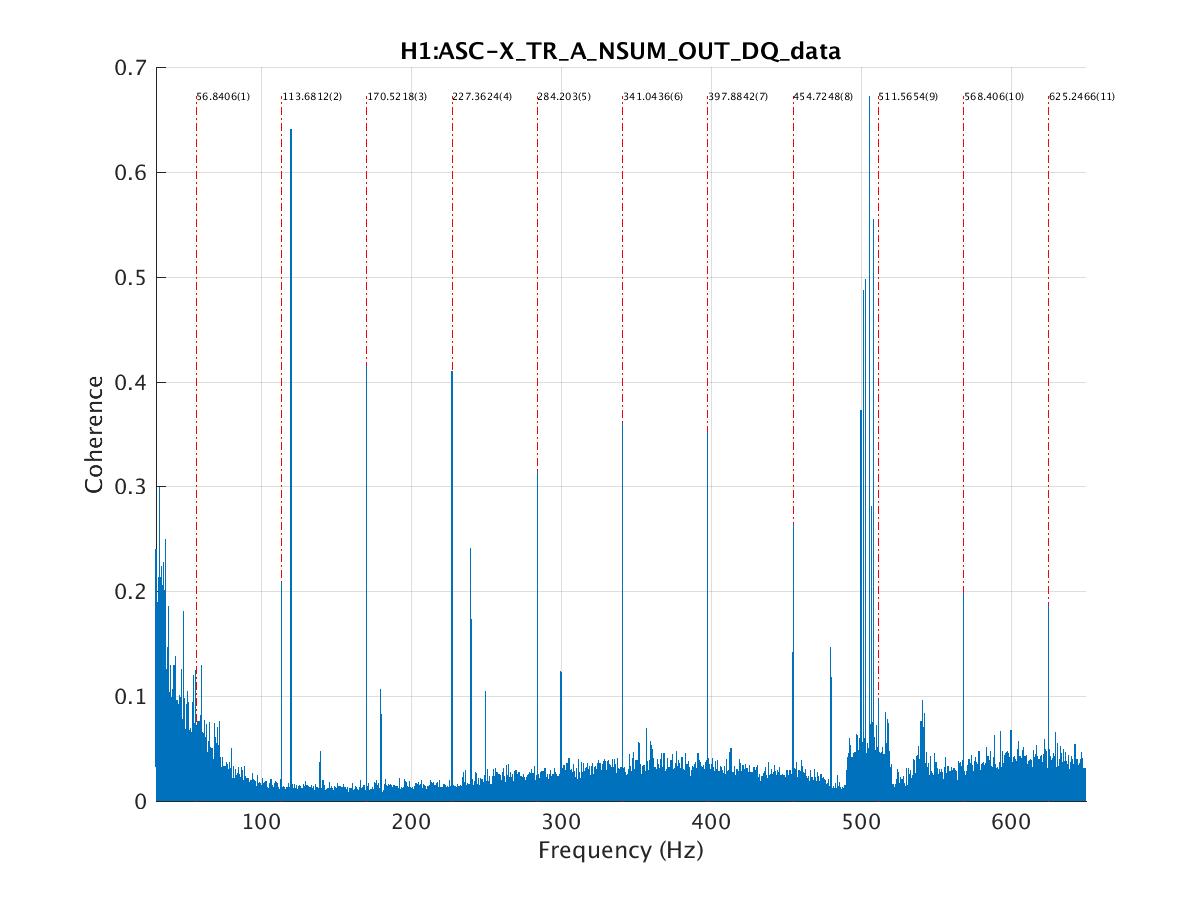
Besides the 35 channels found in the original post, 7 more channels are found to be relevant to the 56.8406Hz Comb. Two new subsystems, ASC and HPI are involved.
These new channels are:
H1:ASC-X_TR_A_NSUM_OUT_DQ
H1:ASC-X_TR_B_NSUM_OUT_DQ
H1:HPI-ETMX_BLND_L4C_Y_IN1_DQ
H1:HPI-ETMX_BLND_L4C_Z_IN1_DQ
H1:PEM-EX_ACC_BSC9_ETMX_X_DQ
H1:SUS-ETMX_L1_WIT_L_DQ
H1:SUS-ETMX_L1_WIT_P_DQ
So updated channel list is (42 channels in total):
H1:ASC-X_TR_A_NSUM_OUT_DQ
H1:ASC-X_TR_B_NSUM_OUT_DQ
H1:HPI-ETMX_BLND_L4C_Y_IN1_DQ
H1:HPI-ETMX_BLND_L4C_Z_IN1_DQ
H1:ISI-ETMX_ST1_BLND_RX_T240_CUR_IN1_DQ
H1:ISI-ETMX_ST1_BLND_RY_T240_CUR_IN1_DQ
H1:ISI-ETMX_ST1_BLND_RZ_T240_CUR_IN1_DQ
H1:ISI-ETMX_ST1_BLND_X_T240_CUR_IN1_DQ
H1:ISI-ETMX_ST1_BLND_Y_T240_CUR_IN1_DQ
H1:ISI-ETMX_ST1_BLND_Z_T240_CUR_IN1_DQ
H1:ISI-ETMX_ST2_BLND_RX_GS13_CUR_IN1_DQ
H1:ISI-ETMX_ST2_BLND_RY_GS13_CUR_IN1_DQ
H1:ISI-ETMX_ST2_BLND_RZ_GS13_CUR_IN1_DQ
H1:ISI-ETMX_ST2_BLND_X_GS13_CUR_IN1_DQ
H1:ISI-ETMX_ST2_BLND_Y_GS13_CUR_IN1_DQ
H1:ISI-ETMX_ST2_BLND_Z_GS13_CUR_IN1_DQ
H1:ISI-GND_STS_ETMX_X_DQ
H1:ISI-GND_STS_ETMX_Y_DQ
H1:LSC-X_TR_A_LF_OUT_DQ
H1:PEM-EX_ACC_BSC9_ETMX_X_DQ
H1:PEM-EX_ACC_BSC9_ETMX_Y_DQ
H1:PEM-EX_ACC_BSC9_ETMX_Z_DQ
H1:PEM-EX_ACC_ISCTEX_TRANS_X_DQ
H1:PEM-EX_ACC_VEA_FLOOR_Z_DQ
H1:PEM-EX_MAINSMON_EBAY_1_DQ
H1:PEM-EX_MAINSMON_EBAY_2_DQ
H1:PEM-EX_MAINSMON_EBAY_3_DQ
H1:PEM-EX_MIC_VEA_MINUSX_DQ
H1:PEM-EX_MIC_VEA_PLUSX_DQ
H1:PEM-EX_SEIS_VEA_FLOOR_X_DQ
H1:PEM-EX_SEIS_VEA_FLOOR_Y_DQ
H1:SUS-ETMX_L1_WIT_L_DQ
H1:SUS-ETMX_L1_WIT_P_DQ
H1:SUS-ETMX_L1_WIT_Y_DQ
H1:SUS-ETMX_L2_WIT_L_DQ
H1:SUS-ETMX_L2_WIT_P_DQ
H1:SUS-ETMX_L2_WIT_Y_DQ
H1:SUS-ETMX_M0_DAMP_L_IN1_DQ
H1:SUS-ETMX_M0_DAMP_P_IN1_DQ
H1:SUS-ETMX_M0_DAMP_T_IN1_DQ
H1:SUS-ETMX_M0_DAMP_V_IN1_DQ
H1:SUS-ETMX_M0_DAMP_Y_IN1_DQ
Attached images are sample plots from ASC and HPI subsystem.
Full results are also attached.
Coherence Search Results of All the Single Lines in ER9 Data
Here are the coherence search results of all the single lines in ER9 data, which are listed in Keith’s post. I found 29 of all the 198 lines on the list and posted the results on my homepage here:
https://ldas-jobs.ligo-wa.caltech.edu/~duo.tao/ER9_single_lines/index.html