Just a theory here...But I believe the H2 coil driver needs attention.
H2 Drives off as RZ and X Loops, H2 only directly affects RZ and X. If it were the loops, of Actuator Drives would respond. Page 11 of attached show the CD I & V INMONs going wacky impacting the RZ and X(page 4) loops 1 or more seconds before the model responds.
I know this is long winded, you should see the stuff in the text file not preinted here as I went down other rabbit holes.
ITMX ISI Tripped Wednesday July 13 AM from M6.3 EQ in New Zealand. No other platforms tripped. The extra sensitivity of the ITMX to EQs is not new. Based on the ground Seismometer STS2-B, it looks like the trip occurred with the arrival of the S-Wave (Shear, not surface.) See page 1 of attachment. Based on the EPICS records, ST2 tripped first; based on the FIRSTTRIG_LATCH value, the Actuators hit their rail first.
Page 2: 80 seconds with the Actuator drives. The upper right graphs have the horizontals and verticals on the same plot. Given that there is no RX or RY loop closed, it makes sense that the three vertical drives are exactly the same. Leading up to the trip, the H1 and H3 drives appear to be getting a greater request from the loops compared to the corner2 horizontal. The H2 GS13 is parallel to the X arm and so contributes nothing to the Y DOF. The verticals are well behaved. However, a couple of seconds before the EPICS INMON registers the state change (1 to 2,) the H2 drive shoots almost straight to the rail. This delay makes sense with the 8192 saturations required before tripping on this 4k model. The upper left plot zooms out on the H2 drive as it ramps its way up to e7 before the watchdog trip takes it to zero. The H1 and H3 drives continue along until the trip when they start to ring. After the trip the three horizontals behave similarly. You might believe there is a kink in these other drives a few seconds earlier,...ehhh.
So the behavior of Drive2 may be of interest. Is this a coil driver problem or does it originate from up stream?
Upstream is the damping, isolation, and feedforward paths. There is no indication that the vertical loop is a problem and feedforward only goes to Z; and, there are no DQ channels for the damping loops—they will have to wait for further upstream examination. This leaves the isolation loops.
Page 3 shows 80 seconds of the Isolation loop inputs. The ITMX and ITMY IN1s are overlain on the same plots. Also shown are the horizontal ground motions; the vertical is uninteresting. The ground motion signals overlain on the isolation plots are scaled and shifted so as to be seen. This shows that both ITMX and ITMY X & Y DOFs are doing about the same and are fairly well correlated with the input ground motion hence the control loops are pretty much the same. I've also verified this looking at the Matlab Controller figures. Around xx8505 gps, the Y ground motion quickly increases, this may be the arrival of the s-wave. The Y loop responds but within several seconds, the response doesn't seem as reasonable and looks to be ringing up and getting behind the curve. The X gets hit with this some 30 seconds later. I don't know if the mostly flatish nature of the RZ loops is or is not remarkable. As well, is the scale of noise/buzz difference between ITMX and Y worth noting? Conversely, the Z DOFs seem to be responding to the same input but certainly drive harder on the ITMX.
So the H2 Drive goes wacky before the others. The X and RZ loops feed the H2 Drive and both those ISOs head off to the outer reaches. The Y loop sees a blip and then gets buzzy/noisy; the Z sees nothing. The H2 Drive is pushing the platform and the X and RZ motion is seen back at the ISO_IN1. It makes sense that the Y DOF would also see something if the H2 actuator is the only one pushing. The push on H2 Drive could produce canceling affects on the H1 and H3 sensors and not push that DOF iso off the page. If the RZ loop was driving it, the response would be the same on all Horz GS13s but they are not responding the same.
On page 4 the Drives and ISO Ins are plotted together for 4 seconds. Clearly the H2 Drive leads the other drives as already established. On the top plot of the ISOs, the X and RZ loops respond dramatically compared to the blip on Y. Further, the ISOs are scaled by 5 to emphasize their behavior before the Drive goes off. The Y loop looks to be trundling along but X and RZ and maybe more clearly RZ changes what it had been doing.
This might suggest the loops are causing this but the fact that only the H2 Drive reacts implies that circuit is more sensitive.
On page 5, only ISOs X and RZ are shown with the H2 Drive. On the top plot, the drive is scaled down to be visible with the zoomed in ISO loops. The RZ loop really seems to be headed somewhere bad before the drive freaks out. Again however, if the loop was the source, the other drives would be reacting similarly and they are not.
On Page 6, one sees the ITMY loops don't respond like the ITMX X and RZ loops--not caused by the common ground motion.
On pages 7 & 8, an interesting beat is seen on the HEPI L4C RZ loops. Otherwise nothing else on the HEPI IPS or L4Cs of either ITM.
Page 9, the GS13s of ITMY are overlain on the ITMX GS13s for 20 seconds showing the motion on the platform is nearly identical on the two ITMs.
On page 10, the horizontal GS13s of ITMX are plotted together (left middle graph) showing the relative magnitudes. This implies only corner 2 is being driven and the others are just seeing the rotation caused by the one corner.
Page 11 plots the H2 CD INMONs, 80 seconds to show the normal before some badness at the trip time.
Page 12 zooms into 10 seconds showing the Coil Driver current and voltage making some really ugly step and excursion one or more seconds before the RZ loop starts to head off. The model did not tell the coils to do this or it would be seen on the DRIVE. The RZ loop and the X loop (page 4) are responding to what the coil driver is doing to the platform. I'm pretty sure this tells us the coil driver is the source of this problem.
Maybe the coil driver is marginal in some way and when the extra demand of dealing with the work of the earthquake motion occurs, something lets go.

NDS2 Data Storage Timing Issue???
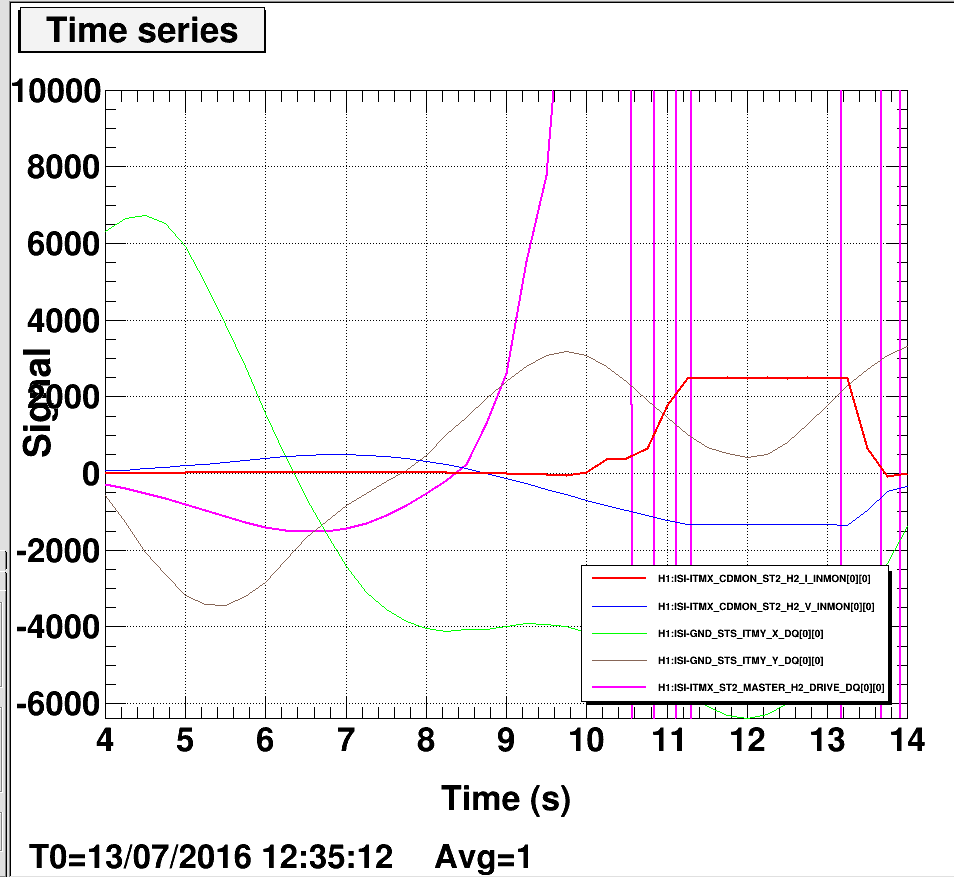
Attached is a ddt plot of the H2 INMONs, the ground motion, and the H2 MASTER DRIVE (the output of the model.) I had to go to NDS2 extraction as the full data is now gone from h1nds1.
On this ddt plot, the hump up to ~500cts on the I mon (RED) starts about 10 seconds whereas the rapid increase of MASTER_H2_DRIVE (violet?) is starting around 9ish seconds.
On page 11 of the pdf above, the ramp up of the Drive channel (center graph) clearly happens after the step in the I_INMON channel (upper middle channel.)
The INMON channels are slow whereas the DQ channels are fast...
I suspect my dataviewer looks are correct but...
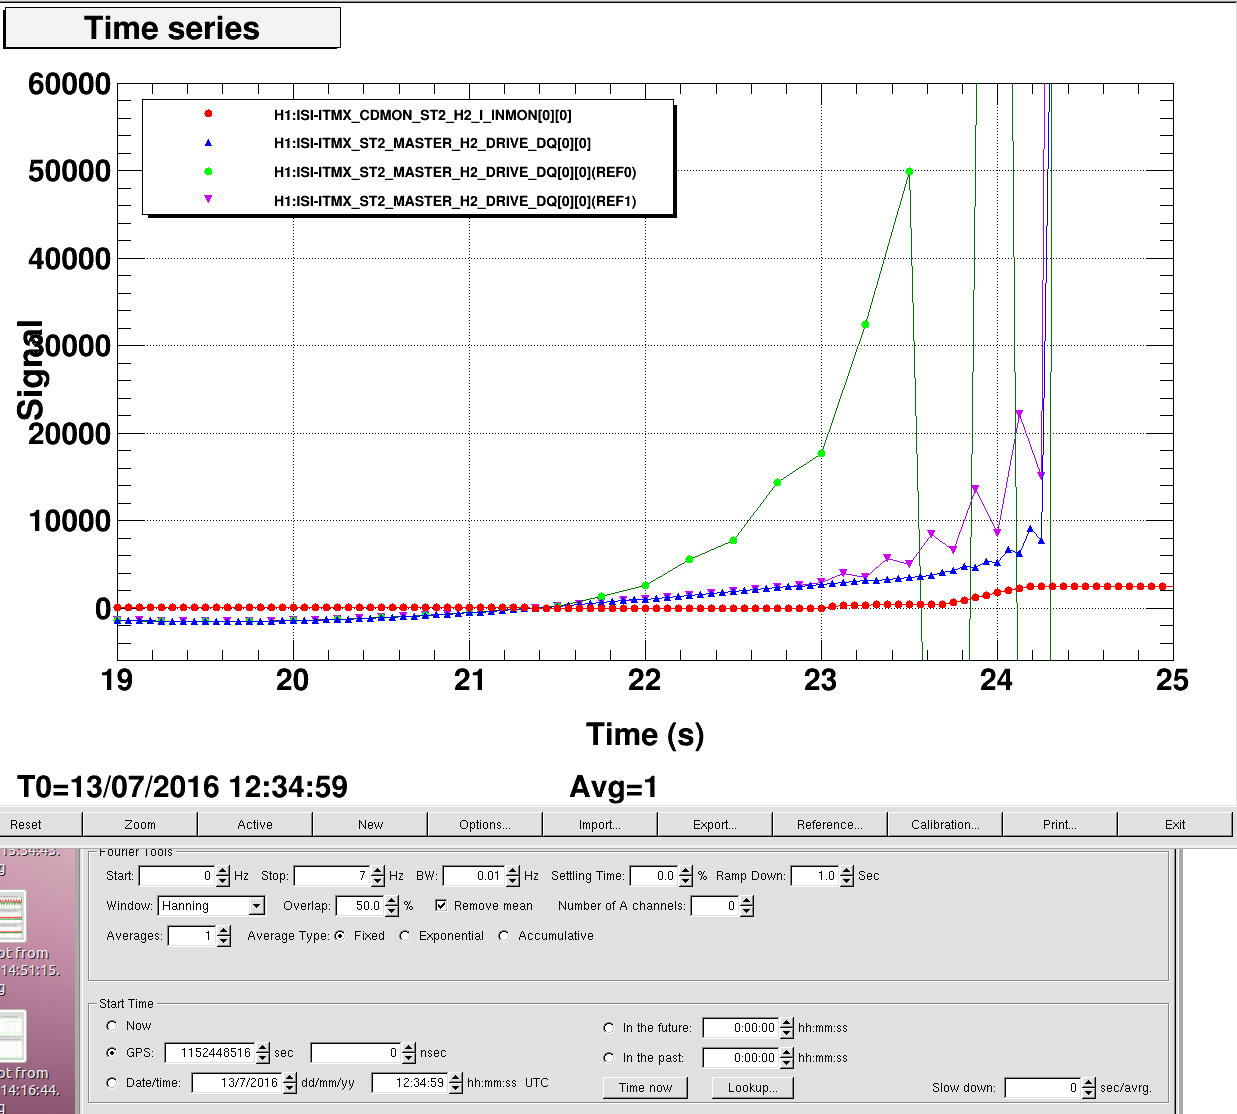
Okay--false alarm on the timing, but a warning to DDT via NDS2 users looking for time series with mixed data rate (16 & 4k) channels---these are the conditions I was working under.
See the attached plot where the red trace is a 16hz FE channel and the reference in green is a 4kHz channel and the measurement setup has the stop frequency at 1 hz and BW of 0.01 hz. Lower in the attached is the fourier tools settings for the Blue data where the only thing changed from the green is to set the stop frequency to 7 hz. The reason for the change in the shape of the data may be obvious to many of you much sharper in your signal and fourier analysis than I but should serve as a warning to all those using DDT to display time series. I had to slow things way down due to the 16 hz channel and just went to and it greatly impact the accompanying fast channel. 2, 3 & 4 HZ stop frequency all produce the brown trace; 5, 6 & 7 all produce the Blue trace. 7 Hz was as high as it would go.