The shot noise level from last night seems higher (worse) than the O1 level by 6%. Here is the spectrum:
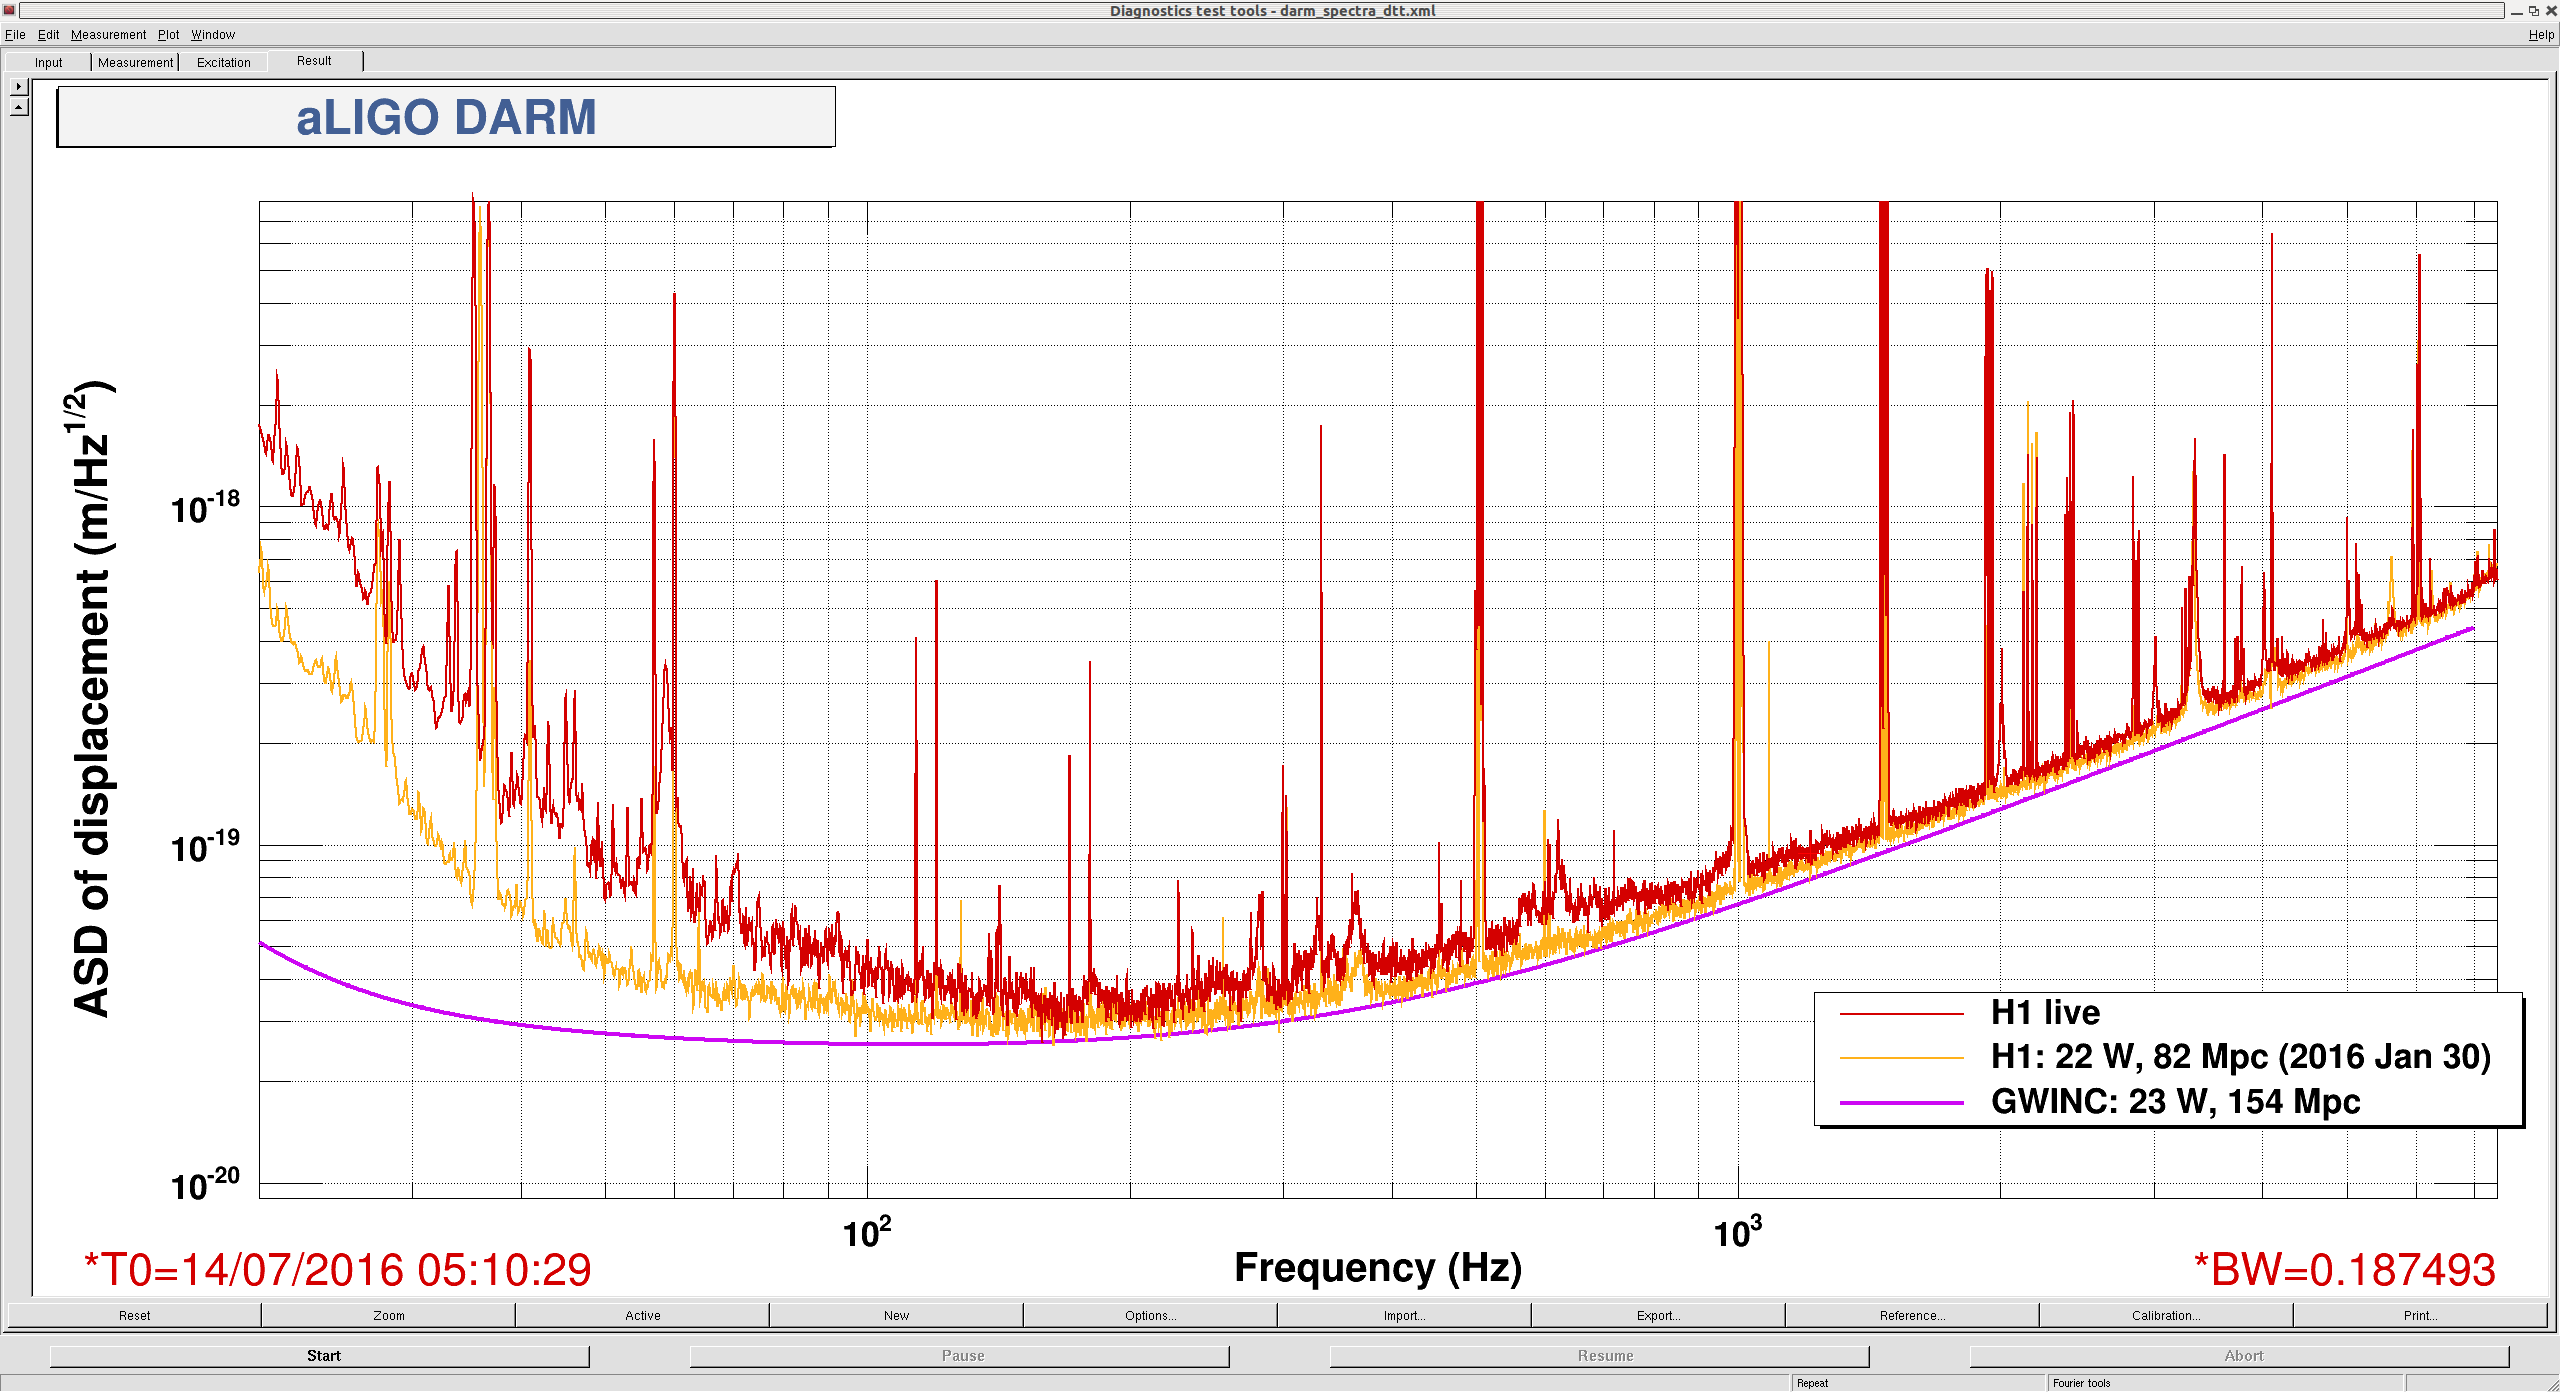
You can see that the red trace (which is the one from the last night) is slightly higher than the (post-) O1 spectrum. The 6% increment was estimated by dividing the two spectra for frequencies above 1200 Hz and taking a median of it.
Evan H. suggested looking at the null and sum channels to see if the excess in shot noise is from an addition technical noise or not. The attached shows the spectrum of the null and sum channels at the same duration as the spectrum in the above entry.
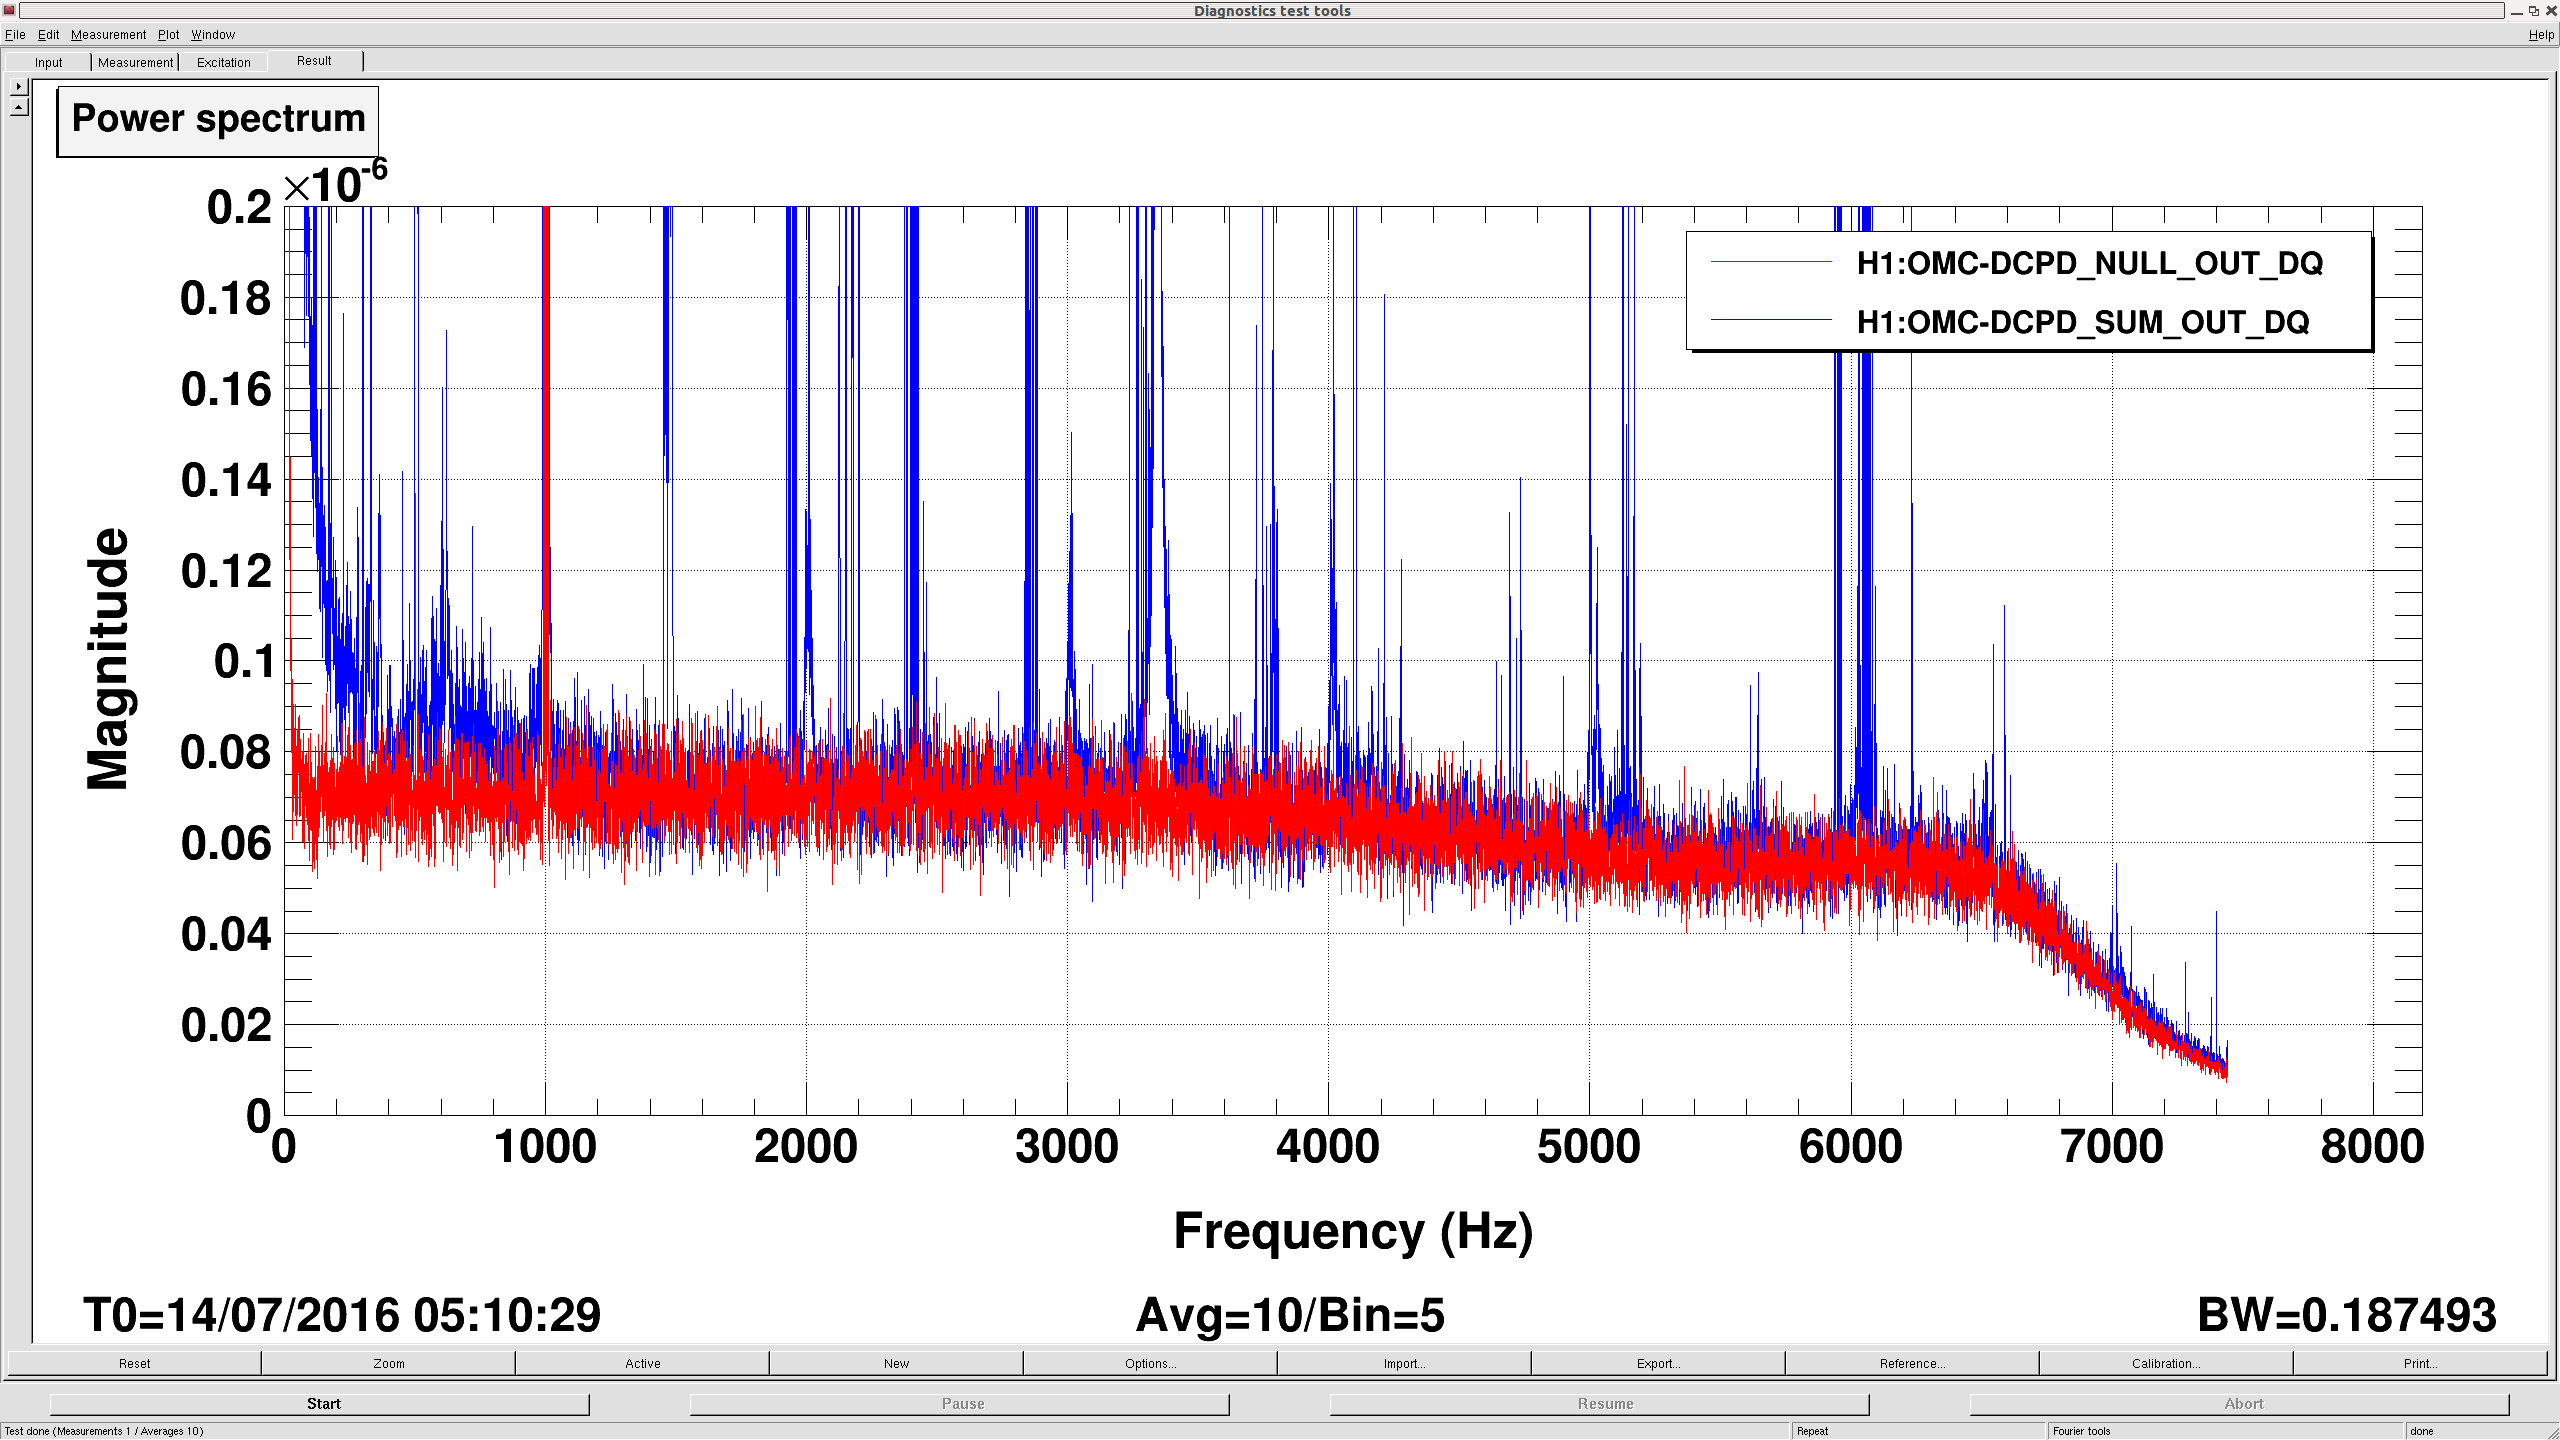
From this plot, it is evident that the excess is not due to technical white noise.
It is quite likely that the calibration is wrong -- the true shot noise level can be smaller than what we have measured.
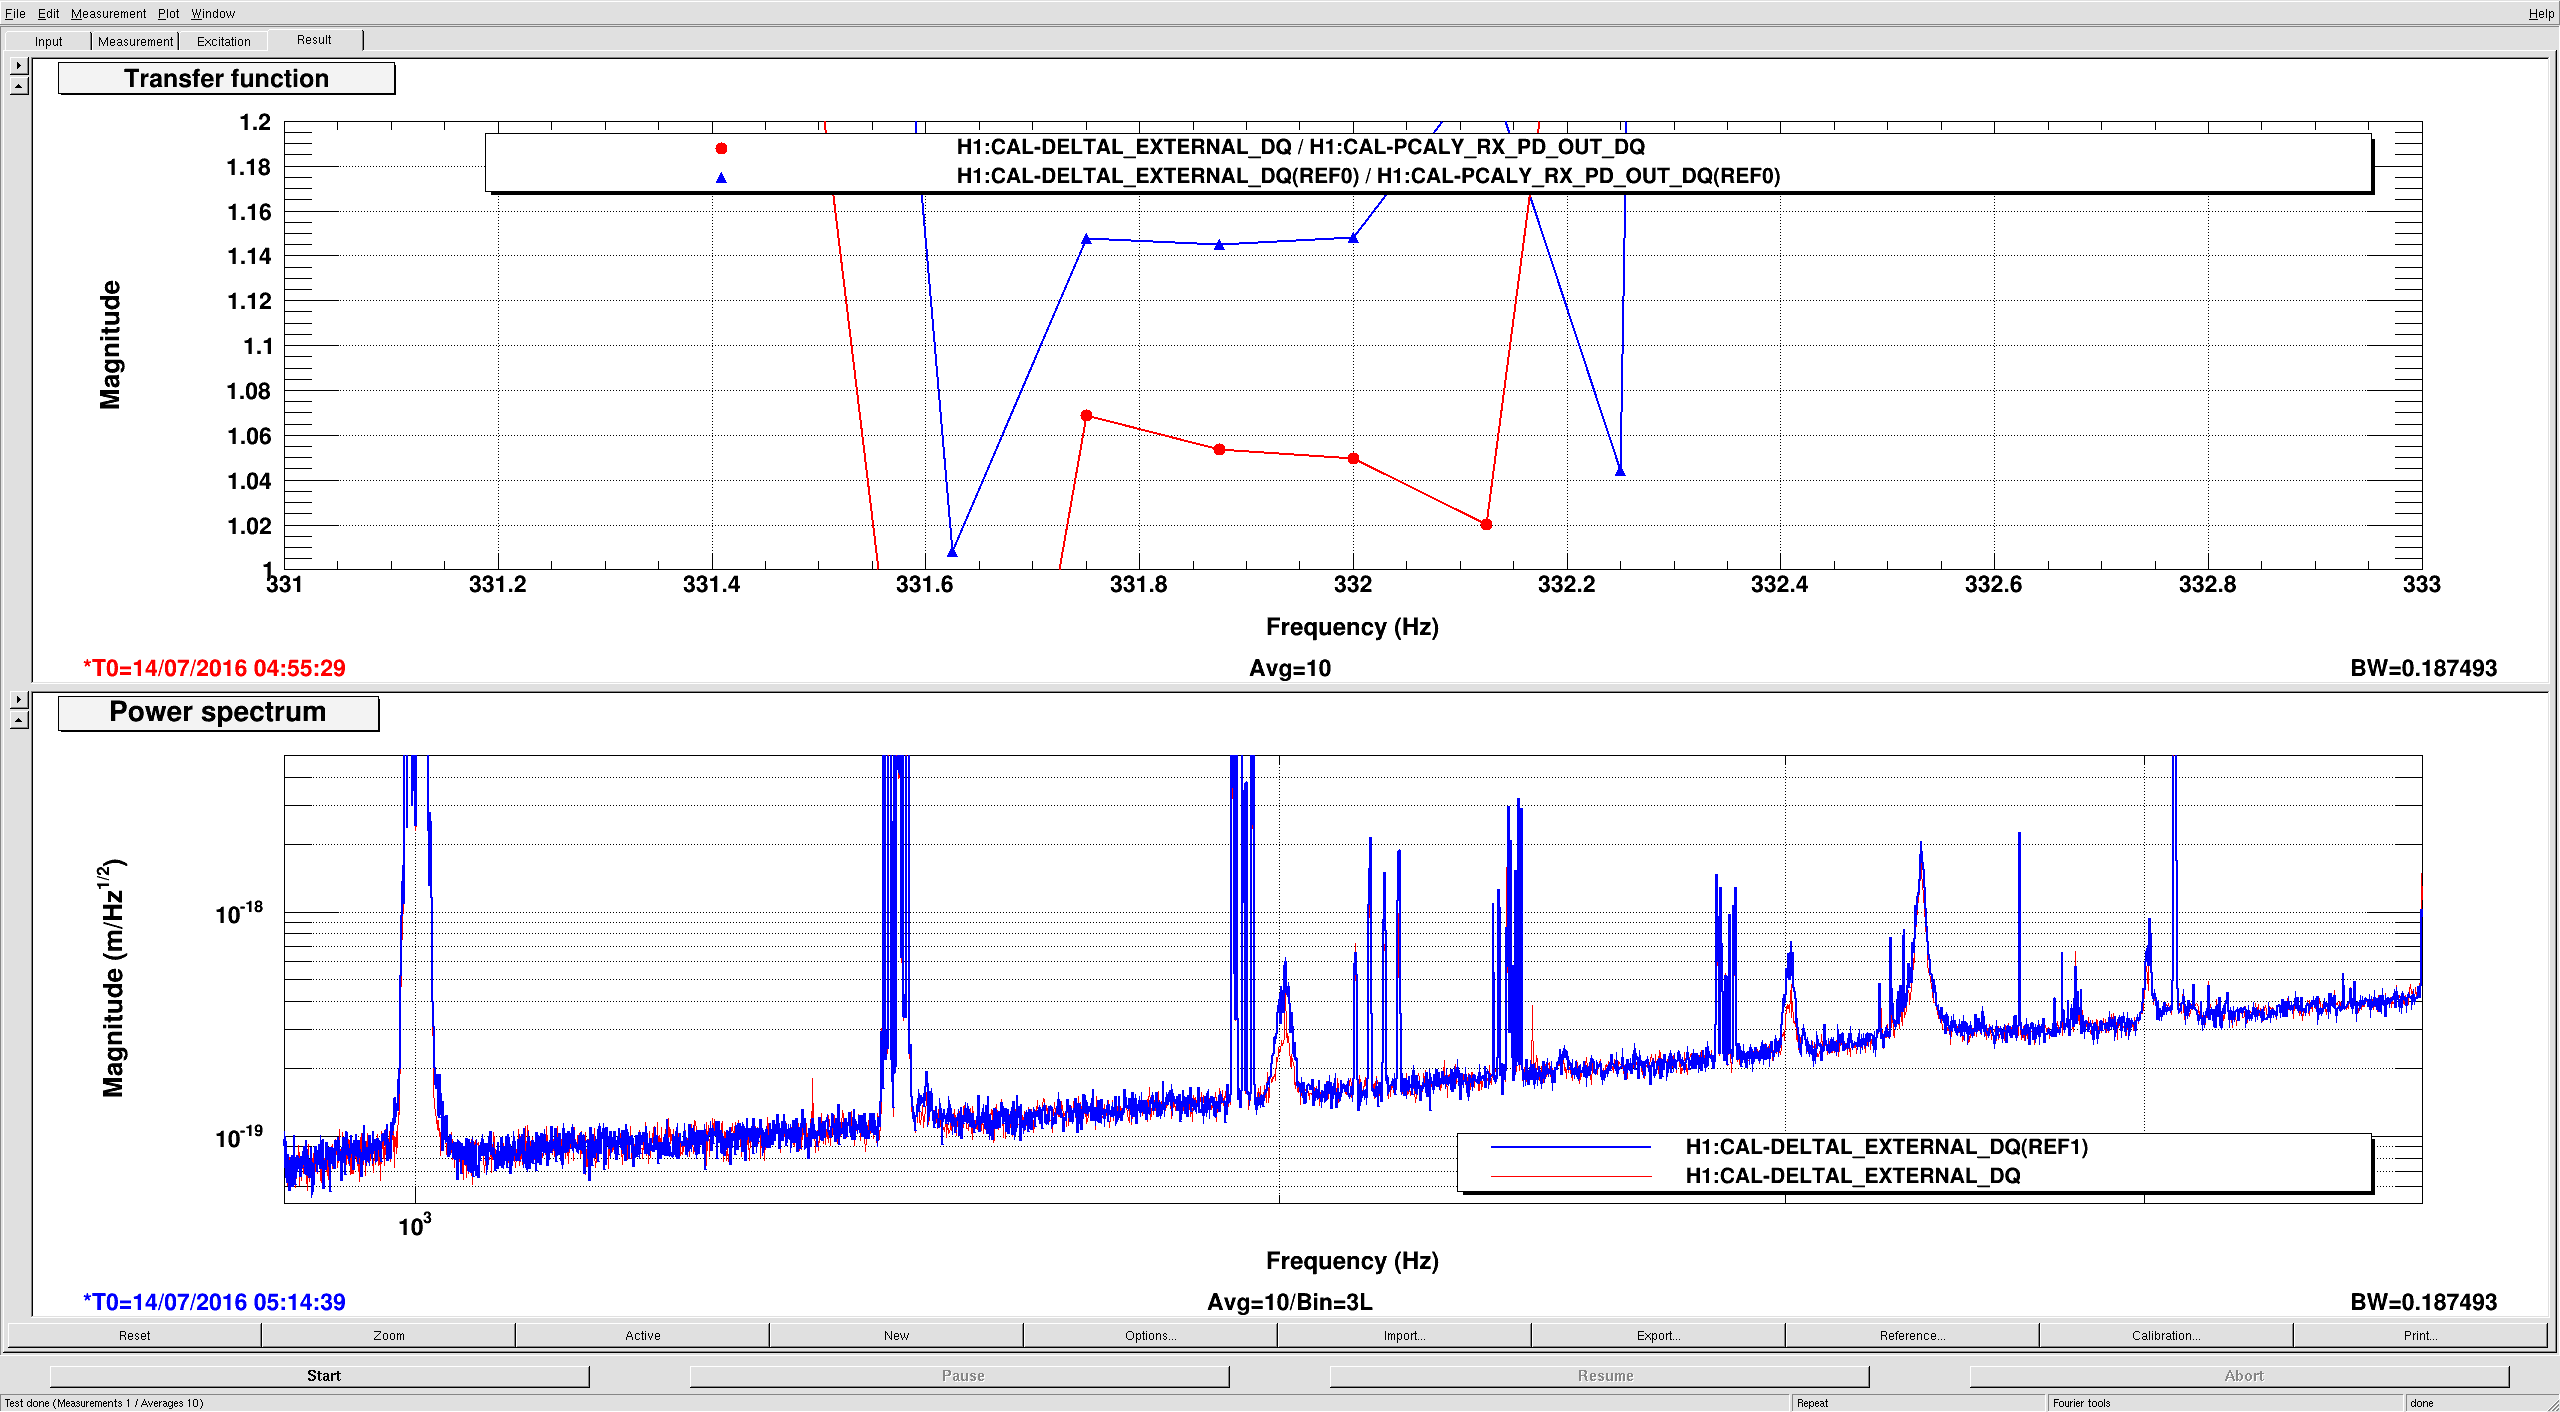
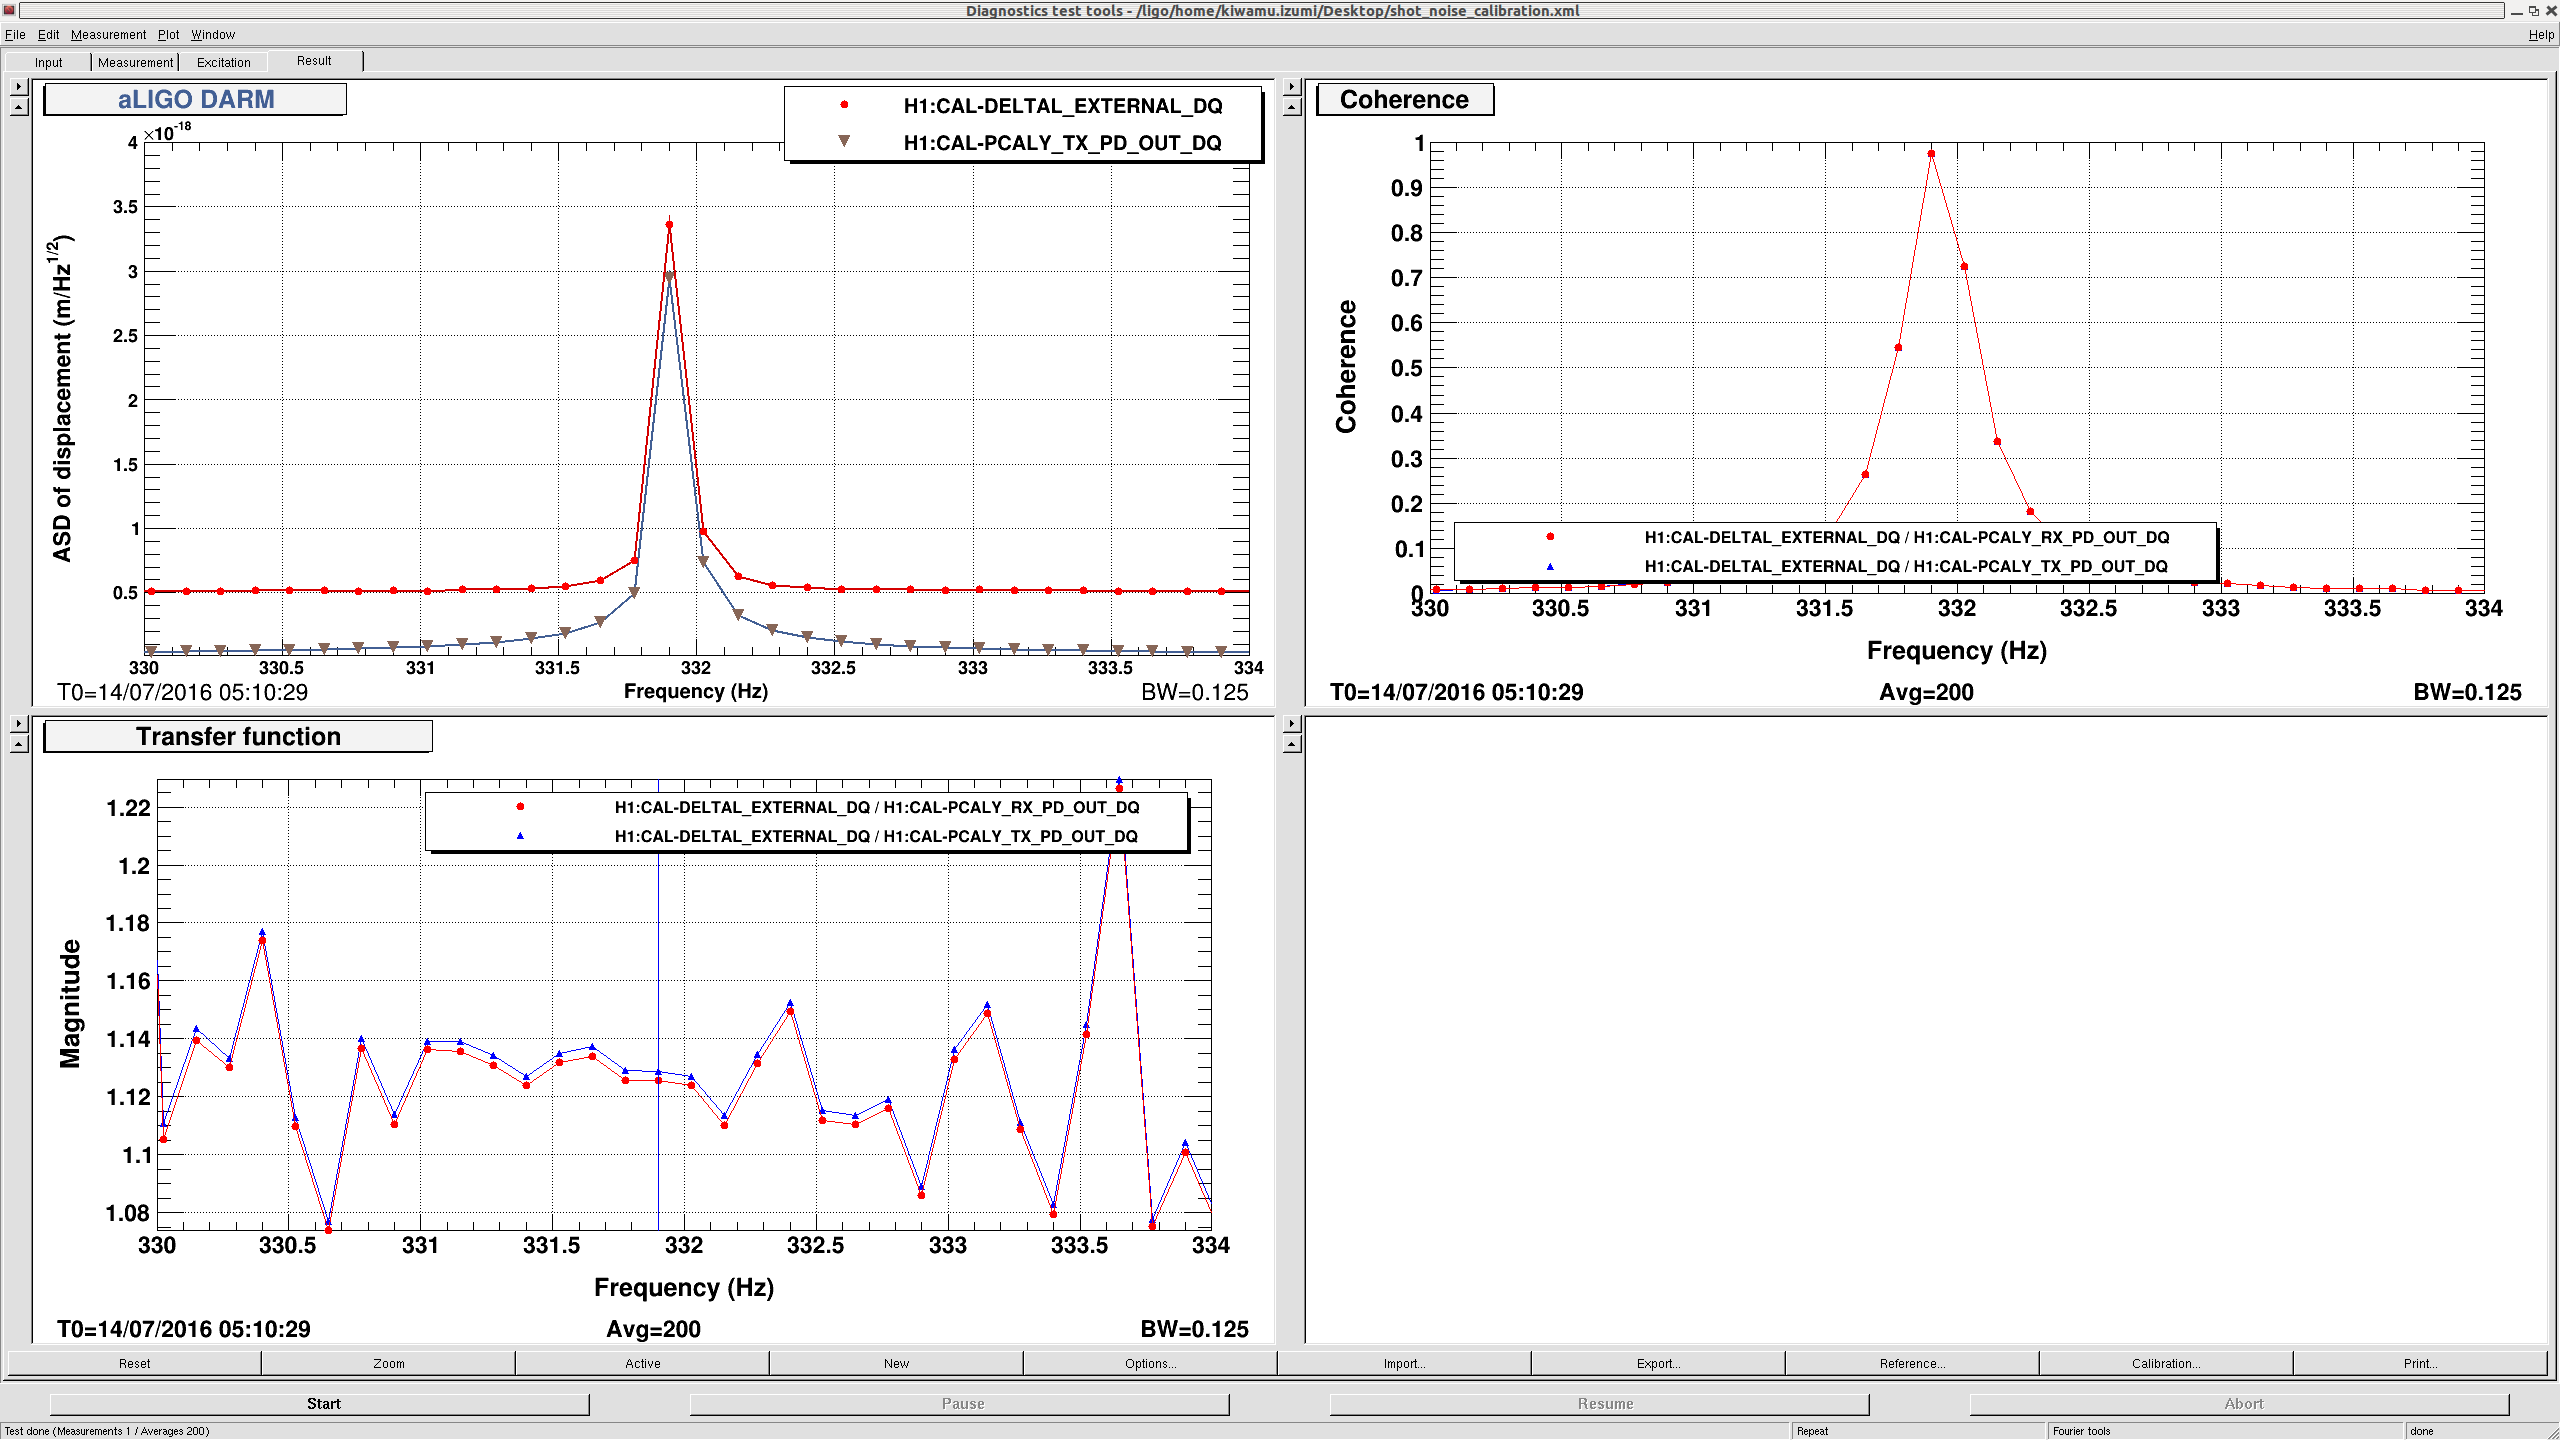
I have checked the calibration of the DARM signal by comparing it against the Pcal excitation signals. I used the same lock stretch as the above entry. The height of the Pcal line at 331.9 Hz in the DARM spectrum was found be too high by 13% relative to the Pcal TR and RX PDs. See the attached. This means that we have overestimated the DARM signal at 331.9 Hz due to a calibration error. If we assume this is all due to an inaccurate optical gain, actual shot noise level should be smaller by the same factor of 13% that what we thought, corresponding to a ~7% smaller shot noise level than that in O1. We need to nail down whether this is an error in the optical gain or cavity pole in order to further evaluate the calibration error.
Note that the Pcal Y uses a fresh set of the calibration factors that was updated a month ago (27983). The ratio of RX PD over TX PD was found to be 1.002 at 331.9 Hz and this makes me think that the Pcal Y calibration is reliable.
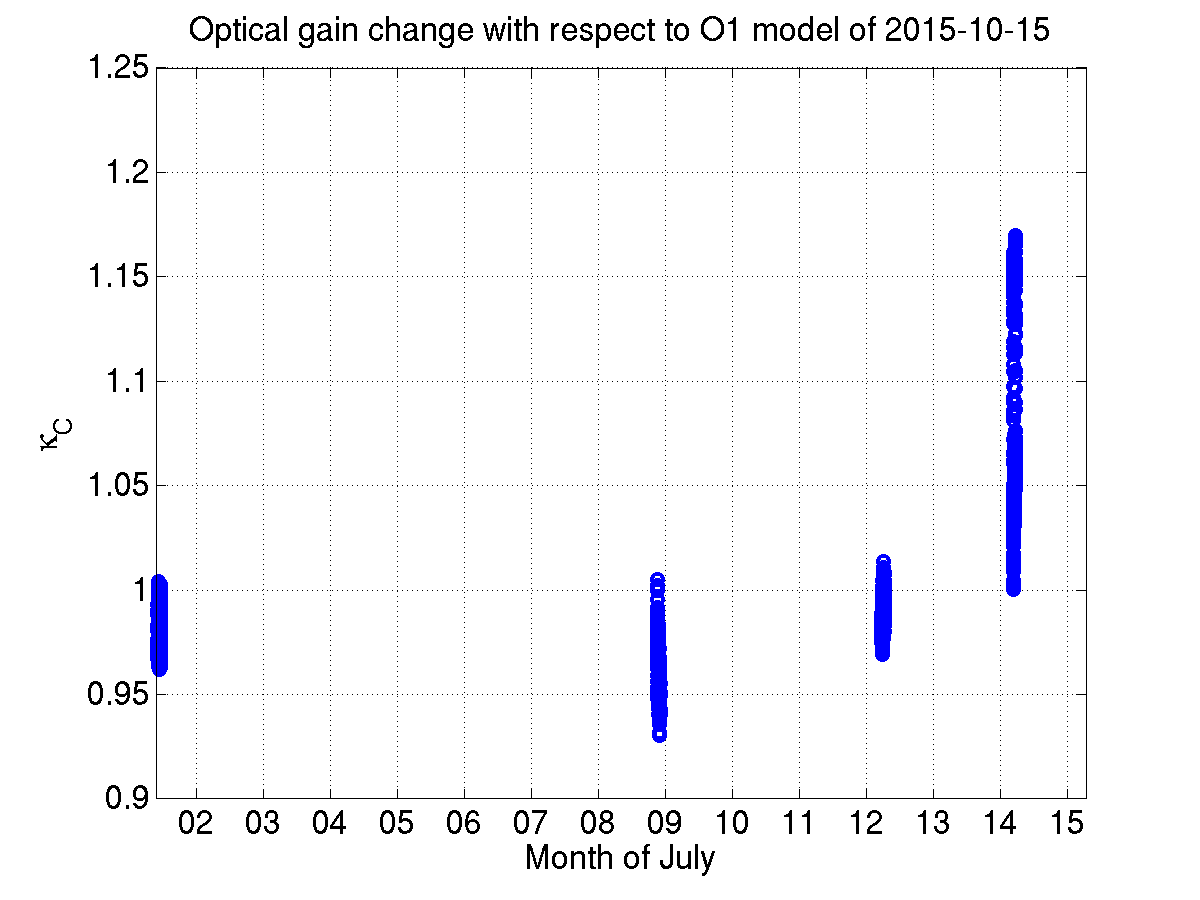
Here I have attached plots of the optical gain during this lock as well a few locks randomly picked during the month of July. I used O1 model as reference (wasn't not quite sure whether there was new time zero reference after O1 with all kappas set to 1). The first plot showing kappa_C over a few locks during July show that kappa_C values were close to 1. However here we note that the gain in the inverse sensing function during July was set to 1.102e-6 compared to 8.834e-7 during O1 (the referene model has changed). At high frequencies, the relation between corrected h(t) and h(t) recorded in front-end is,
corrected h(t) ~ h(t) / kappa_C ~ inv_gain * DARM_ERR / kappa_C
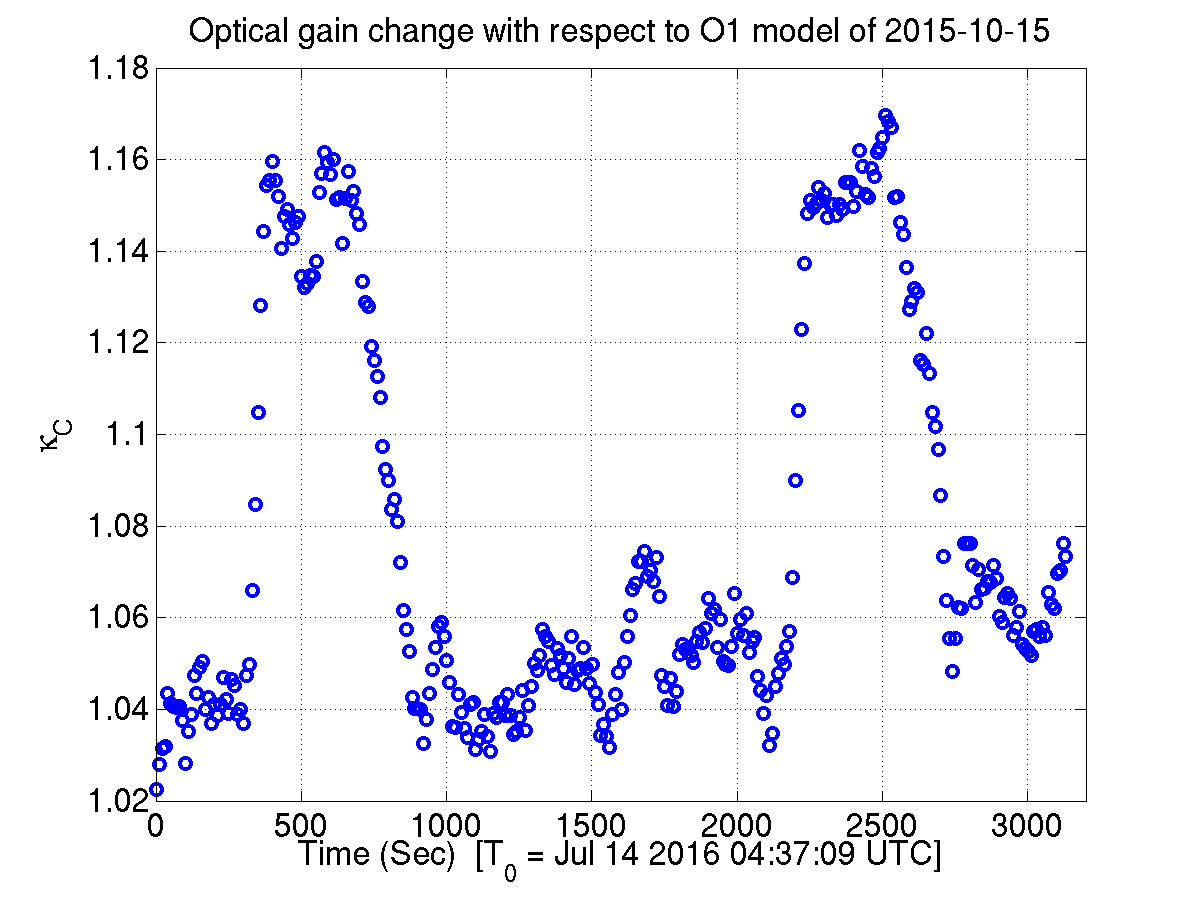
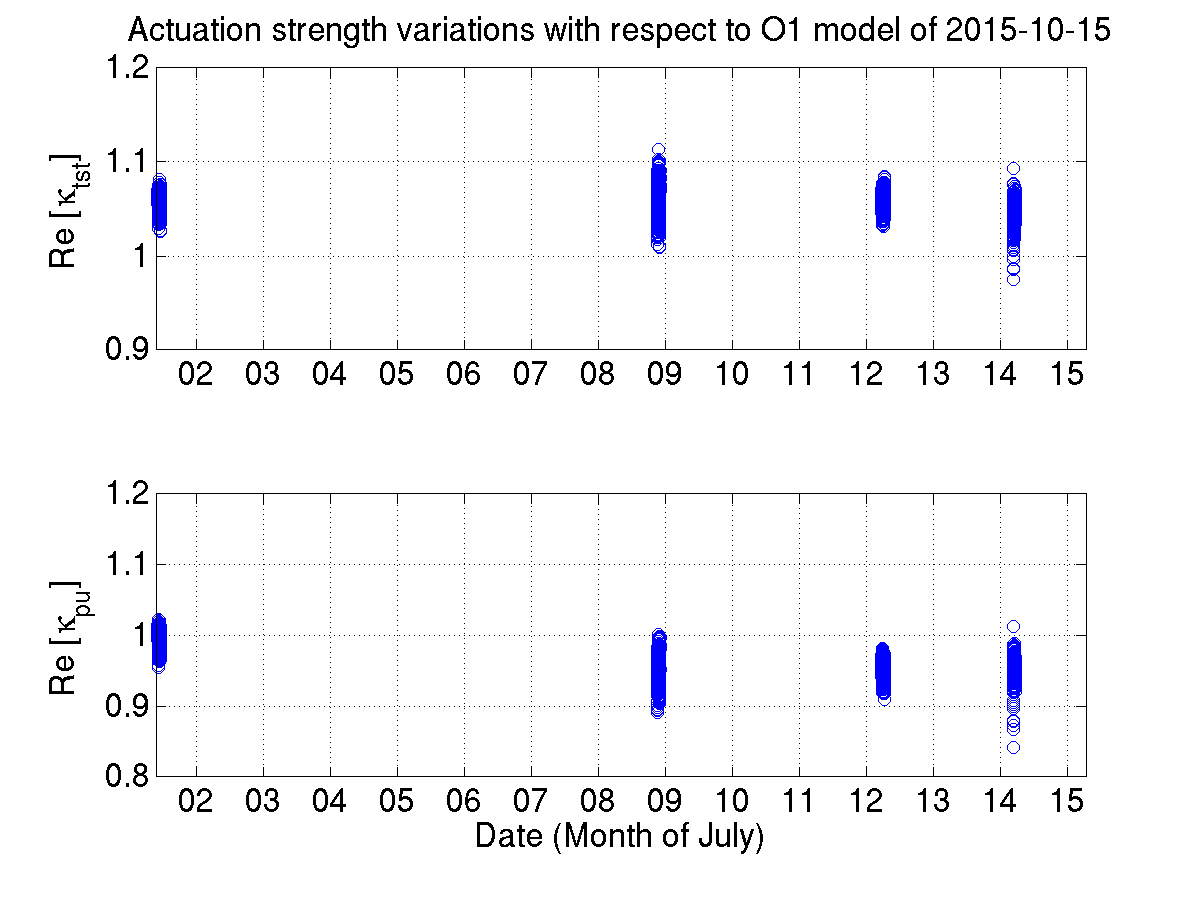
So for same DARM_ERR, kappa_C of 1 during July 2016 corresponds to 0.8 * h(t) (= 8.834e-7 / 1.102e-6) as that of during O1. This assumes that there wasn't any change in the gain of the electronic chain on the OMC side. The second plot show trend of kappa_C during the lock Kiwamu was looking at. An interesting thing to note here that there was ~10% change in the optical gain during this lock. Kiwamu's plot correspond to time of the second peak we see in the plot (a coincidence!). The kappa_C value of 1.15 suggests that the measured h(t) in the above a-log would correspod to 0.70 ( = 8.834e-7/1.102e-6/1.15) times that of h(t) we would be measured during O1. Since the trend plot show that there were times in the same lock during which the kappa_C values were different, I tried to compare the power spectrum between those times. The third plot show that comparison. The mystery is that eventhough the ratio between the 331.9 Hz photon calibrator line and DELTAL_EXTERNAL line is ~10 % different between the times compared (and hence corresponding to ~10% different optical gain), the shot noise level looks same! We couldn't get the exact cavity pole frequencies because at this point I don't have the new LHO DARM model function, but the trend indicated that it didn't change during the lock. For completeness we also added the acutation strength variation during this time. The values are close to what we expect. Since 35.9 Hz ESD line we used during O1 wasn't available, for actuation strength comparison we used 35.3 Hz ESD line.
EDIT: We corrected the earlier estimate of high frequency h(t) level change.