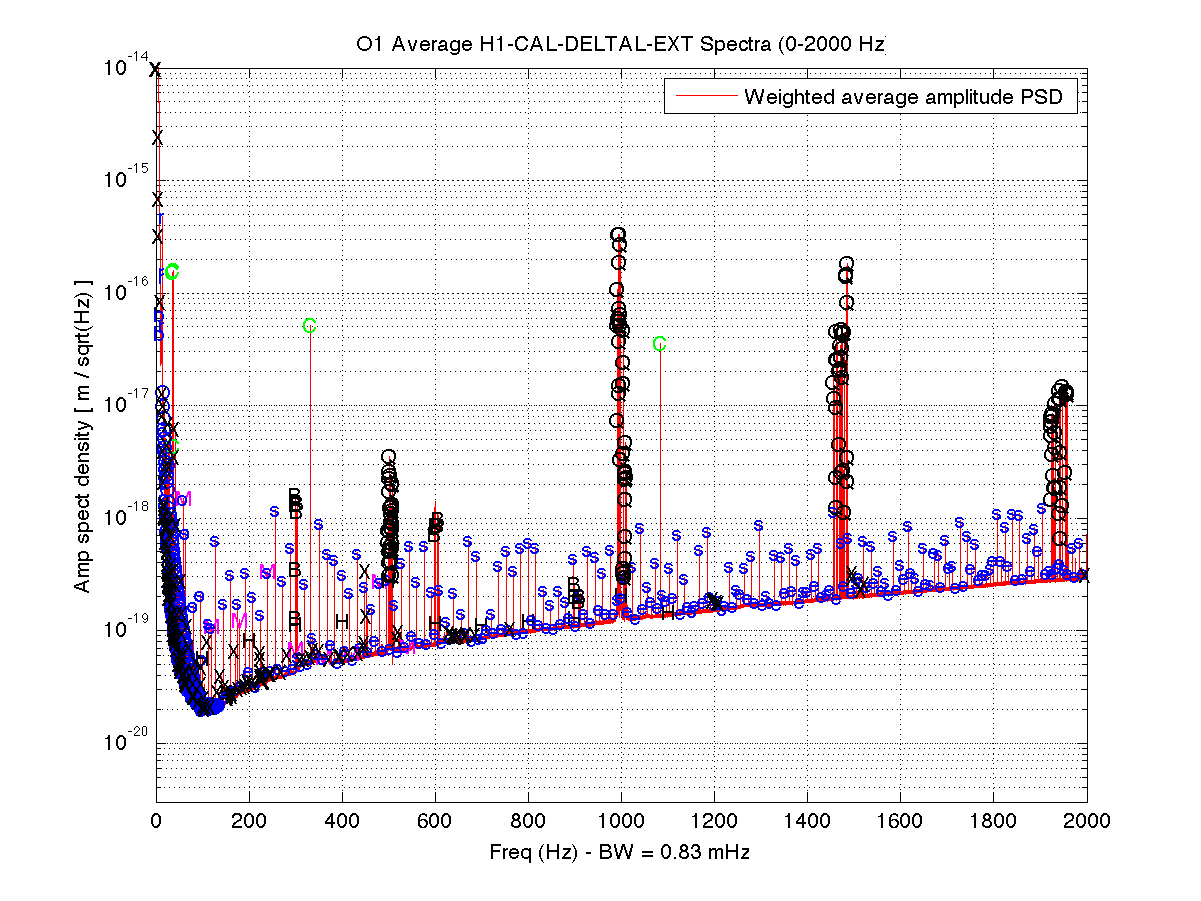
Executive summary:In regard to narrow lines, the (nearly) full O1 H1 data set is little changed from what was reported for the first week's data: a pervasive 16-Hz comb persists throughout the CW search band (below 2000 Hz), accompanied by a much weaker and more sporadic 8-Hz comb; there remain several distinct 1-Hz and nearly-1-Hz combs below 140 Hz, along with other sporadic combs. The 1459.5 hours of 30-minute FScan SFTs used here span from September 18 to the morning of January 3. The improved statistics make weaker and finer structures more visible than in the 1st week's data. As a result, many new singlet lines have been tagged, and it has become apparent that some previously marked singlets actually belong to newly spotted comb structures. The improved statistics also make it more apparent that the originally spotted combs span a broader bandwidth than marked before Details: Using 1459.5 hours of FScan-generated, Hann-windowed, 30-minute SFTs, I have gone through the first 2000 Hz of the DARM displacement spectrum (CW search band) to identify lines that could contaminate CW searches. This study is very similar to prior studies of ER7 data, ER8 data and the first week of O1 data, but for completeness, I will repeat below some earlier findings. Some sample displacement amplitude spectra are attached directly below, but more extensive sets of spectra are attached in a zipped file. As usual, the spectra look worse than they really are because single-bin lines (0.5 mHz wide) appear disproportionately wide in the graphics A flat-file line list is attached with the same alphabetic coding as in the figures. Findings:
- A 16-Hz comb pervades the entire 0-2000 Hz band (and well beyond, based on daily FScans)
- A typically much weaker and sporadic 8-Hz comb (odd harmonics) is also pervasive (all harmonics are labeled in figures, even when not visible)
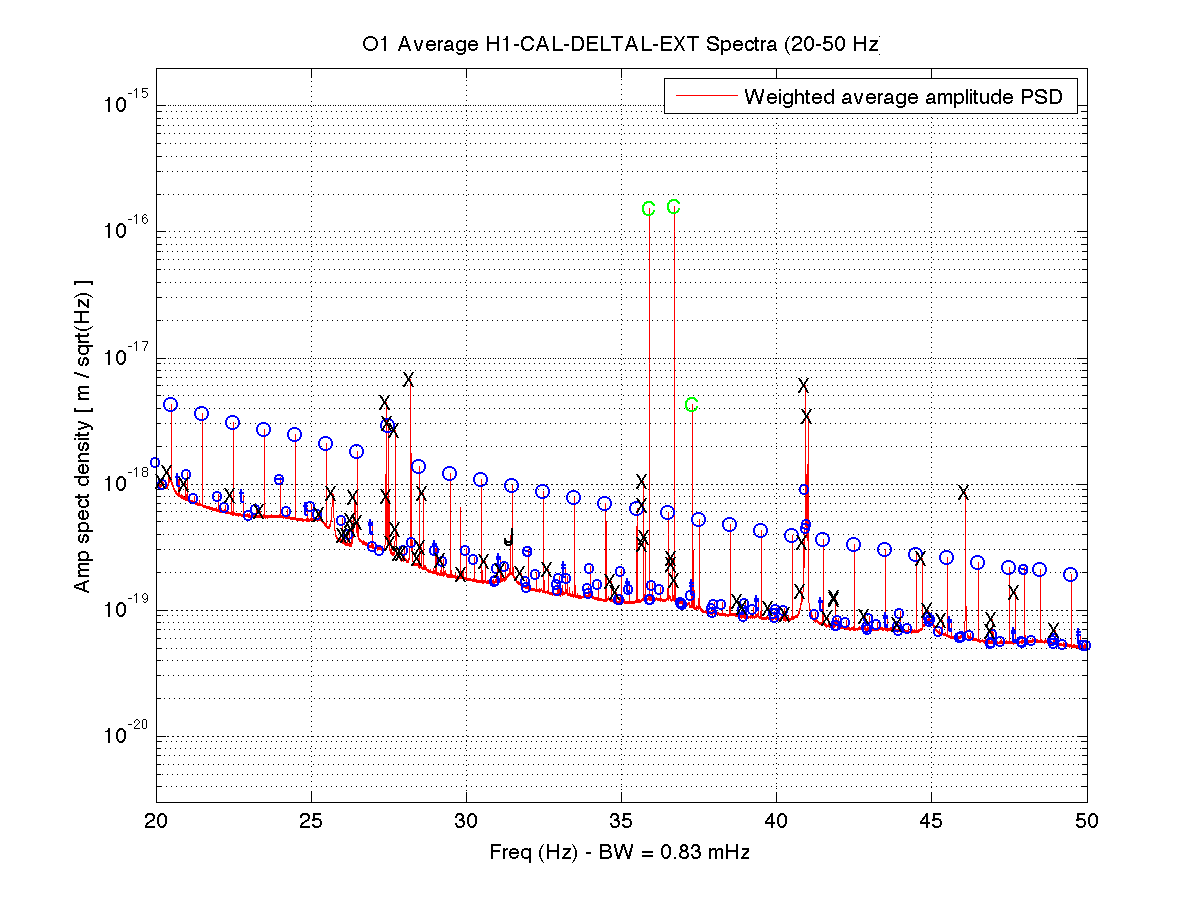
- A 1-Hz comb with a 0.5-Hz offset is visible from 10.5 Hz to 133.5 Hz (previously was visible from 15.5 to 78.5 Hz)
- A 1-Hz comb with zero offset is visible from 16.0 Hz to 102.0 Hz (previously was visible from 20.0 to 68.0 Hz)
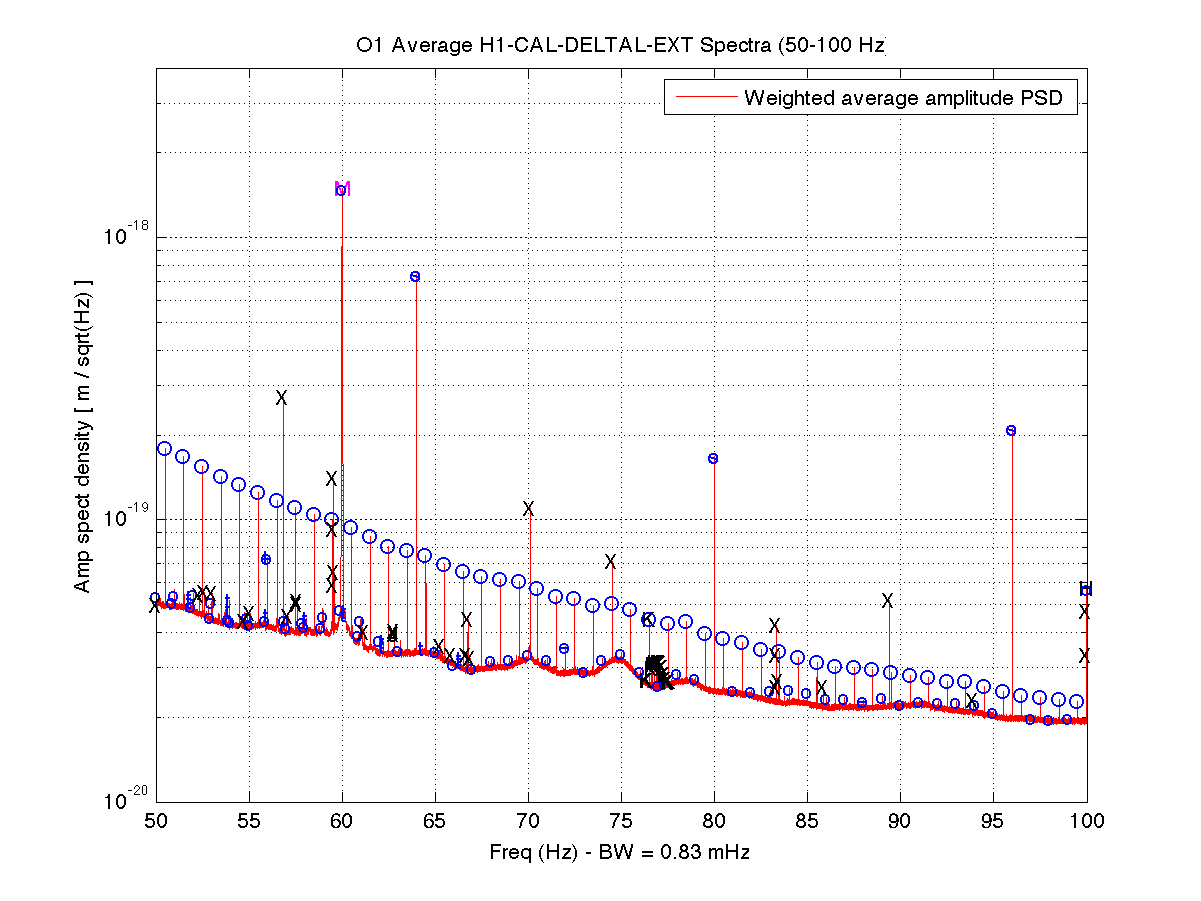
- A 99.9989-Hz comb is visible to its 11th harmonic (was previously visible to its 8th harmonic)
- The 60-Hz power mains comb is visible to its 9th harmonic (was previously visible to its 6th harmonic)
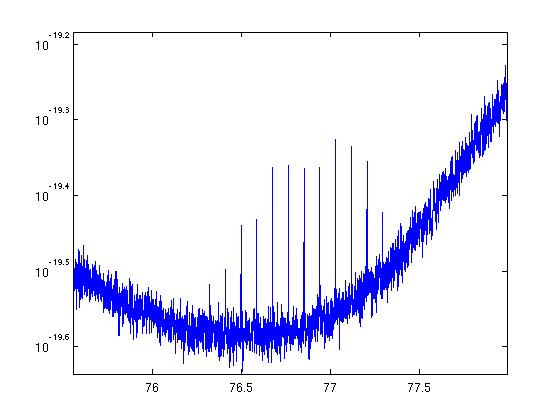
- There is a sporadic comb-on-comb with 0.088425-Hz fine spacing that appears with limited spans in three places near harmonics of 77, 154 and 231 Hz (ambiguity in precise fundamental frequency)
- There is a doublet 31.4127 and 31.4149 Hz comb visible to their 2nd harmonics (previously marked as only a 31.4149-Hz comb)
- There are three near-1-Hz combs not previous appreciated:
- 0.99999-Hz comb from 19.2500 to 50.2497 Hz
- 0.99816-Hz comb from 30.9430 to 60.8878 Hz
- 0.9992-Hz comb from 30.9738 to 48.9594 Hz
- There is a doublet comb with spacings of 2.07412 and 2.07423 Hz, visible from their 9th to 32th harmonics (18.7-66.4 Hz)
- There is a hint of another doublet comb with spacings of 99.9735 and 99.9784 Hz, but they are marked as singlets for now


In week 1 Keith identified a comb-on-comb (labeled K, see attached plot), fine spacing 0.08842 Hz, which shows up sporadically at around 77, 154, and 231 Hz. We found it in a large group of channels, centered at the INPUTOPTICS/SUS-BS/SUS-ITM (see full attached list). It remains clearly visible (especially at 77 Hz) in those channels until week 5 of O1, during which it disappears from all of them in all three regions (see attached example). Therefore, it seems likely that its presence in the full O1 data is an artifact from the first four weeks.

I recently re-analyzed this data while testing a comb-finding algorithm, and in the process found a new comb which accounts for several peaks marked as singlets in Keith's original post. This comb has a 2.040388 Hz spacing, with visible harmonics from 9th (18.3635 Hz) to 38th (77.5347 Hz). The code I used, and its docs, can be found on gitlab (requires login).