It appears that something goes wrong when zooming in that creates random lines across the plots.
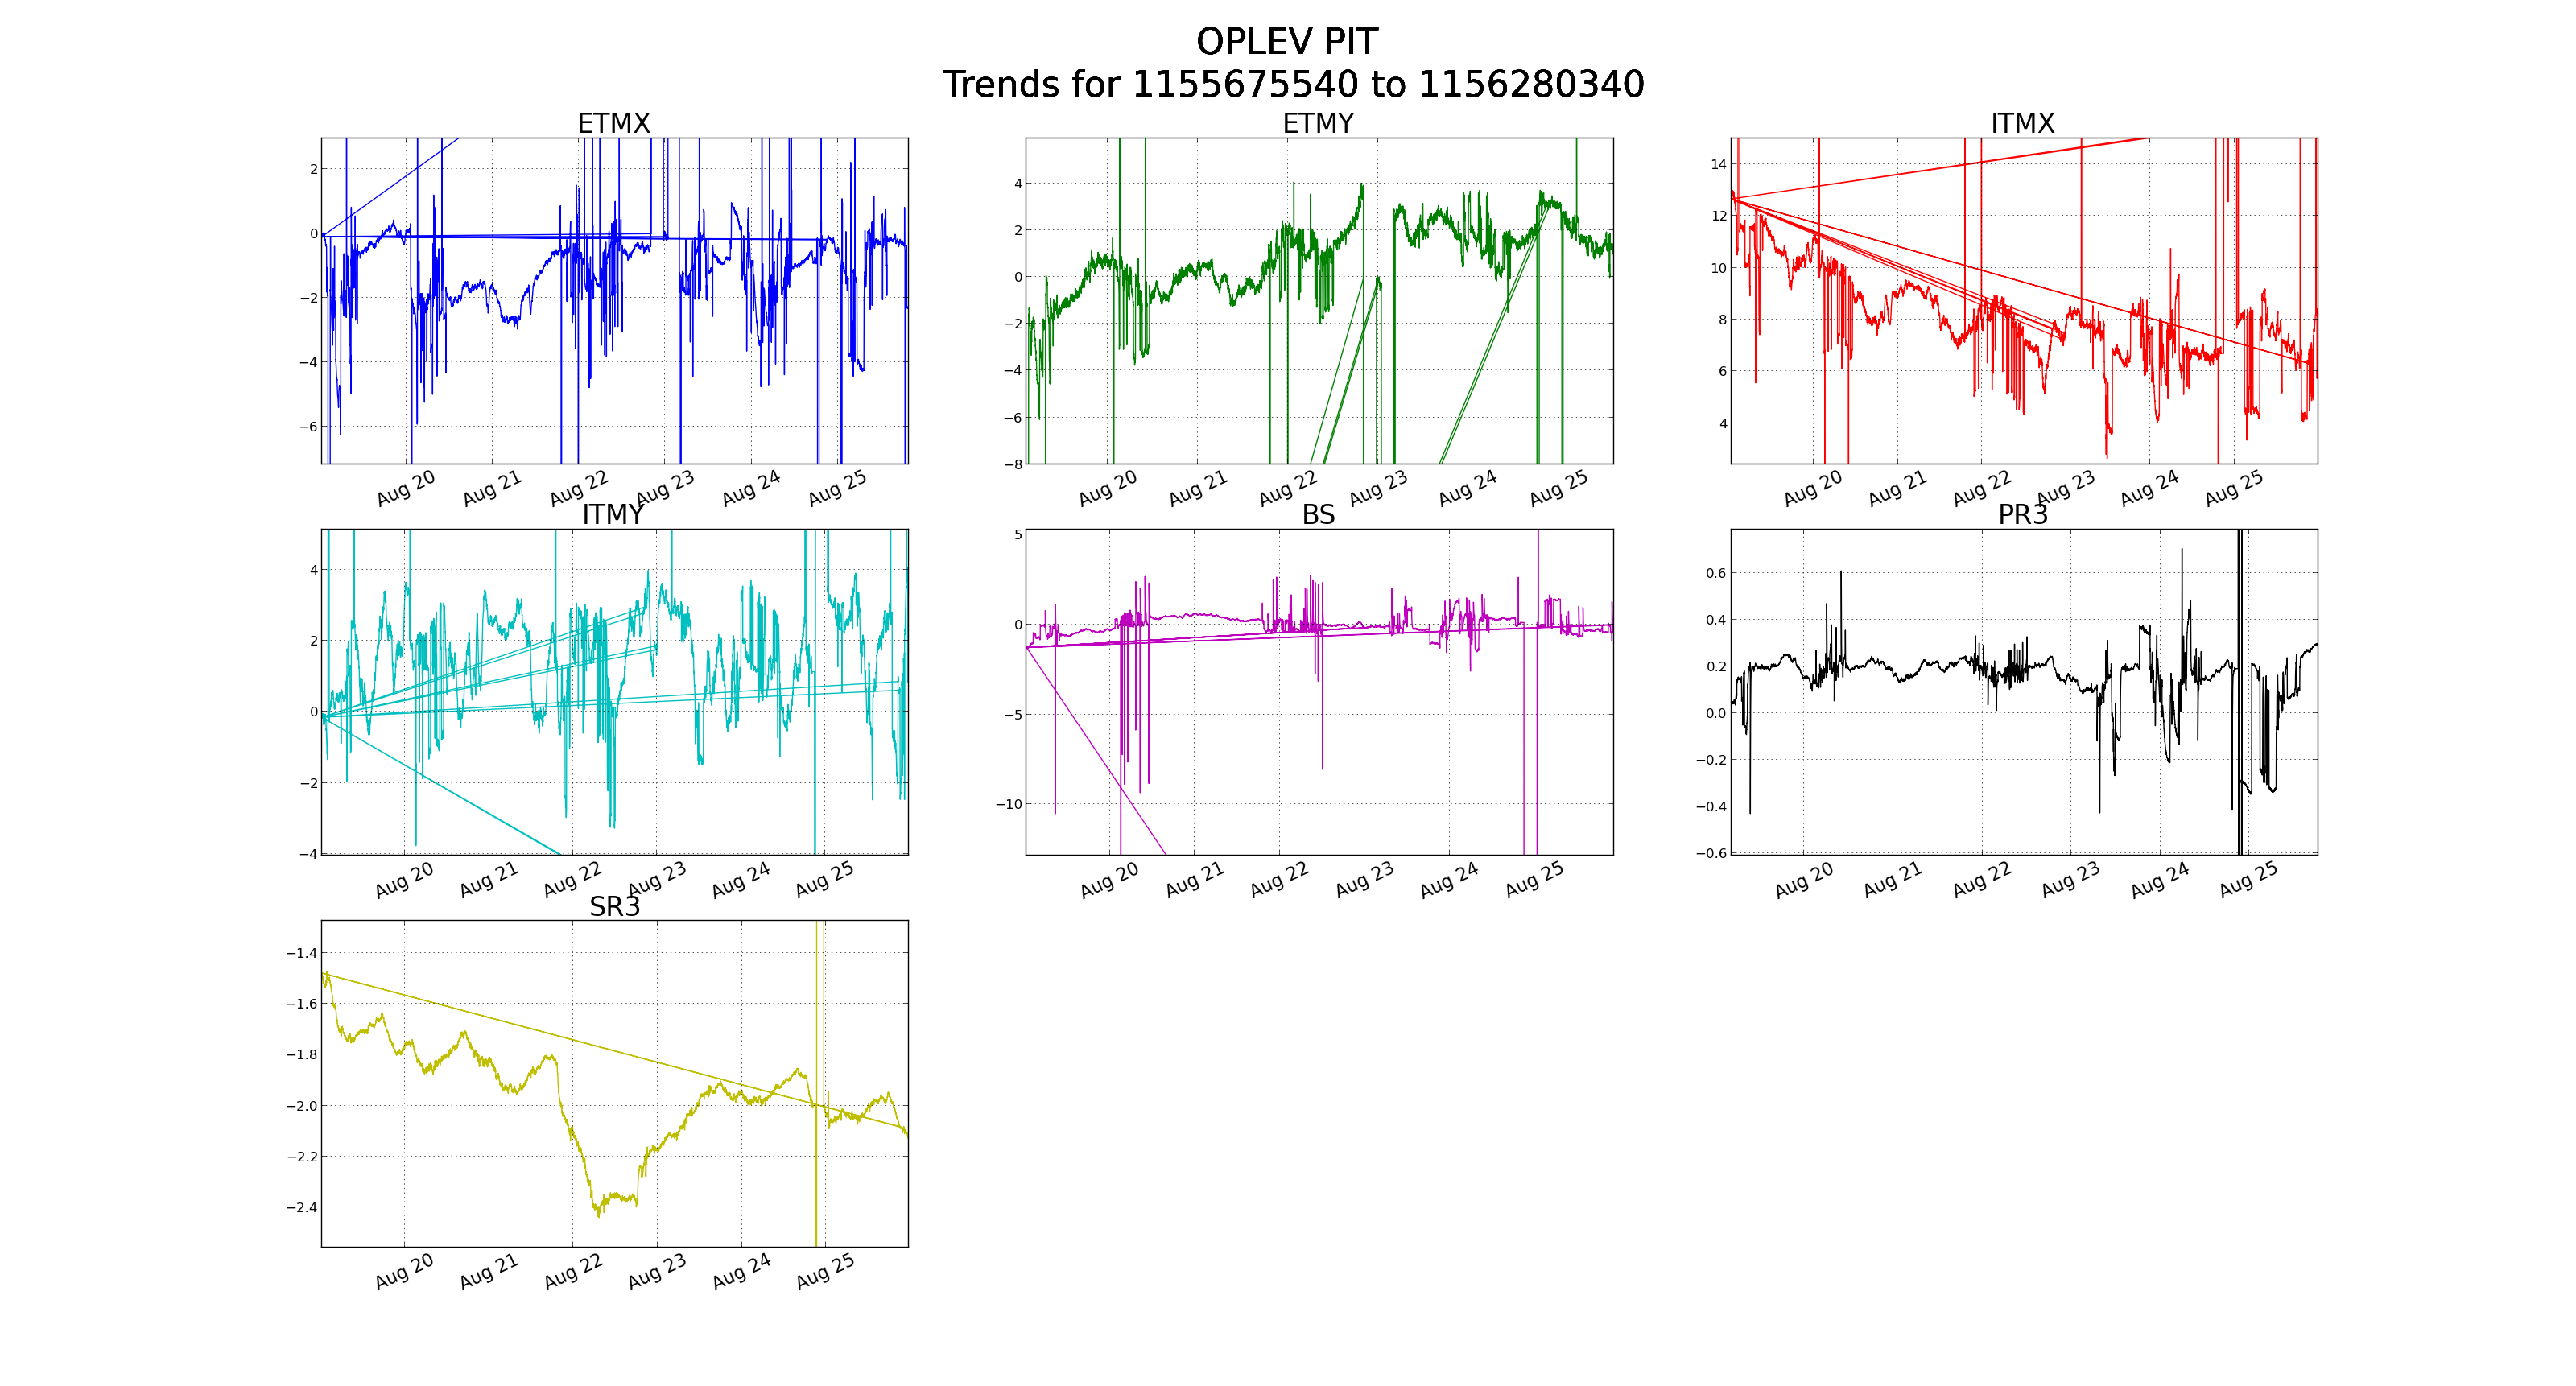
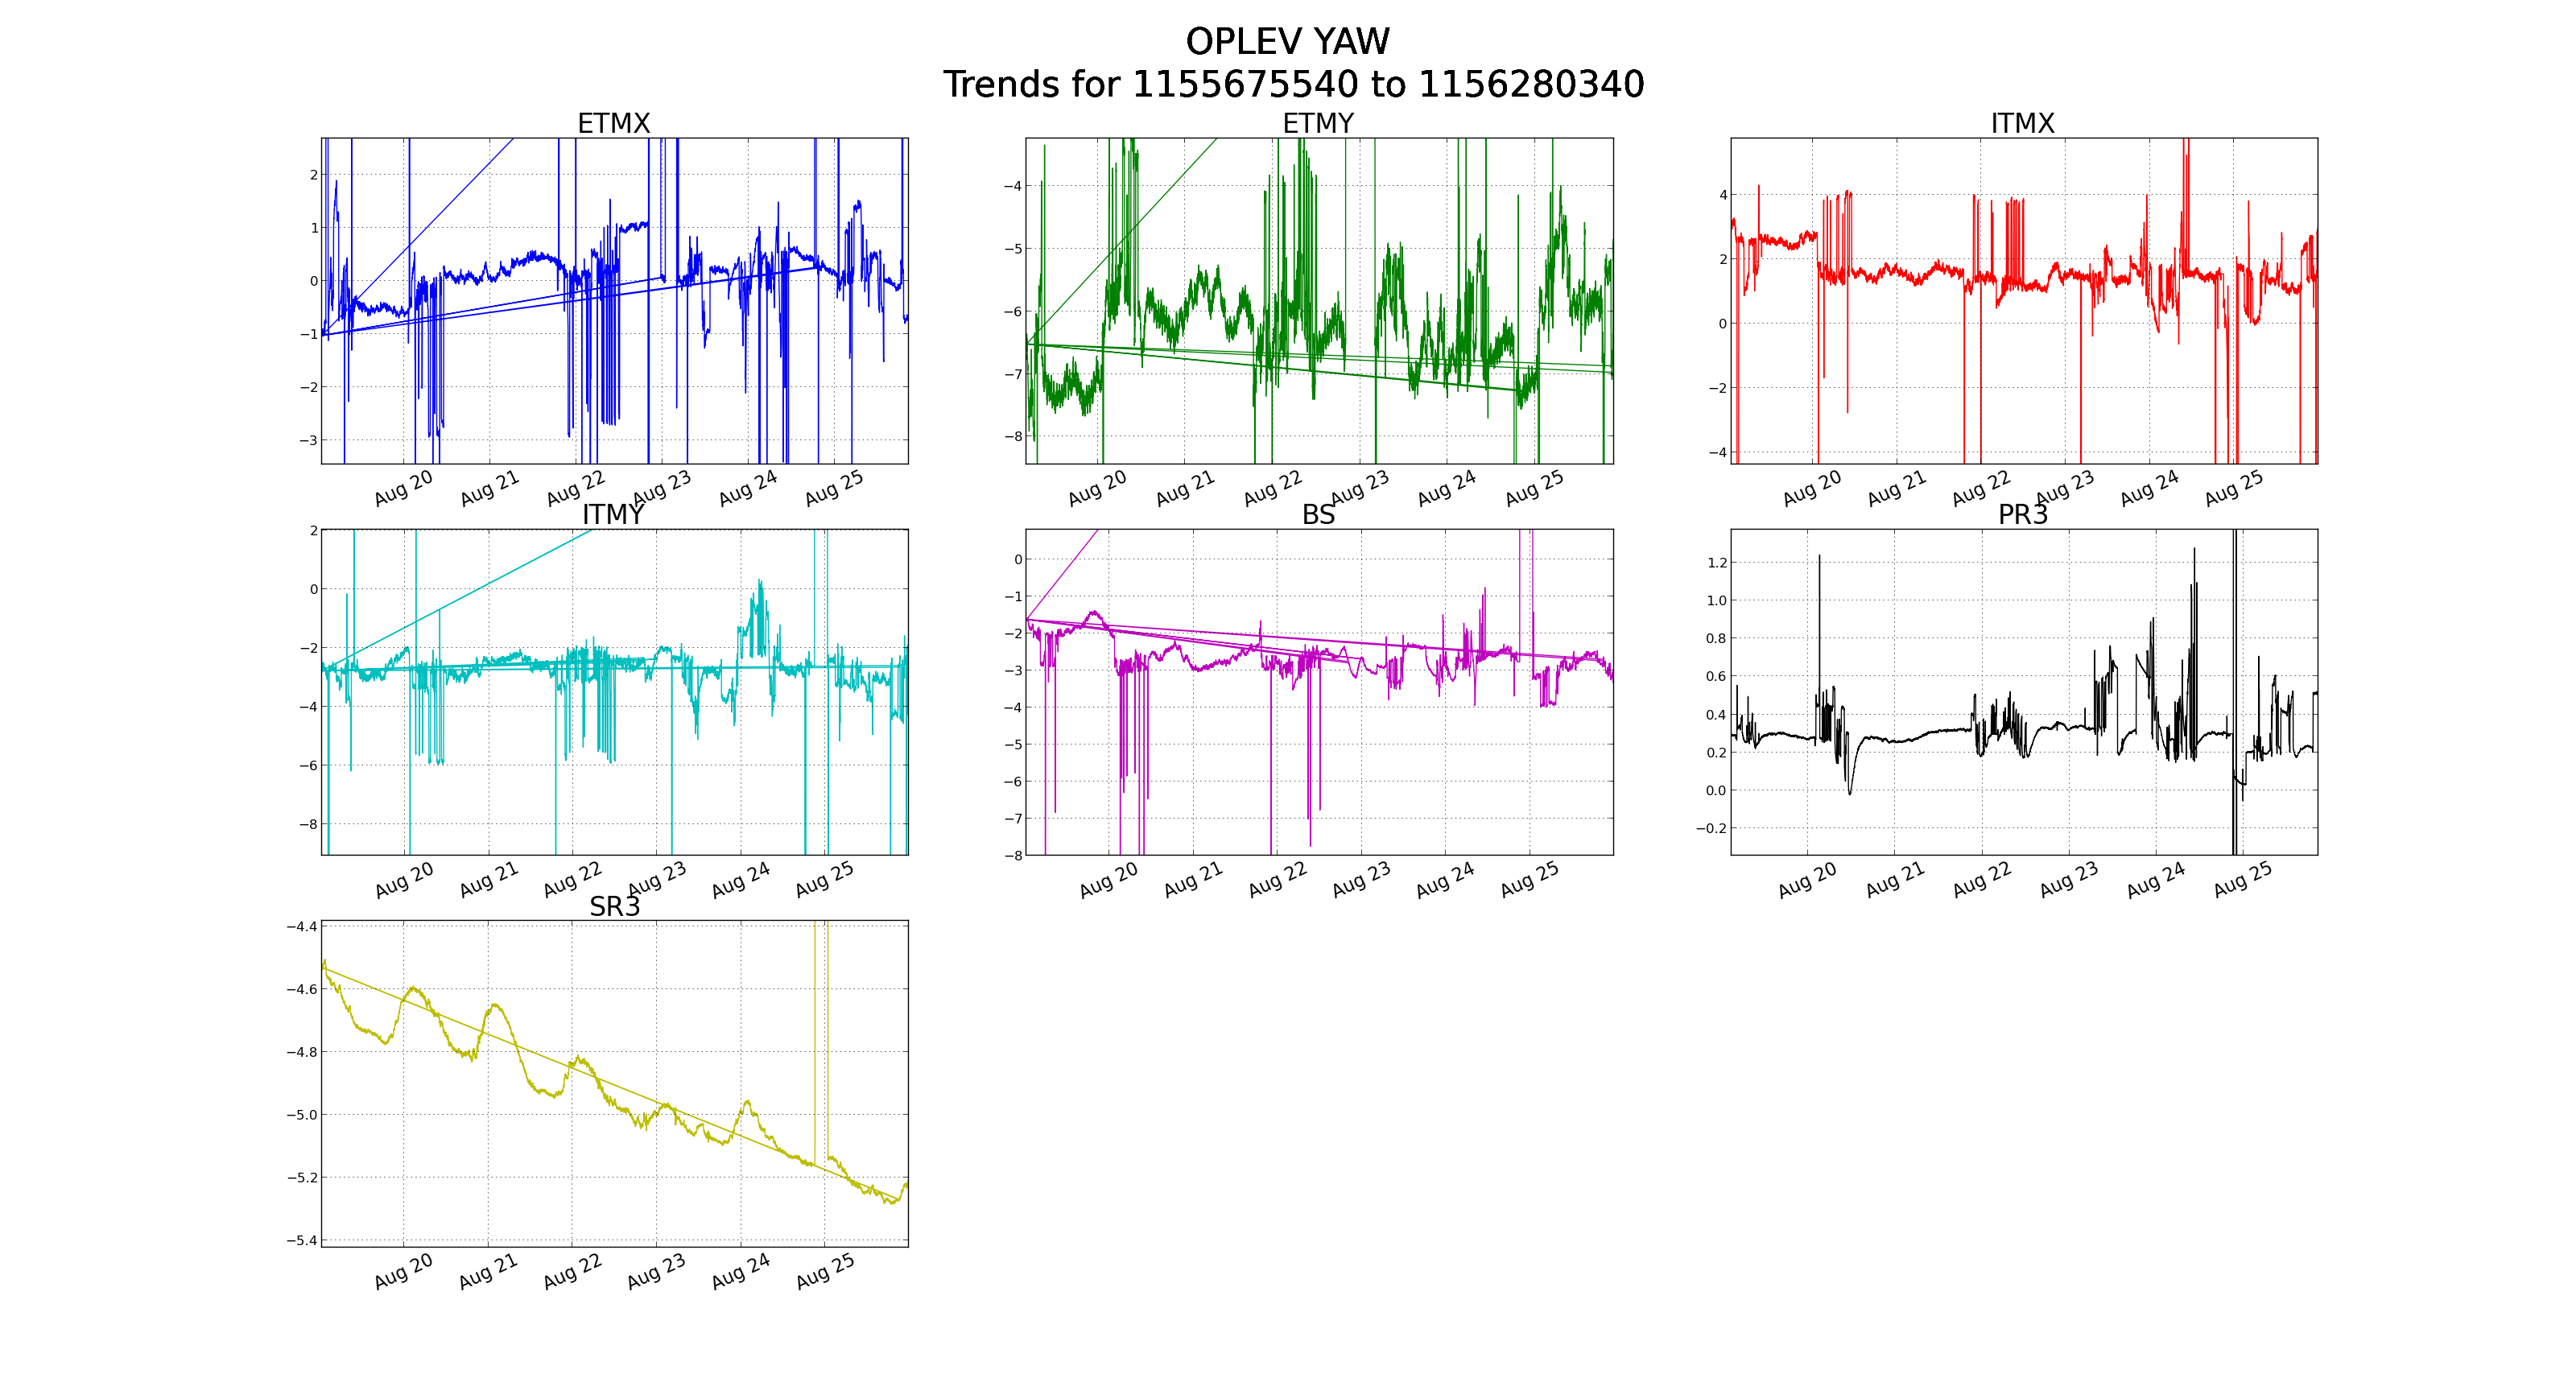
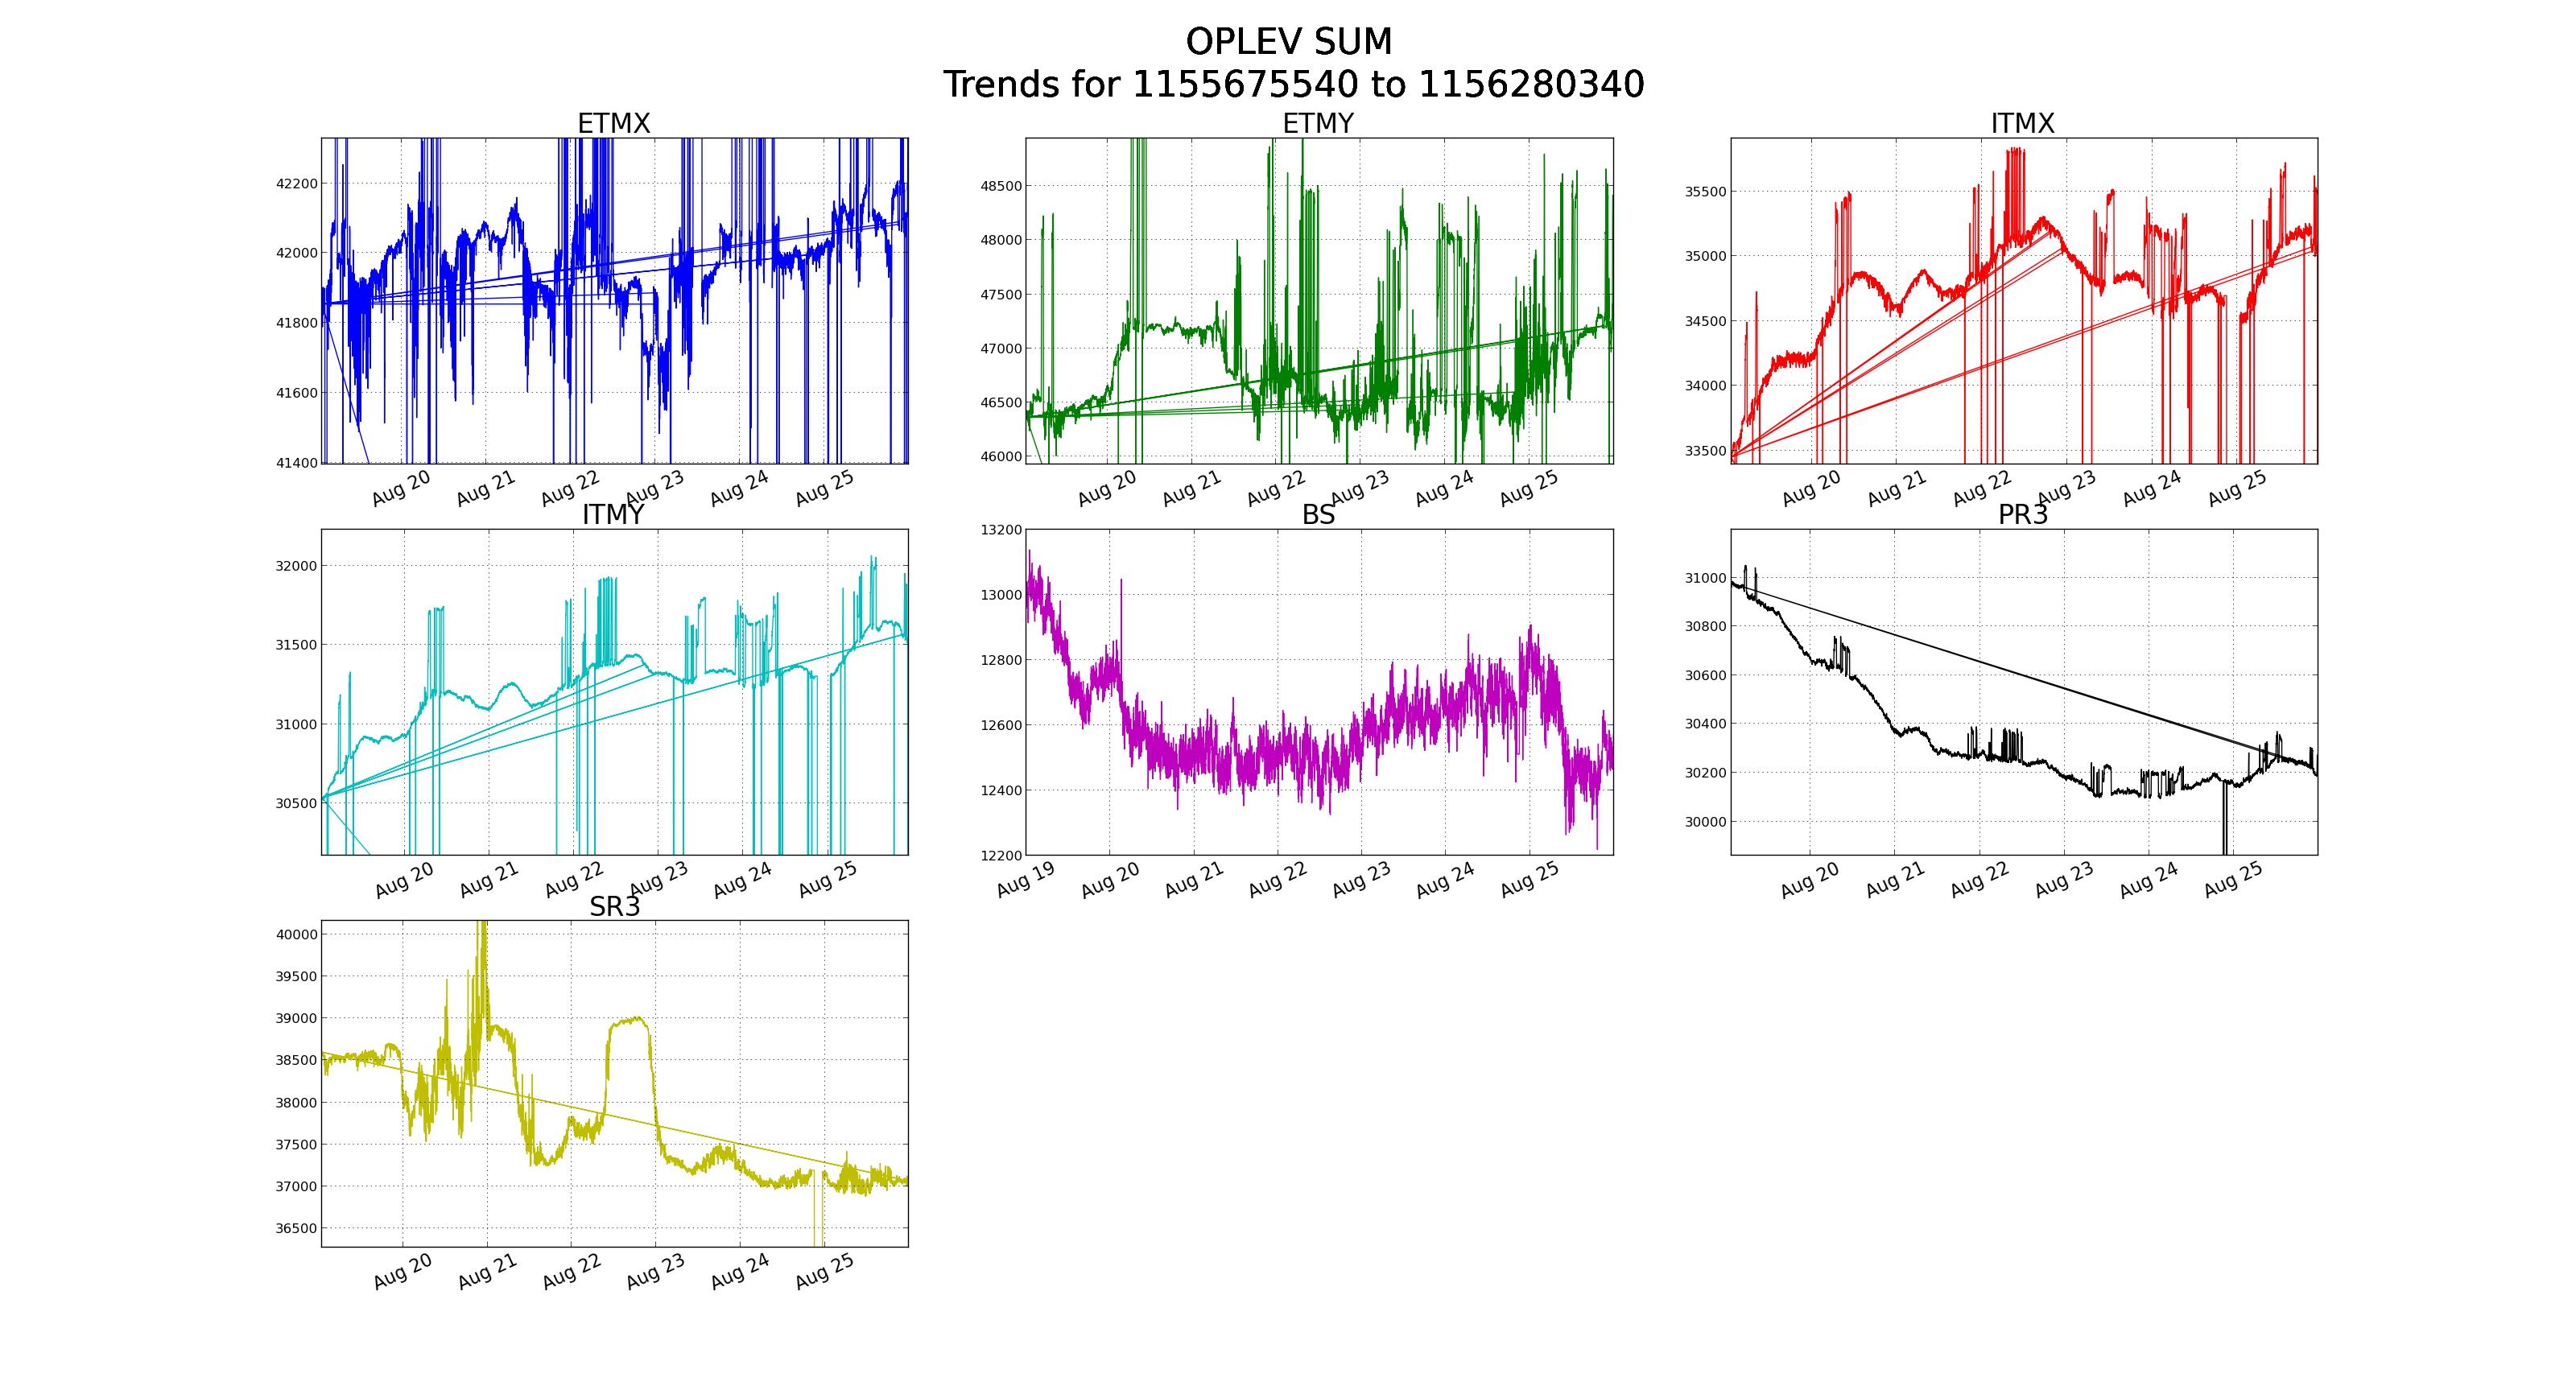
Pyplot does some strange things with the data when you zoom in, sometimes. Maybe this is a result of data gaps being handled poorly by pyplot? I've been able to get these artifacts to go away by resetting the plots and zooming in slightly less, but Patrick and I weren't able to get these particular ones to clean up. I'll see if I can make this a little nicer on Monday.
It looks like using NaN to fill in the gaps in the data was not the right thing to do. Filling with POF_INF seems to eliminate the glitching in the plots. I've also set some hard coded Y-axis limits on the pit and yaw plots and scaled the sum plots to the max in each dataset, so the plots should start out closer to a finished product.
I've also added the HAM2 oplev, which doesn't have any DQ channels, so I've used the OUT16 channel. Shouldn't matter much, since the plots are of m-trends.