craig.cahillane@LIGO.ORG - posted 18:45, Saturday 27 August 2016 (29353)
ER9 Actuation Covariance (systematic errors not yet removed)
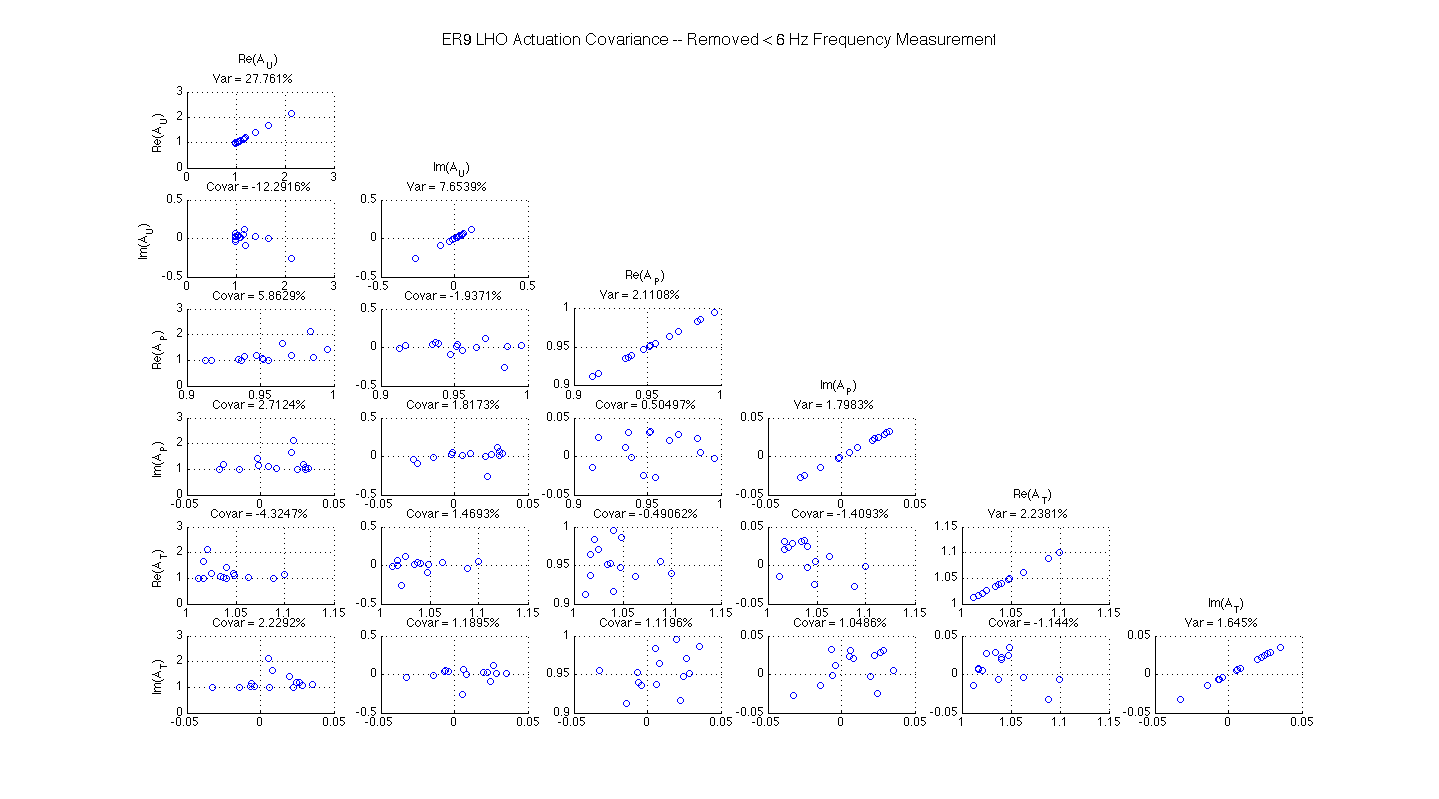
C. Cahillane I had a look at the ER9 actuation measurements vs. the new DARM model, looking for a comparison to O1 covariance values. The results are shown in the hard-to-see plot below. I cut off the frequency vectors below 6 Hz because the noise was very high and the DARM model did not fit well with the measurements there. The results indicate greatly inflated variance and covariance, but this is probably due to the lack of linear fitting. The UIM stage, for instance, is a factor of 2 off at 100 Hz again, just like in O1. This time I haven't yet removed these systematics, I'm just looking purely at measurements/DARM model For a better idea of what the covariance values mean, I have made a correlation matrix. The correlation of two variables has the following definition:cov(x,y) corr(x,y) = -------------, -1 <= corr(x,y) <= 1 std(x) std(y)So if I take the covariance matrix and divide it by the square root of its diagonal, I will end up with a correlation matrix. The covariance matrix is shown in the titles of the plot attached to this alog. The correlation matrix is shown here:Re(A_U) Im(A_U) Re(A_P) Im(A_P) Re(A_T) Im(A_T) - - Re(A_U) | 1.0000 -0.7111 0.5866 0.1474 -0.3010 0.1088 | Im(A_U) | -0.7111 1.0000 -0.2323 0.2400 0.1260 0.1124 | Re(A_P) | 0.5866 -0.2323 1.0000 0.0672 -0.0510 0.3610 | Im(A_P) | 0.1474 0.2400 0.0672 1.0000 -0.4935 0.3717 | Re(A_T) | -0.3010 0.1260 -0.0510 -0.4935 1.0000 -0.3554 | Im(A_T) | 0.1088 0.1124 0.3610 0.3717 -0.3554 1.0000 | - -The diagonal of the correlation matrix is unity, as expected. The largest correlation is between the UIM real and imaginary stage, which is to be expected since the UIM stage has a large systematic error polluting it's statistics. The other stages do not suffer from great systematic errors, and all have correlation statistics below 0.5. Once I've made the systematic error fits I'll post this matrix again in a comment for comparison.
Images attached to this report