Elli (remotely), Kiwamu
Today, I spent a few hours to get an SRC gouy phase measurement done. I was able to finish a first round of measurement.
The data will be analyzed by Elli remotely.
[The set up]
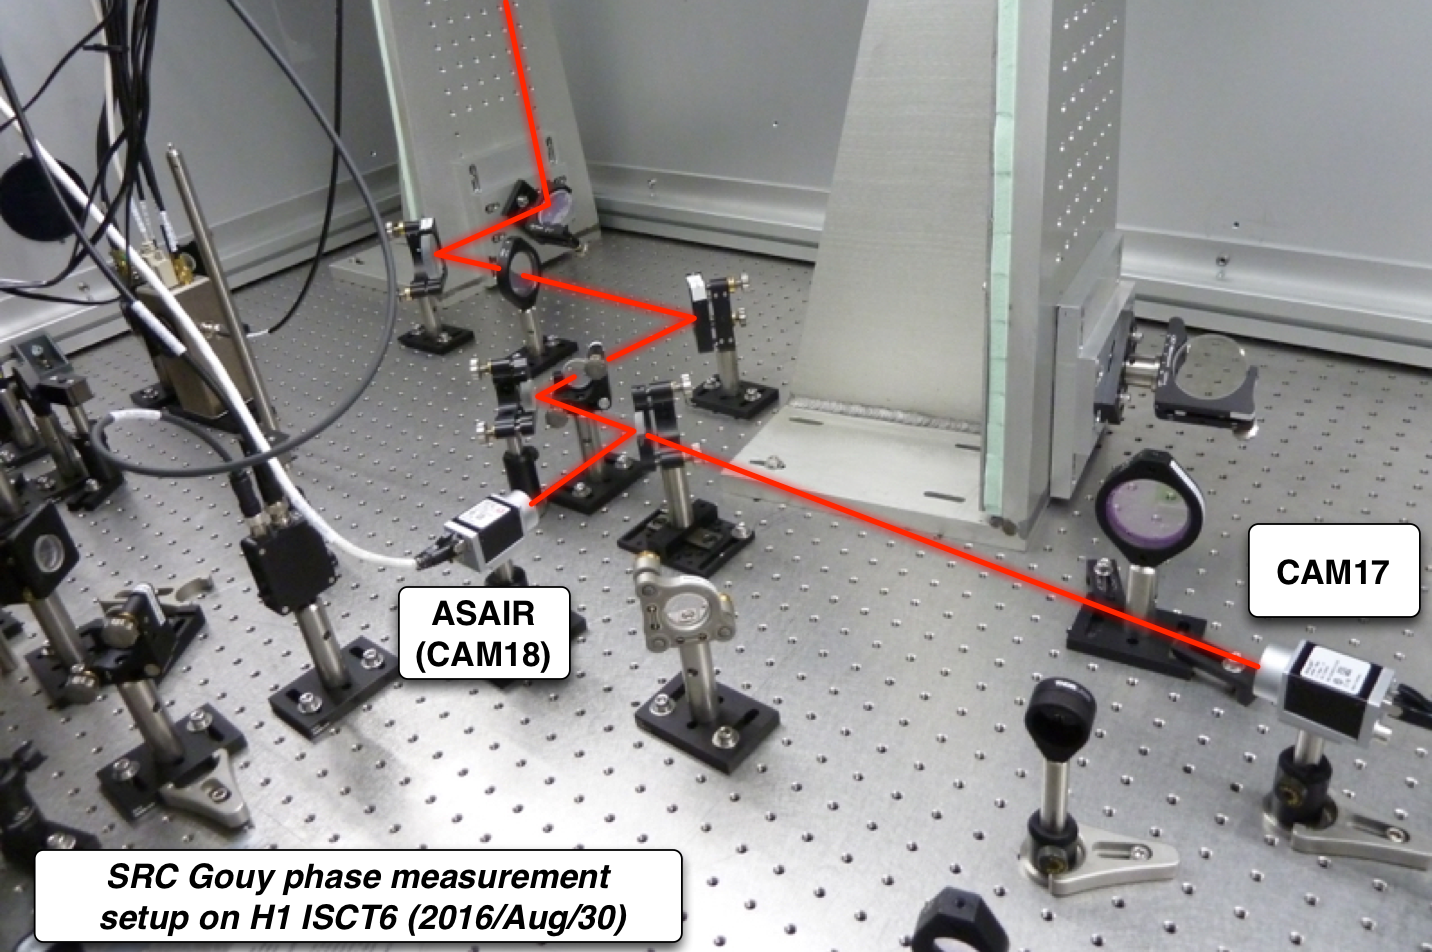
The first attachment shows a simplified layout of ISCT6 for the measurement.
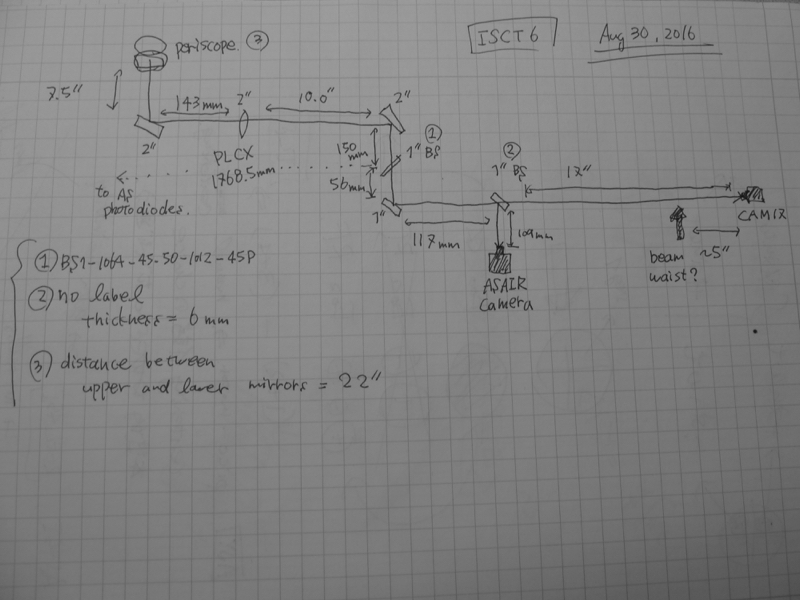
It seems that the set up have been almost unchanged except for CAM17 which seems to be further away from the beam splitter in front by a couple of inches (see previous setup in 25510). This shift could be due to the re-alignment activity that Koji and I did 20 days ago (29030). We might have shifted the CAM17 position because it was in the way of the OMC reflection path. Nevertheless, the alignment of the beam onto CAM17 was already good from the beginning and I need a slight touch on a steering mirror to get the beam centered on CAM17.
Additionally, some more pictures are available at ResouceSpace.
[The measurement]
As opposed to the previous method, the method we tried today is an AC measurement or some kind of lock-in technique where we excite an optic (e.g. BS or PR2) at a non-zero frequency. Our hope is that it is going to get rid of undesired effects from slow drift of suspensions' alignment.
Laser power into IMC = 25 W
IFO configuration = single bounce with ITMY aligned (i.e. ITMX misaligned)
CO2Y = 287 mW
ITMY ring heater = 0.5 W (0.25 W for upper and lower segments each)
- The first measurement
Started at 18:10:42 UTC (Aug/30/2016)
Ended at 18:20:42 UTC (Aug/30/2016)
Excitation to SUS-BS_M1_OPTICALIGN_Y_EXC
Frequency 0.2 Hz
Excitation amplitude 5 urad
- The second measurement
Started at 18:28:20 UTC (Aug/30/2016)
Ended at 18:38:20 UTC (Aug/30/2016)
Excitation to SUS-PR2_M1_OPTICALIGN_Y_EXC
Frequency 0.2 Hz
Excitation amplitude 20 urad
[Detailed settings]
I adjusted the exposure time so that none of the pixels saturate while keeping high intensity counts. This ended me up with an exposure time of 700 (usec, I believe) for ASAIR (CAM18). Doing the same adjustment, I set that of CAM17 to 1000 usec. Also the followings are the camera settings that I used.
-CAM18 setting
[Camera Settings]

	Camera Name = H1 AS Air (h1cam18)

	maxX = 659

	maxY = 494

	Exposure = 3000

	Analog Gain = 100

	Auto Exposure Minimum = 150

	Name Overlay = True

	Time Overlay = True

	Calculation Overlay = True

	Do Calculations = True

	Auto Exposure = False

	Calculation Noise Floor = 25

	Snapshot Directory Path = /ligo/data/camera

	Frame Type = Mono12

	Number of Snapshots = 1

	Archive Image Minute Interval = 0

	Archive Image Directory = /ligo/data/camera/archive/


	[No Reload Camera Settings]

	Base Channel Name = H1:VID-CAM18

	Camera IP = 10.106.0.38

	Multicast Group = 239.192.106.38

	Multicast Port = 5004

	Height = 480

	Width = 640

	X = 0

	Y = 0
- CAM17 settings
[Camera Settings]

	Camera Name = (h1cam17)

	maxX = 659

	maxY = 494

	Exposure = 3000

	Analog Gain = 100

	Auto Exposure Minimum = 150

	Name Overlay = True

	Time Overlay = True

	Calculation Overlay = True

	Do Calculations = True

	Auto Exposure = False

	Calculation Noise Floor = 25

	Snapshot Directory Path = /ligo/data/camera

	Frame Type = Mono12

	Number of Snapshots = 1

	Archive Image Minute Interval = 0

	Archive Image Directory = /ligo/data/camera/archive/


	[No Reload Camera Settings]

	Base Channel Name = H1:VID-CAM17

	Camera IP = 10.106.0.37

	Multicast Group = 239.192.106.37

	Multicast Port = 5004

	Height = 480

	Width = 640

	X = 0

	Y = 0
[The data]
All the data that I took can be found in kiwamu.izumi/Public/measurements/20160830_SRCgouy/data/
The relevant time series are saved with dtt and therefore they are in xml format. The camera images were recorded for each measurement and they are saved in avi format.
By the way, there was one thing I did not understand.
The beam size as seen by AS AIR was smaller than that seen by CAM17. According to a coarse beam scan with a laser card and my eyes, the waist location seems to be roughly 5 inches upfront of CAM17. This made me expect that the beam size would be larger at AS AIR, but it was not. To double-check the beam sizes, I checked the beam profile of the beams on AS AIR and CAM17 using their images. The below are the camera images.
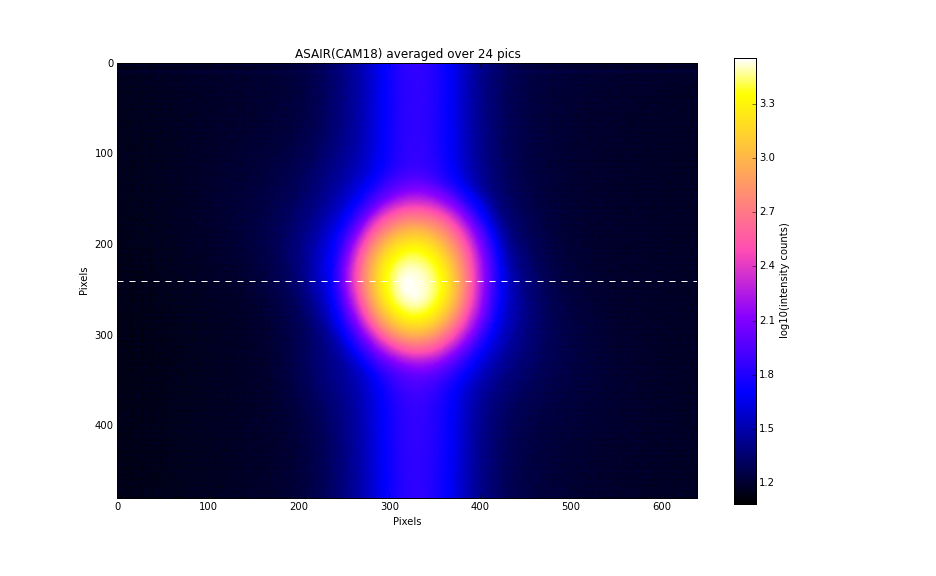
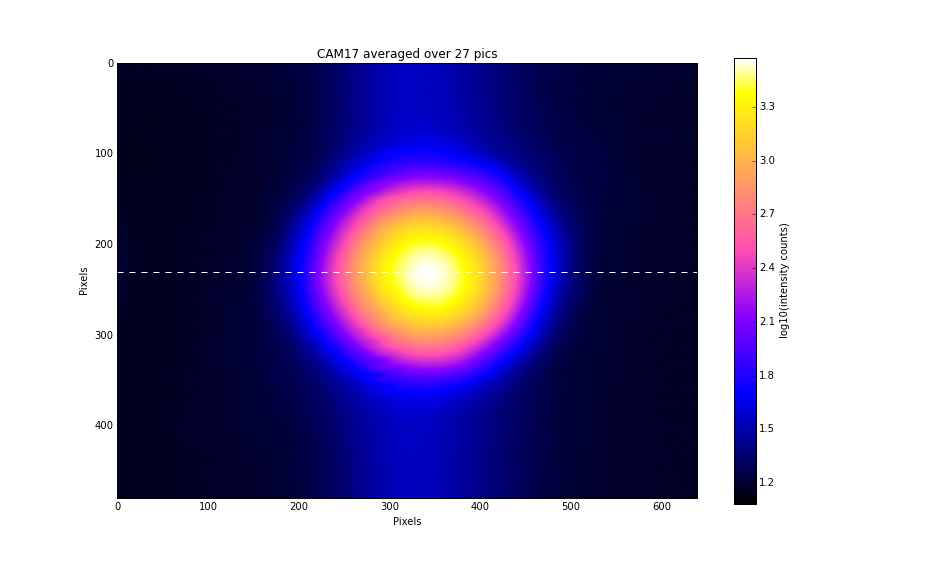
And the below are the horizontal profile of the above images (along the white dashed line).
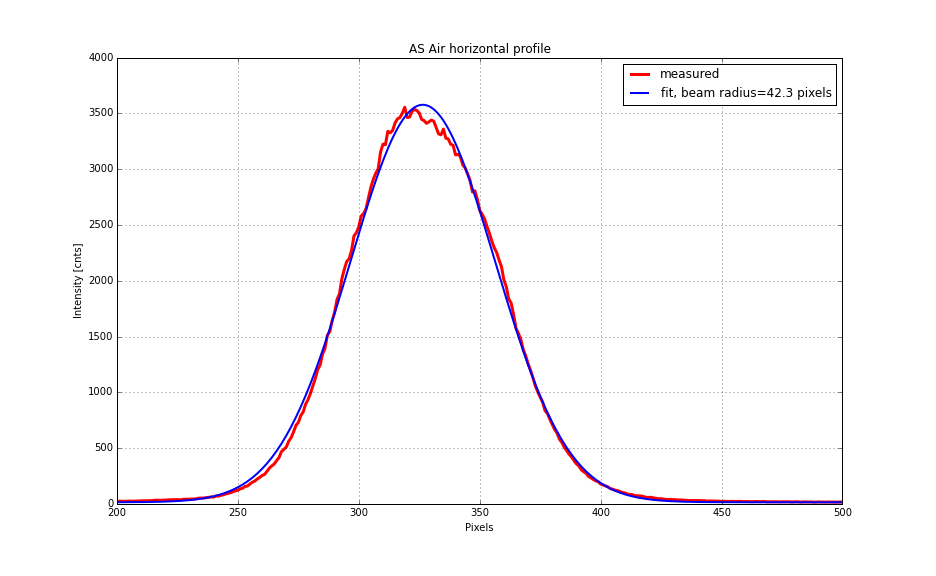
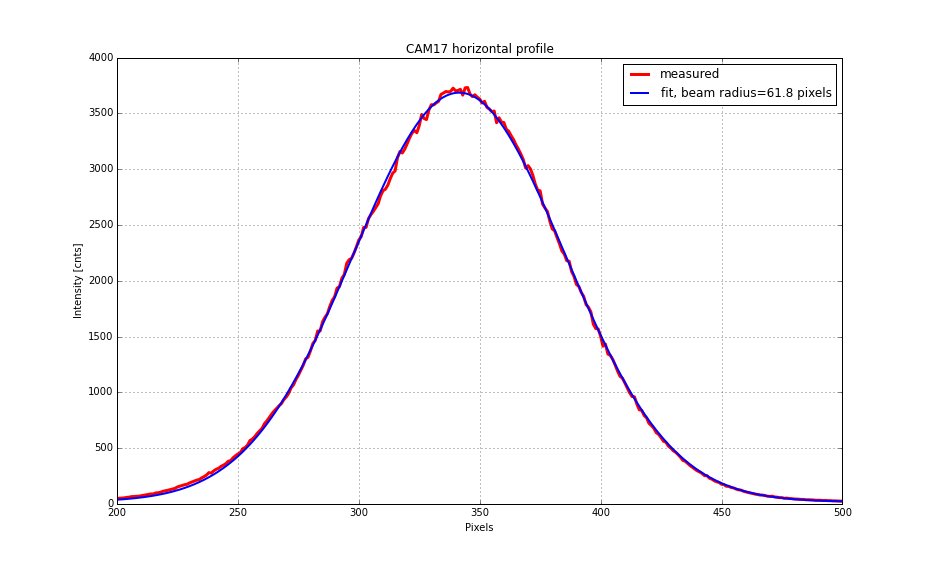
According to my Gaussian fit, the beam radius on AS AIR is 43 pixels while the one on CAM17 is 62 pixels. So indeed the beam size on AS AIR is larger than CAM17 for some reason. I am not sure if this has been true in the past. Or maybe my coarse beam scan with a laser card was not precise enough.
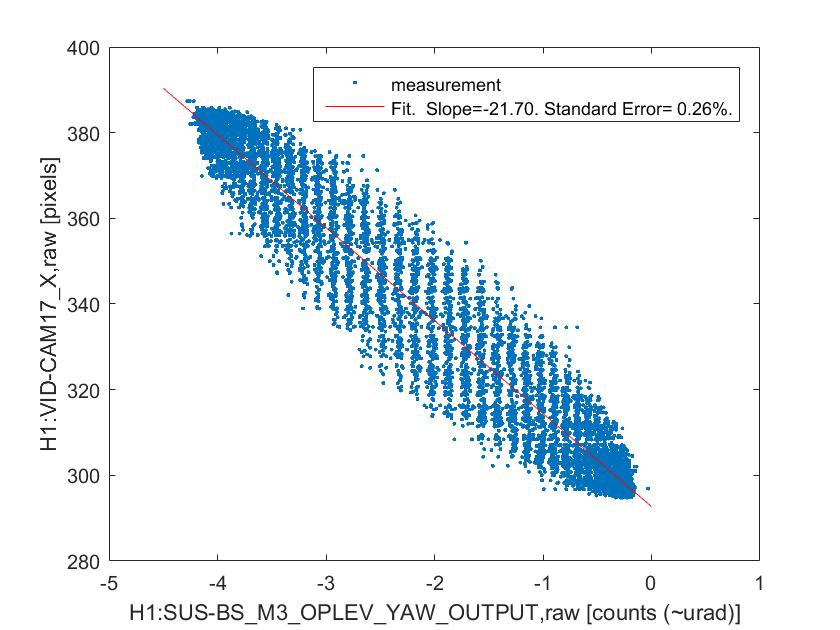
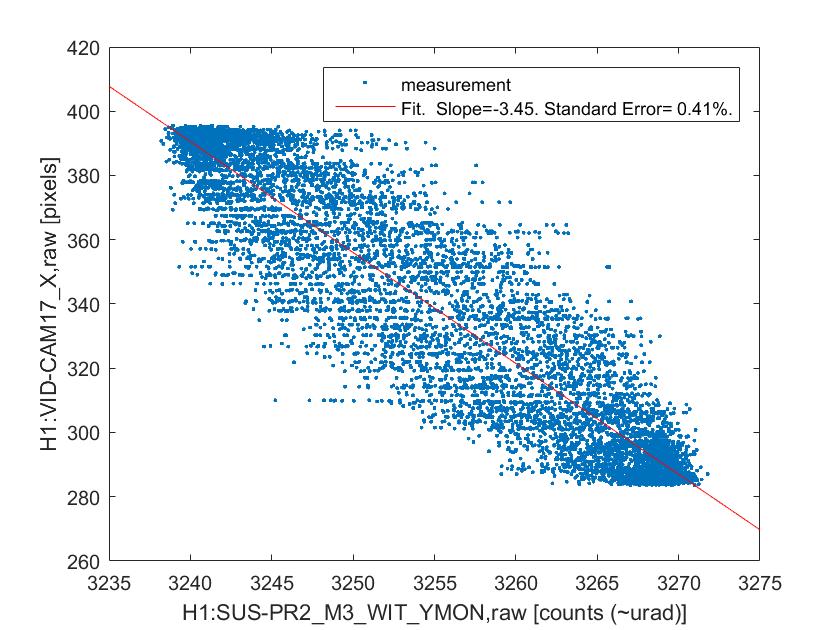
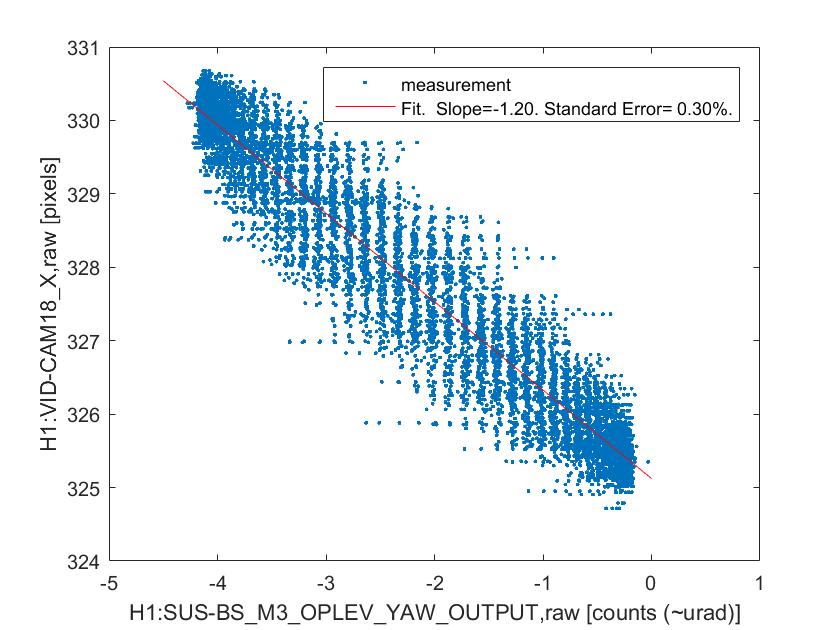
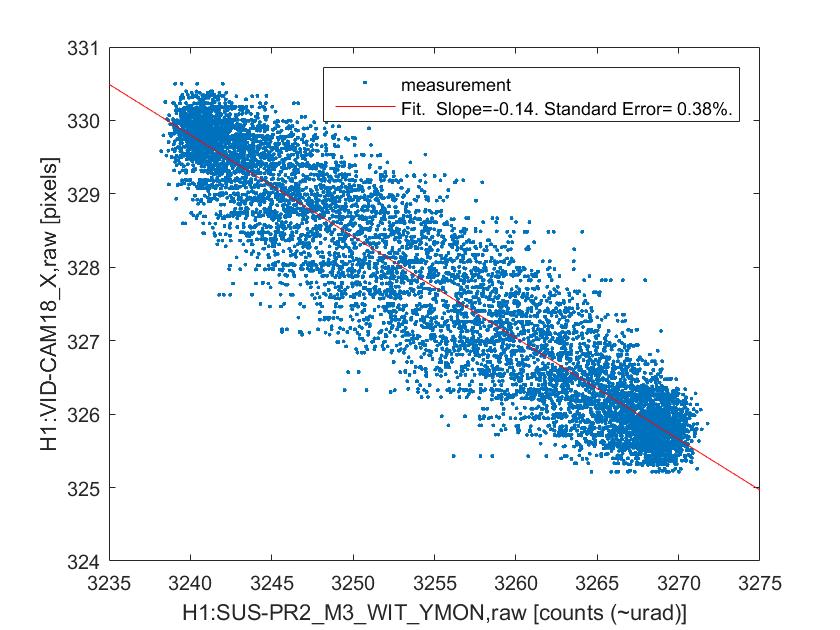
I've made some time domain plots of camera centroid location vs optic location. The camera centroid is calculated across the entire image, we can improve this by fitting a gaussian beam to the images. The optic location is the oplev readout for the BS exitation, and the M3 witness sensor for the PR2 excitation. Ive fit a linear fit to these plots, and calculated an error on the slope from the covariance matrix, see attached. I really should have done this analysis in the frequency domain for better signal-to-nosie, so I'll follow this up.
This measurement looked at spot motion on IST6 cameras for a straight shot through the SRC. We need a second measurement of the spot motion of the beam that has made a round trip of the SRC, and then we can calculate the SRC gouy phase. The errors on this first part of the measurement indicate we should be able to measure the gouy phase to +/-10deg (and with further data processing I think we can reduce these errors a bit), which could let us know if the gouy phase is way off the design value. Looking at the quality of this data, I think it is worthwhile doing the follow-up measurement.
That said, there are a few things about these plots I don't understand. FIrstly there is a lot of scatter for what I was expecting to be a linear relationship, what is going on there? Secondly, two of the graphs cam18BS and cam17PR2 have these sharp edges like some clipping was going on. Maybe this would be removed by using fitting rather than the image centroid to track the location of the beam?