jeffrey.kissel@LIGO.ORG - posted 14:47, Wednesday 31 August 2016 (29416)
Investigating TMSX LF & RT OSEM Gain Loss
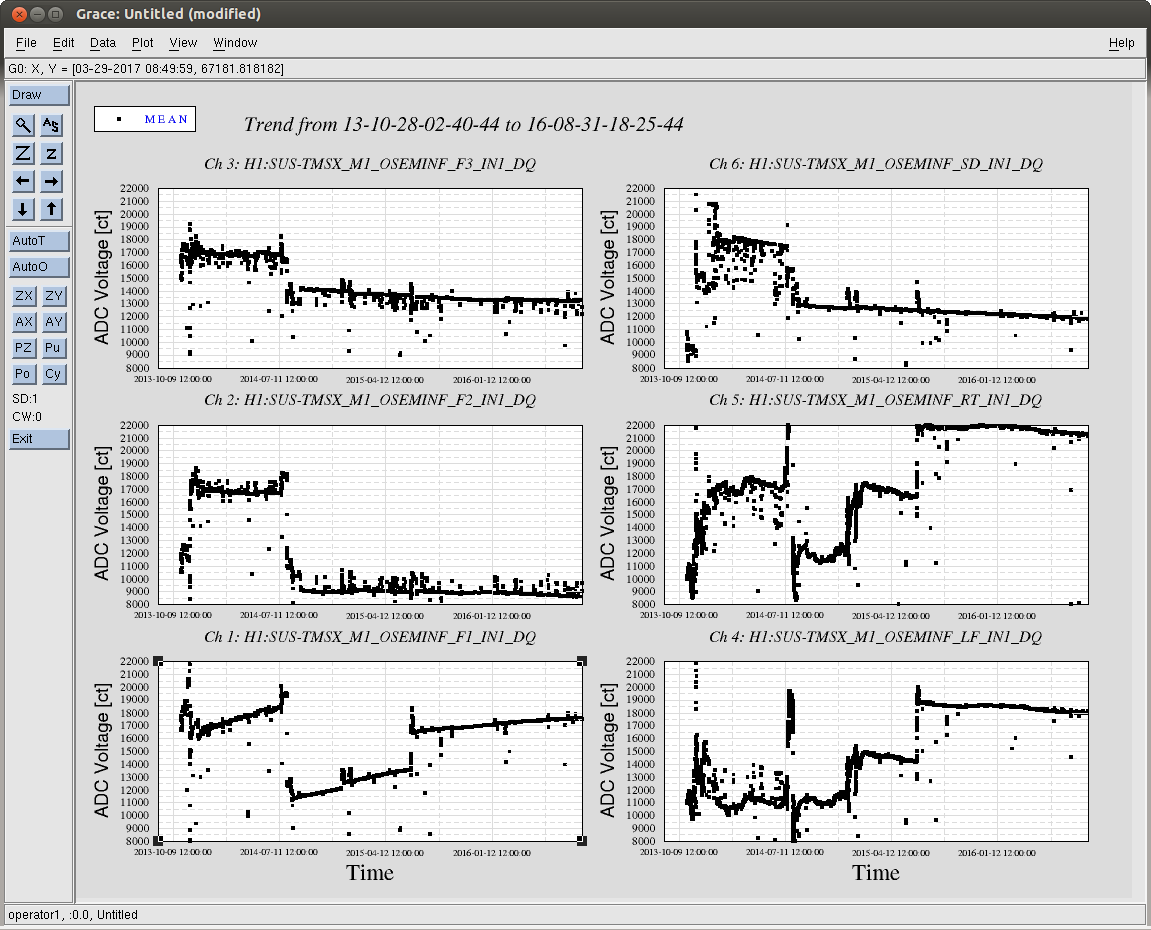
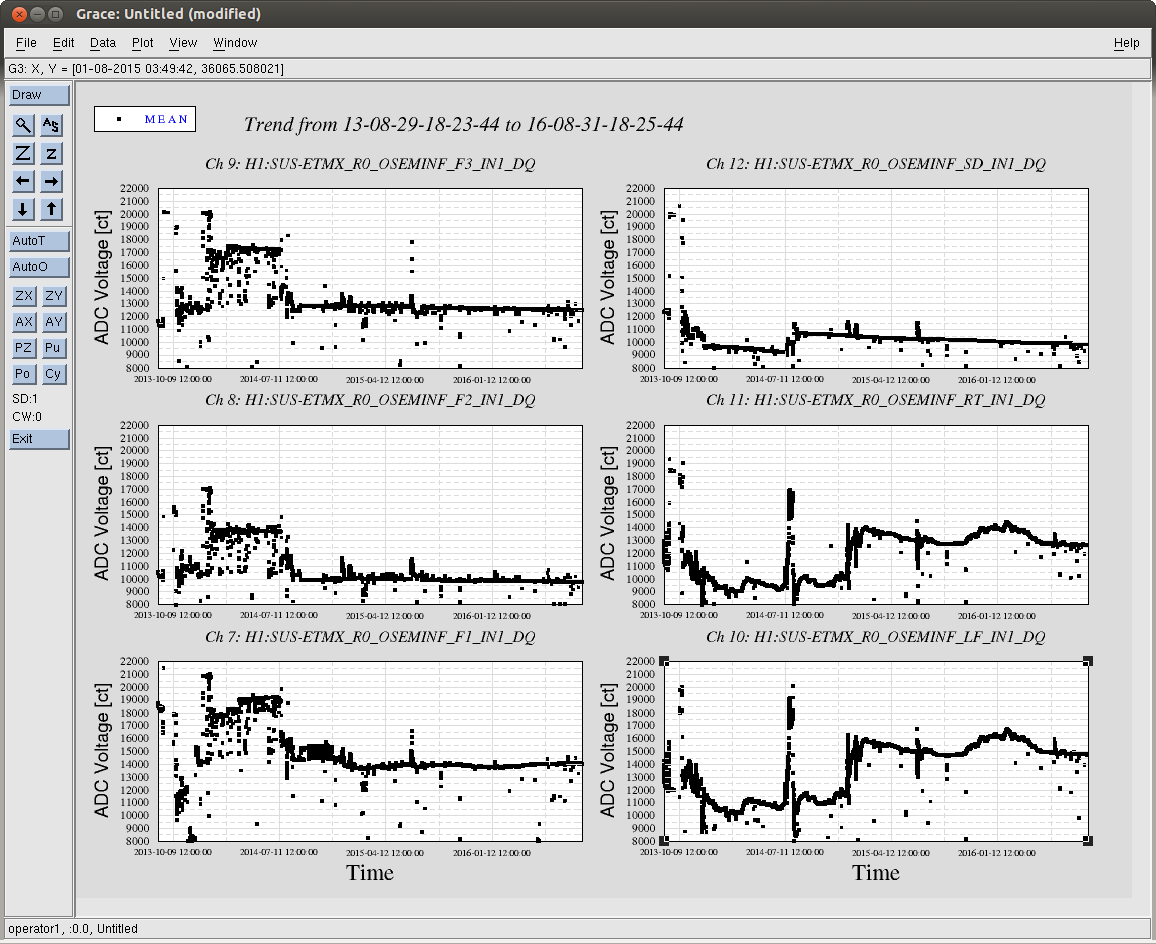
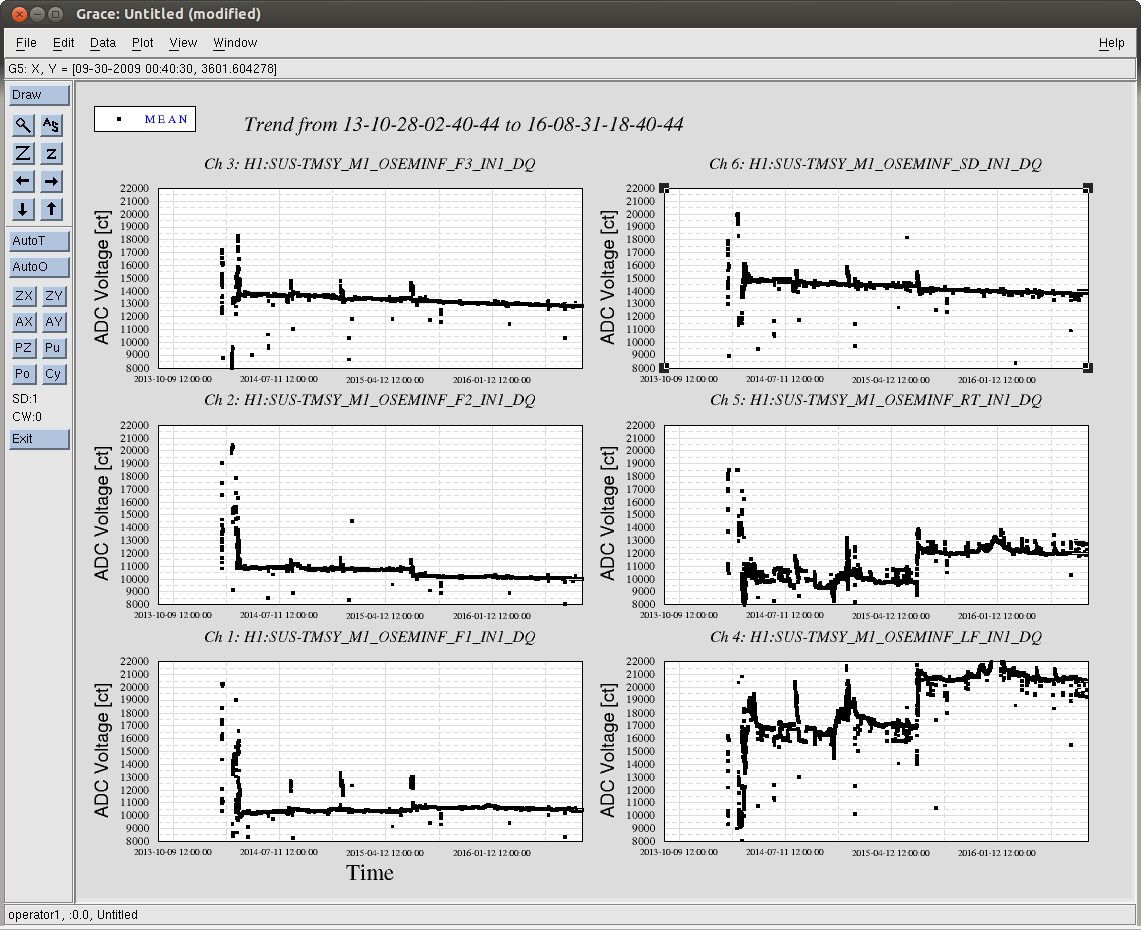
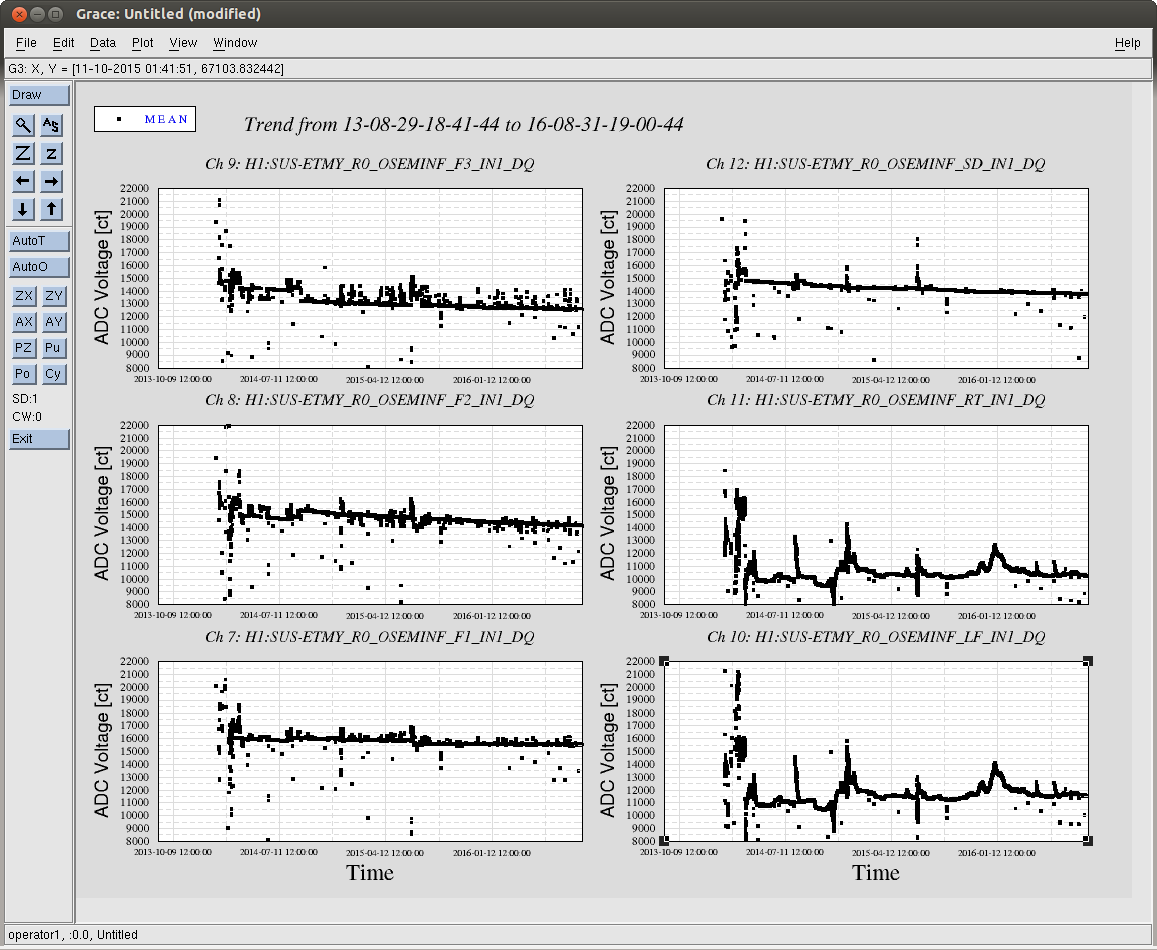
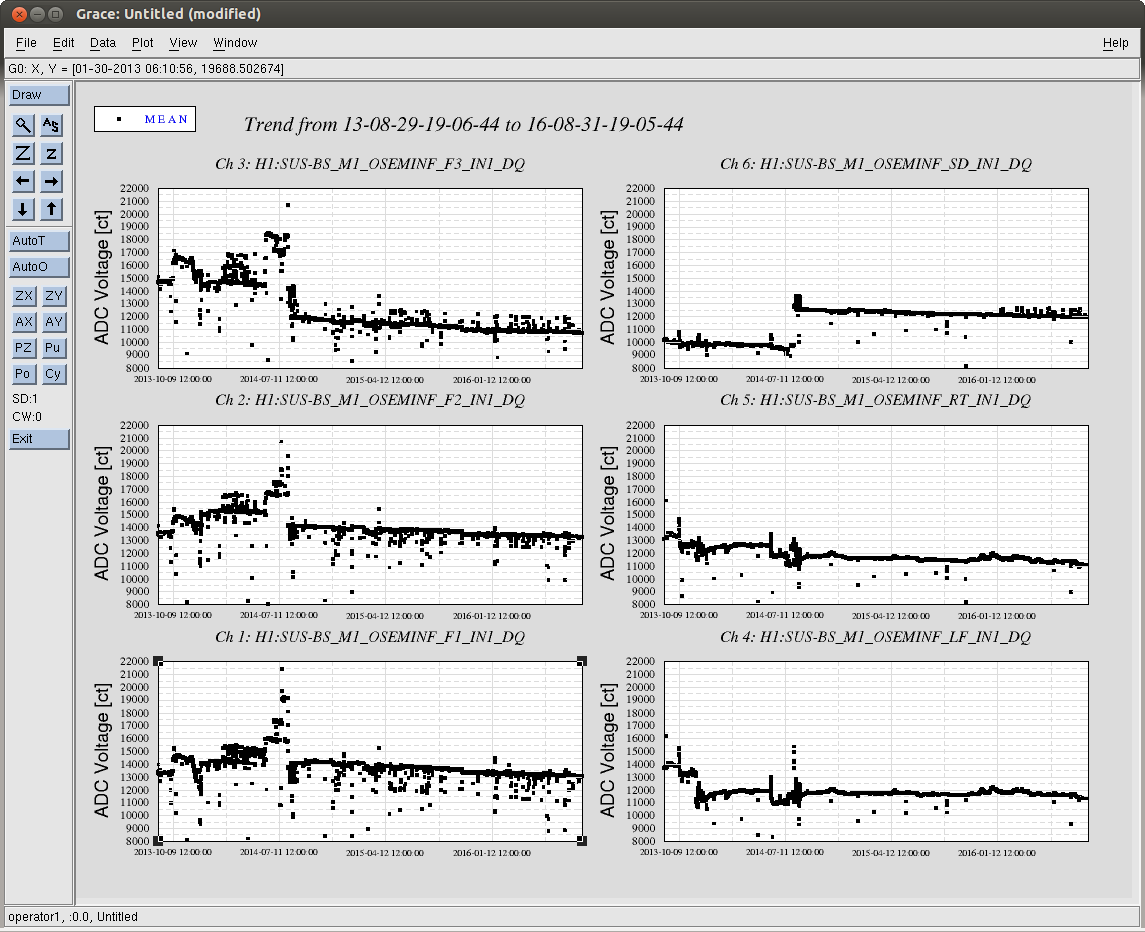
J. Kissel

While perusing the list of FRS tickets / Integration issues that had been opened and related to me, I found an old issue -- now FRS #3246 -- that cites LHO aLOG 19208. The story from that aLOG : after the vent in the summer of 2015, the LF & RT OSEM signal chains had shown a factor of a few less gain than their values prior to the vent.

I was tempted to close the issue, claiming the cop out "well, we detected gravitational waves with TMSX like this..." but there happened to be some time this morning, where then end stations were free. Also, given the typical-forgetten-about state of the TMTS, this transfer function had not been remeasured since just after the pump-down of the chamber -- not at final vacuum levels.

As such, I've remeasured the standard top-to-top transfer function of H1SUSTMSX, and found even further a drop in transfer function magnitude. The transfer functions confirm that V and P -- transfer functions show a factor of 4 drop in response from the 2014 to 2016 measurements. Additionally, and not mentioned in the original fault (although present in the 2015 transfer functions) report R also shows a drop from 2014 to 2016 of a factor 2. See first pdf  attachment (alltmtss_2016-08-31_Phase3b_H1SUSTMSY_M1_ALL_ZOOMED_TFs.pdf).

The drop in plant gain leaves the R, P and especially V DOFs with little to no damping on resonance.

Digging even further, recall that TMTS top masses (M1) are rotated 90 deg to that of the QUAD, so the DOF mapping (for the relevant DOFs in question) is
    V --> LF and RT
    R --> F1, F2, and F3
    P --> LF and RT
Since L (= SD), T, and Y (= F2 and F3) look the same, we can rule out problems with F2, F3, and SD. This leaves LF, RT, and F1 as our suspect OSEMs.

Unlike suspected before, I'm not sure if this is an external electronics chain issue. Why? Because, typically electronics chain problem show up clustered in an entire satellite amplifier or coil driver. The TMTS OSEMs are group in the typical six-osem stage fashion of F1, F2, F3, LF on one cable chain, and RT, SD on another (see pg 3 of D1002741).

I've also attached some new figures (which are standard output of the transfer function scripts, but posting them had fallen out of fashion) that compares the response in the OSEM basis to Euler basis drive. This isolates the individual sensor composition of each DOF. See the rest of the .pdf attachments (
H1SUSTMSX_M1_*.pdf), which compare the 2014 and 2016 data sets in this manner. This shows a consistent story, that
    - F1 alone (as opposed to F2 and F3) has dropped in sensitivity by a factor of 2.
    - LF has dropped in sensitivity by a factor 6, and RT has dropped by a factor of 3.

I then went on to wonder -- seeing the trend from 2014 to 2016 -- have the OSEM LEDs just slowly decayed in sensitivity over time? This launched the data viewer mining exercise for all of the attached .pngs, H1SUS${OPTIC}_${TOPSTAGE}_OSEMINF_3yr_Trend.png. These are hourly trends of the mean value for each OSEM over the past three years. I was hoping to see the H1SUSTMSX's F1, LF, and RT OSEMs showed a slow, but substantial, downward decay in raw input ADC voltage over time, with the hypothesis that this represented a slow failure of those OSEM's LEDs or PDs. Sadly, evidence from other suspensions I checked showed that a random smattering of BOSEMs scattered around all BSC SUS show either flat or a slow decay of at most ~3000 [ct]; the rest are flat in time. This drop in PD current is only about 10% of the full range (~30000 [ct]), so it cannot explain the factors of 2 to 6.

In conclusion, I've recommended that we close this ticket with the LONGTERMFIX, and open up a proper Integration Issue about it, marking it WHEN VENT, because I have a feeling this will be easier to debug when we have access to the entire signal chain. In the mean time, we can band-aid the problem by increasing the overall gain the V, R, and P damping loops by the amount of plant sensitivity that has been lost.
Images attached to this report
Non-image files attached to this report
