slawomir.gras@LIGO.ORG - posted 22:53, Tuesday 13 September 2016 (29681)
18038 Hz and 18056 Hz instabilities identification
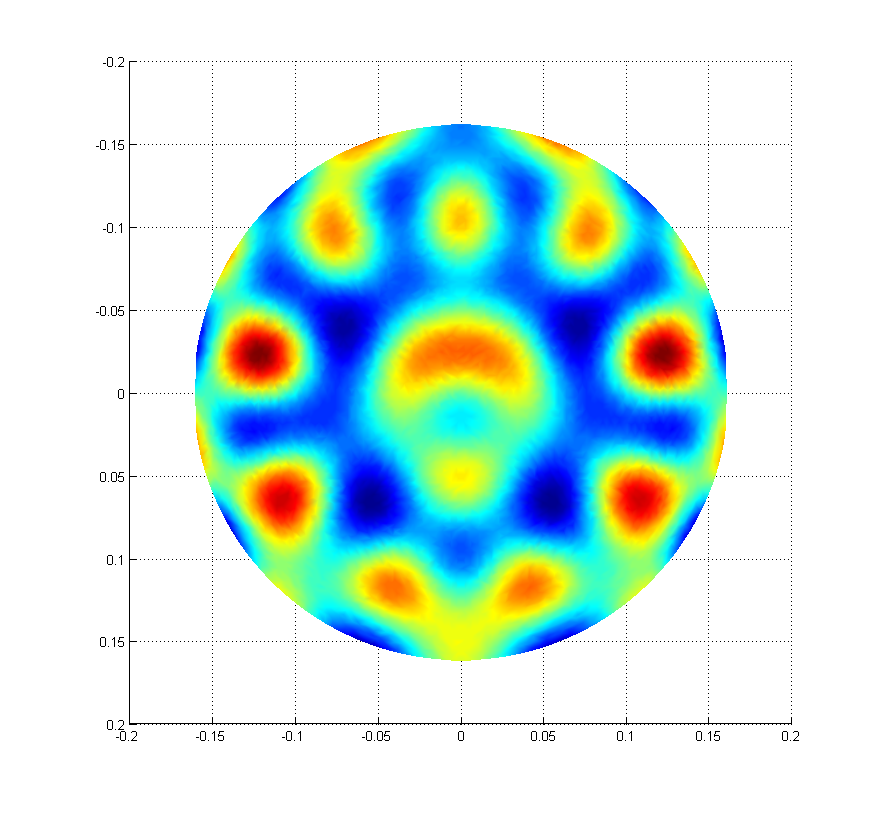
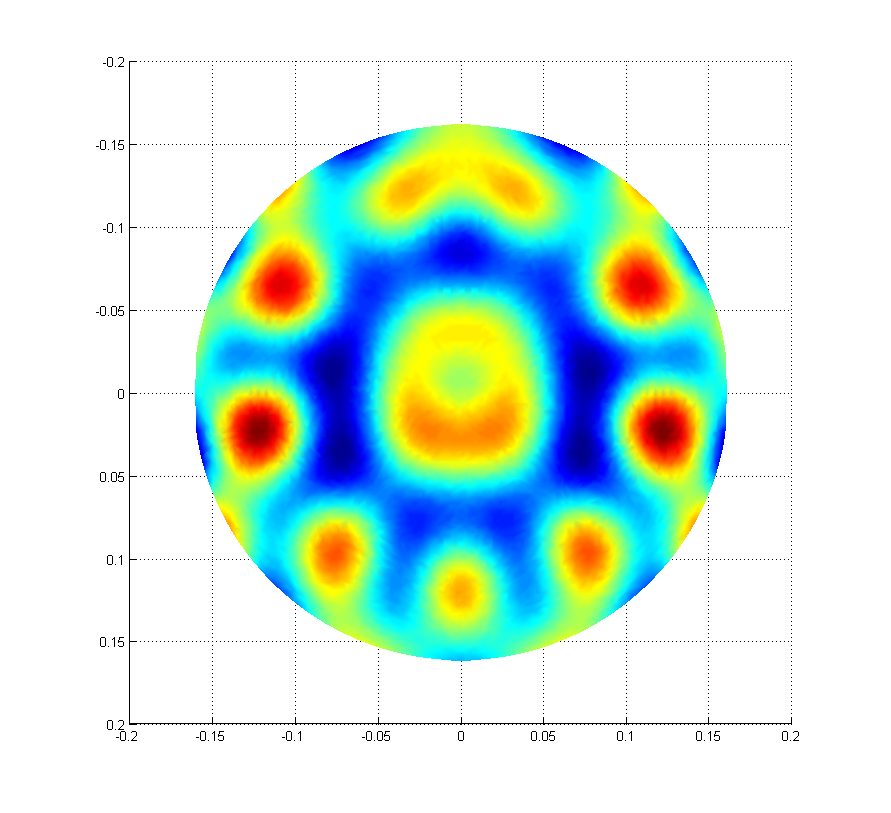
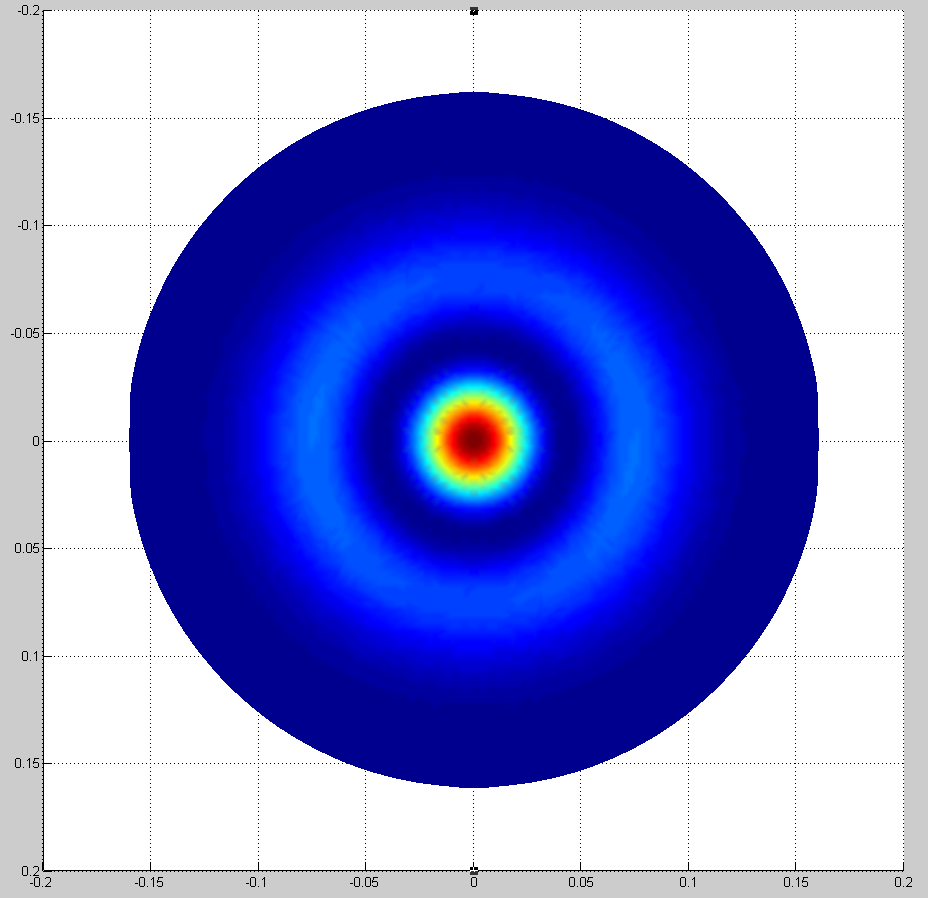
I report short analysis on 18038 Hz and 18056 Hz instabilities which  have been frequently observed on both OMC output and the arm transmission QPD.  As it’s been pointed out this instabilities most probably corresponds to the ETMY mechanical modes which are aliased from 47498Hz and  47480Hz.
In order to observed instabilities around f0 = 47.5 kHz the optomechanical interaction must involve either 2nd or 9th order optical transverse modes. (for FSR = 37.5 kHz and transverse mode spacing, TMS ~ 5.3 KHz, we get f0 ~ FSR +2*TMS kHz or f0 ~ 9*TMS kHz which is the requirement to observe instabilities). Following this argument, optical modes TEM02, TEM10, TEM17, TEM25, TEM33, TEM41 or TEM09 should be considered. I can rule out the 9th order modes since they have large diffraction losses and thus very small chance to cause instability.  According to my FEA model of ETM, there are two spider-like modes: mode #533 and mode #535  (see attachment) which have large overlapping factor with TEM10 (see figure). Computed resonant frequencies are 47454 Hz and  47469 Hz, respectively. Note, these two modes are 16 Hz apart from each other what makes them very interesting. They should ring up at the same time. The overlapping factor for mode #533 is 0.13 on ITM and 0.22 on ETM, whereas for mode #535, the overlapping factor is 0.25 and 0.39 on ITM and ETM. TEM02 gives overlapping parameter of order ~0.001 and can be ignored.
A larger beam spot size of TEM10 on ETMs is responsible for larger overlapping factor on ETMs than on ITMs.  It is expected that modes #533 and #535 of ETMs are more susceptible to instabilities than ITMs counterparts.

Estimated Q-factor for mode #533 is 22e+6 and for mode #535 is 23e+6. Q-factor was estimated based on losses due to HR coating, AR coating, silicate bond, and bulk loss of the substrate.

The last figure (Gain) on the right shows parametric gain as a function of the ETM RoC in the IFO arm where instabilities occur. To compute this figure I used nominal values for aLIGO and P_arm = 200 kW.
Images attached to this report
Non-image files attached to this report
