SudarshanK, TravisS, RickS
Yesterday, we went to Xend to assess and optimize the Pcal beam locations on the ETM surface.
Since O1, we have known that the beams were clipping somewhere on the receiving side.
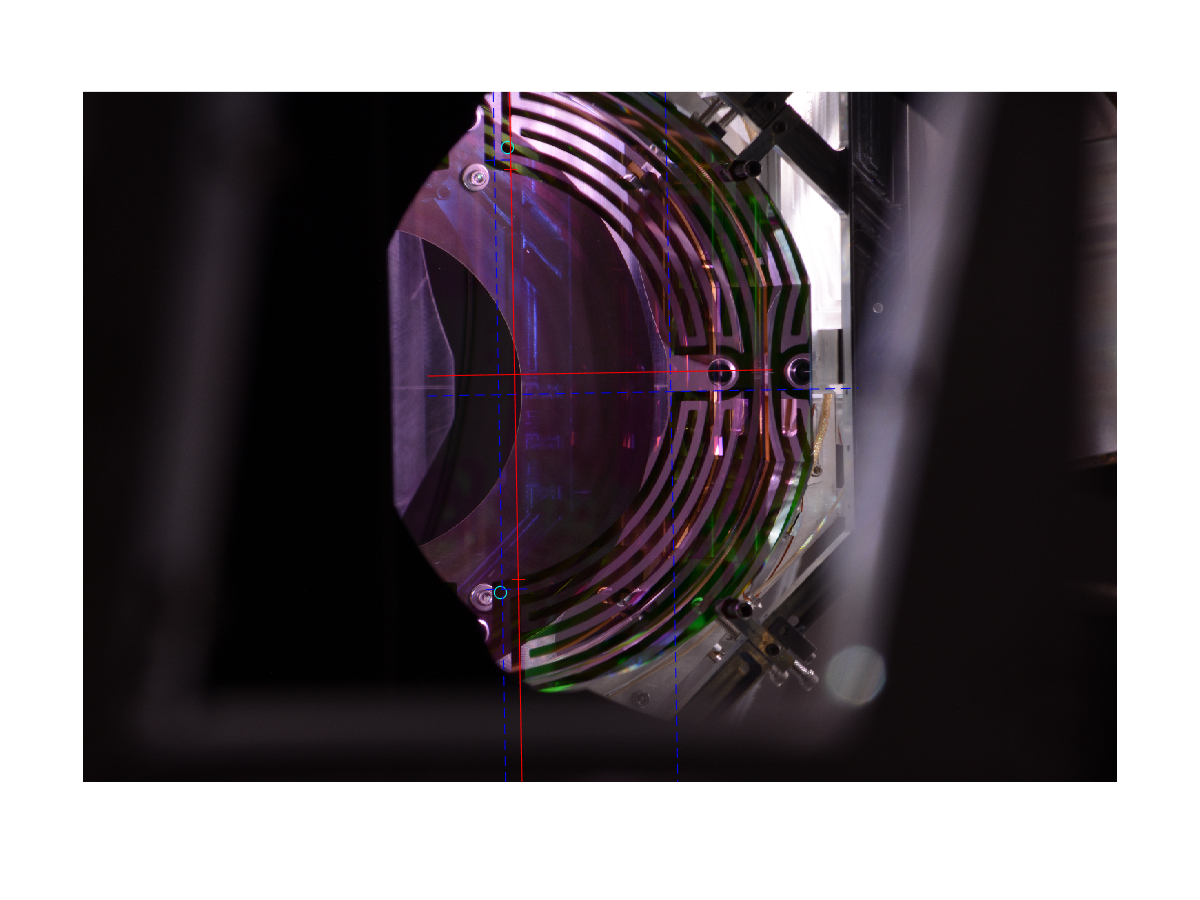
Unsing an updated method of assessing the beam locations that is based on the work that Miranda Chen (REU student from UTRGV) did this summer (basically using the ESD electrode pattern rather than the edge of the ETM) we found that the Pcal beams were quite far from their optimum locaitons (see first image attached below). The offests from the optimal locations (111.6 mm above and below the center of the face of the optic) were U [ 1.71, 12.27], L[10.02, -7.27] where U and L denote the upper and lower Pcal beams and the coordinates are [x offset, y offset] in millimeters with the usual conventions, positive x to the right, positive y up. Because we use 2" diameter optics in the Pcal periscope structure and because the receiveing-side mirrors are twice the distantance from the ETM, an offset of 12 mm at the ETM would correspond to an offset of ~24 mm at the periscope, likely the cause of the clipping we have observed. The reflected power measured by the power sensor in the receiver module increased by about 50% from about 4 V to 6.2 V.
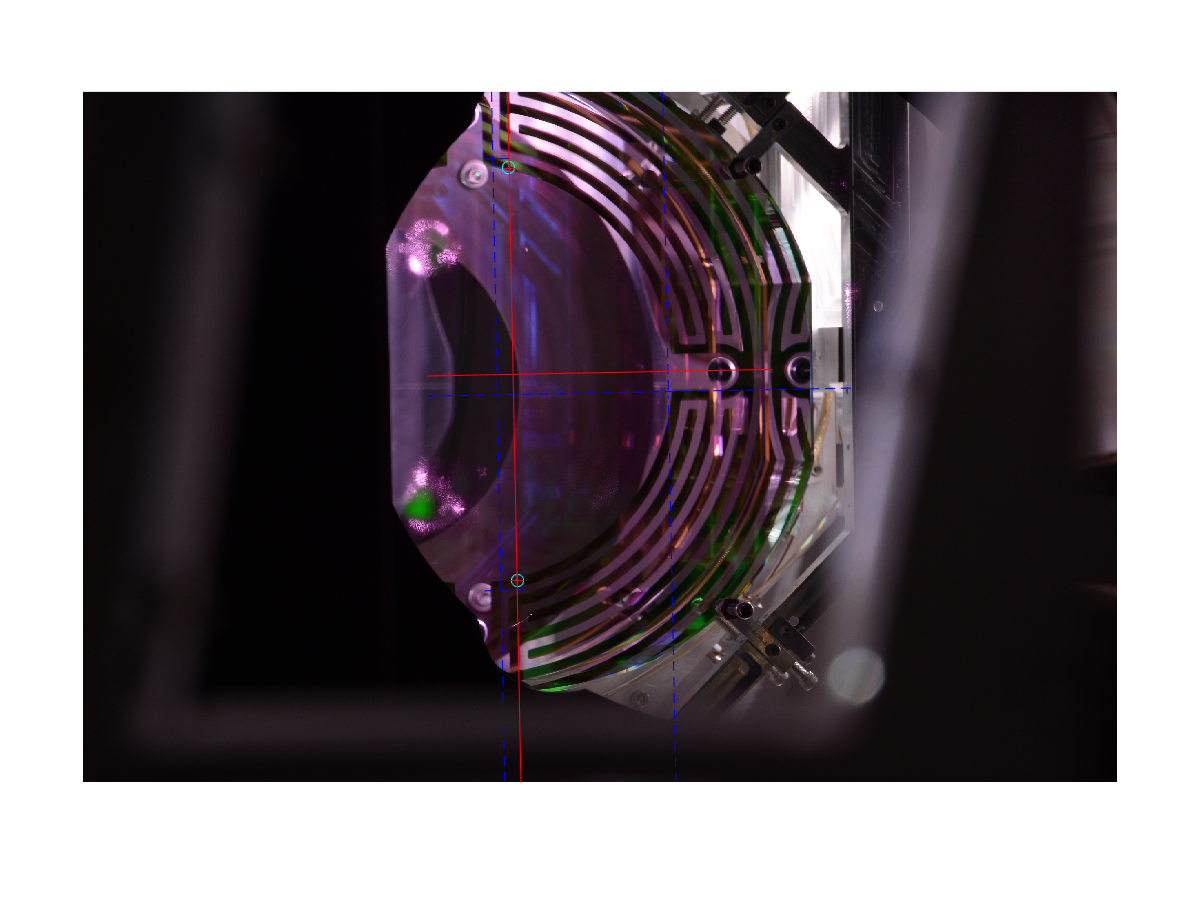
We adjusted the beam locations using the steering mirrors in the Pcal transmitter module and ended up with positions that are within a mm of the optimal locations (see second image attached below): U [ 0.15, 0.43], L[-0.18, 0.05].
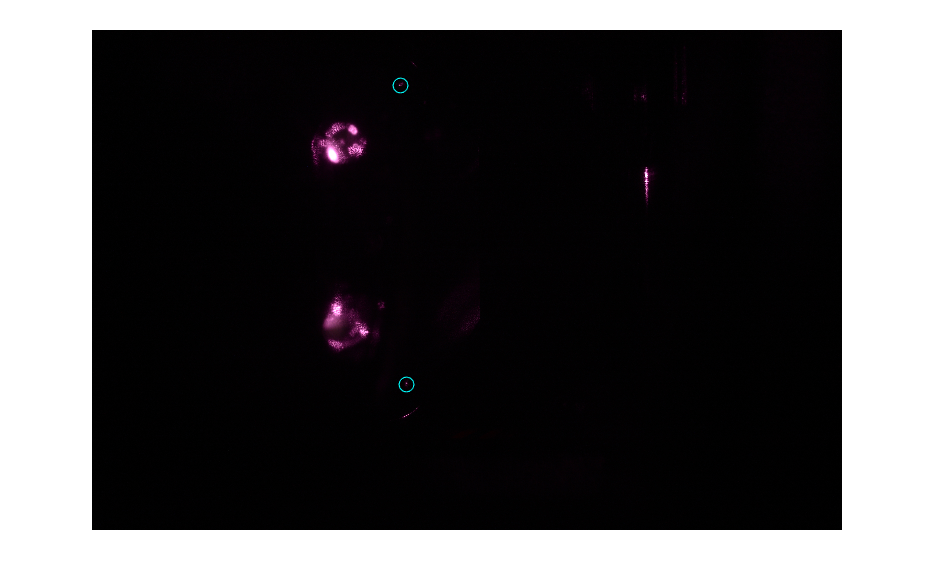
The third image below shows the Pcal spots on the ETM surface (inside green circles), visible when the chamber illuminator is off.
We are in the process of modeling the expected calibration errors resulting from bulk elastic deformation induced by the Pcal forces being so far from the optimal locations, but we expect errors as large as 20-40% at frequencies above 4 kHz for offsets as large as what we had before correcting the positions yesterday.
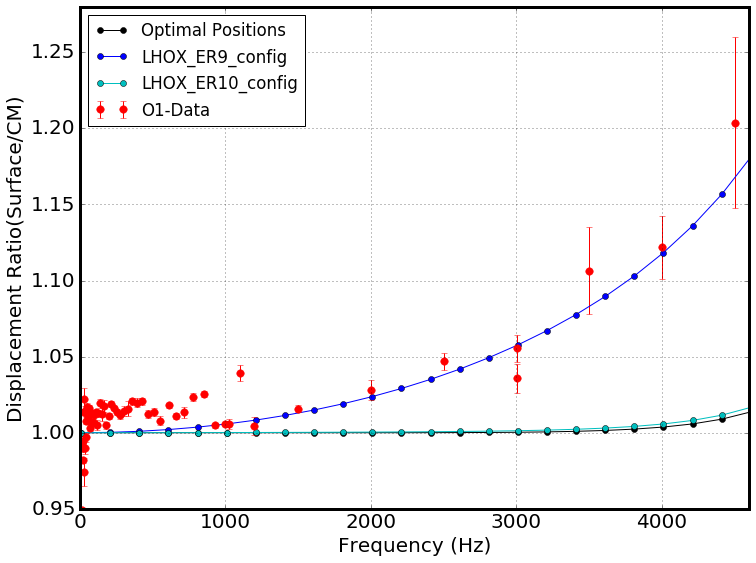
Attached is a plot that shows the expected calibration error at higher frequencies due to the effect of bulk elastic deformation of the test mass. The estimated error is calculated using the COMSOL modeling (worked on by Nicola and Shivaraj this summer) for the pcal beam configuration prior to moving the beam (LHOX_ER9). This is the same configuration in which we were running the the high frequency calibration lines during ER9 and even during O1 (there is no reason to believe the beam positions have changed appreciably since O1). The measurement data plotted alongside are the high frequency calibration lines run during the end of O1 and described in LHO alog 26275. The data is normalized to the model at 1 KHz and agrees closely to the model at frequencies above it. The beams are now moved to their optimal position as described above. The model shows smaller error (plotted in cyan) due to bulk elastic deformation for this optimal configuration (LHOX_ER10). Similar measurement will be done during and before ER10 in order to confirm the model.
Note that the movement of the beam on the ETM, per quarter turn on the adjustment knobs of the mirror mounts in the tramsmitter module, is about 10 mm (judging by what we experienced yesterday).
If one works out the numbers using the 100 TPI actuators in the mount and the 1.5" between the actuator and the pivot point, the result is about 12 mm per quarter turn, assuming the mirror is about 7 m from the mount. It might be closer to 8 meters given the distance from the mirror mount to the periscope and the path in the periscope (larter for the lower - outside - beam).