kiwamu.izumi@LIGO.ORG - posted 11:26, Friday 23 September 2016 (29947)
Close look at ISS second loop spectra
This morning, I have measured the in-loop and out-of-loop spectra of the second loop ISS when it was closed at 50 W with the recently-installed-boosts using an SR785. This was without the full interferometer but the IMC. Here is the results.
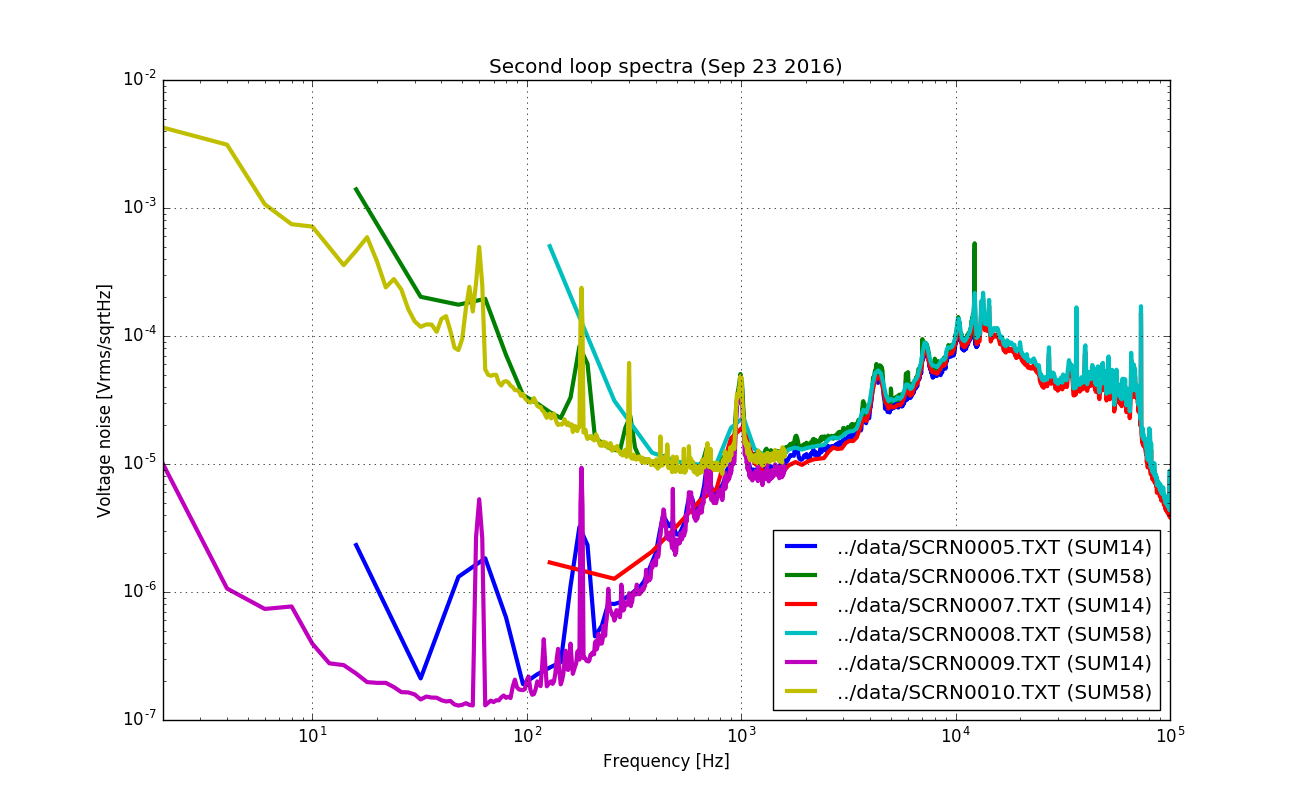
The purple, blue and red curves are all the in-loop spectra (i.e. SUM14) but with different frequency resolutions. The yellow, green and cyan curves are the ones for the out-of-loop sensor (i.e. SUM58). The interpretation and implication of this plot will be posted by Keita, Daniel and Ben later. The data, plotting script and figures are also attached as a zip file.
Images attached to this report
Non-image files attached to this report
