edmond.merilh@LIGO.ORG - posted 11:45, Monday 17 October 2016 - last comment - 12:41, Monday 17 October 2016(30591)
PSL Weekly 10 Day Trends - FAMIS #6118
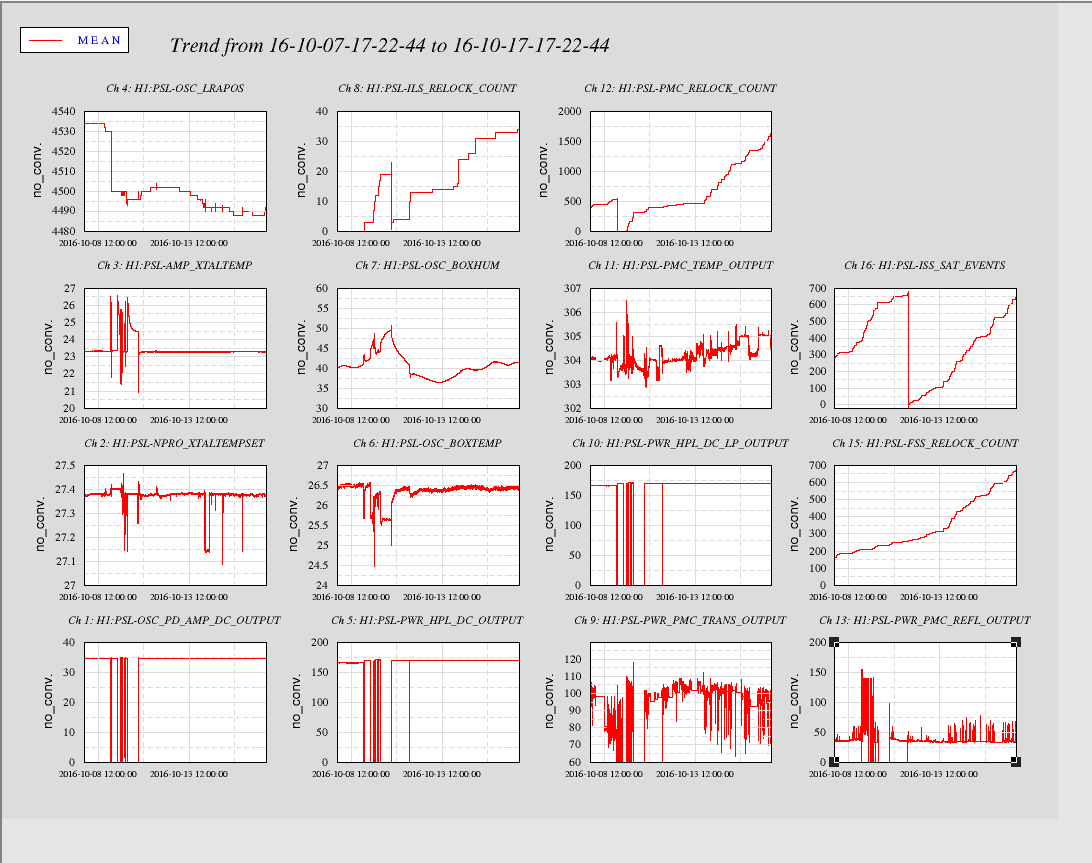
Weekly Xtal - graphs show some strange power fluctuations in Amp diode powers starting on or around the 10th. Also, this can be seen in the OSC_DB4_PWR graph as well.
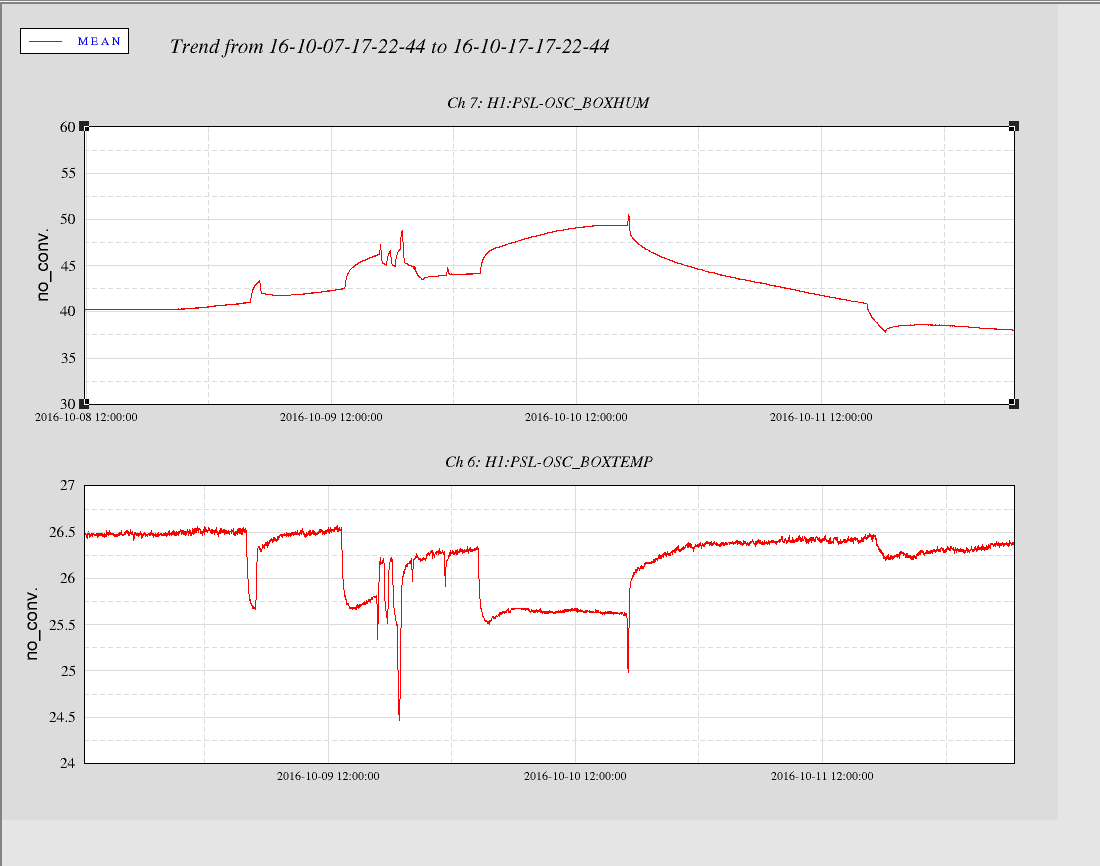
Weekly Laser - Osc Box Humidity reached a high point at about the same time (10th) but seems to have started an upward trend sometime between the 8th and the 9th. PMC Trans power looks pretty erratic. Included is a zoomed view of the Osc box humidity and the OSC Box Temp just for correlative purpose.
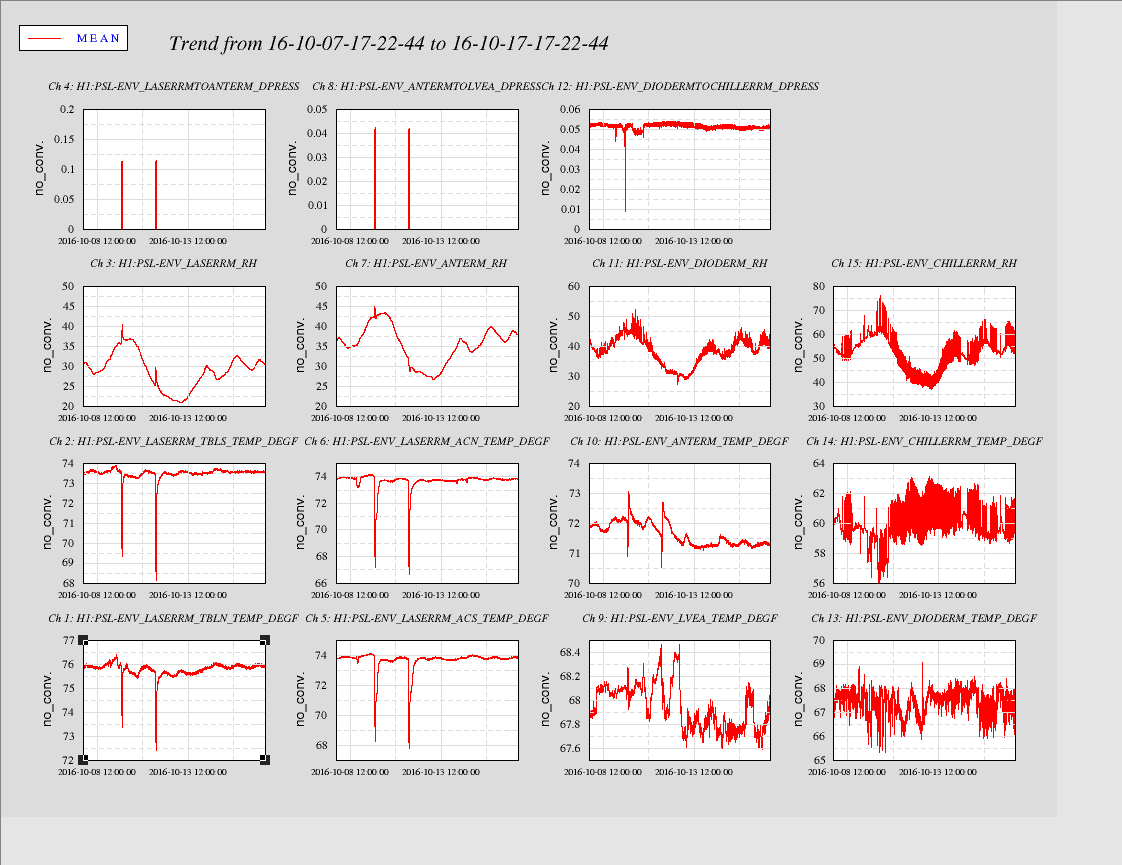
Weekly Env - nothing notable.
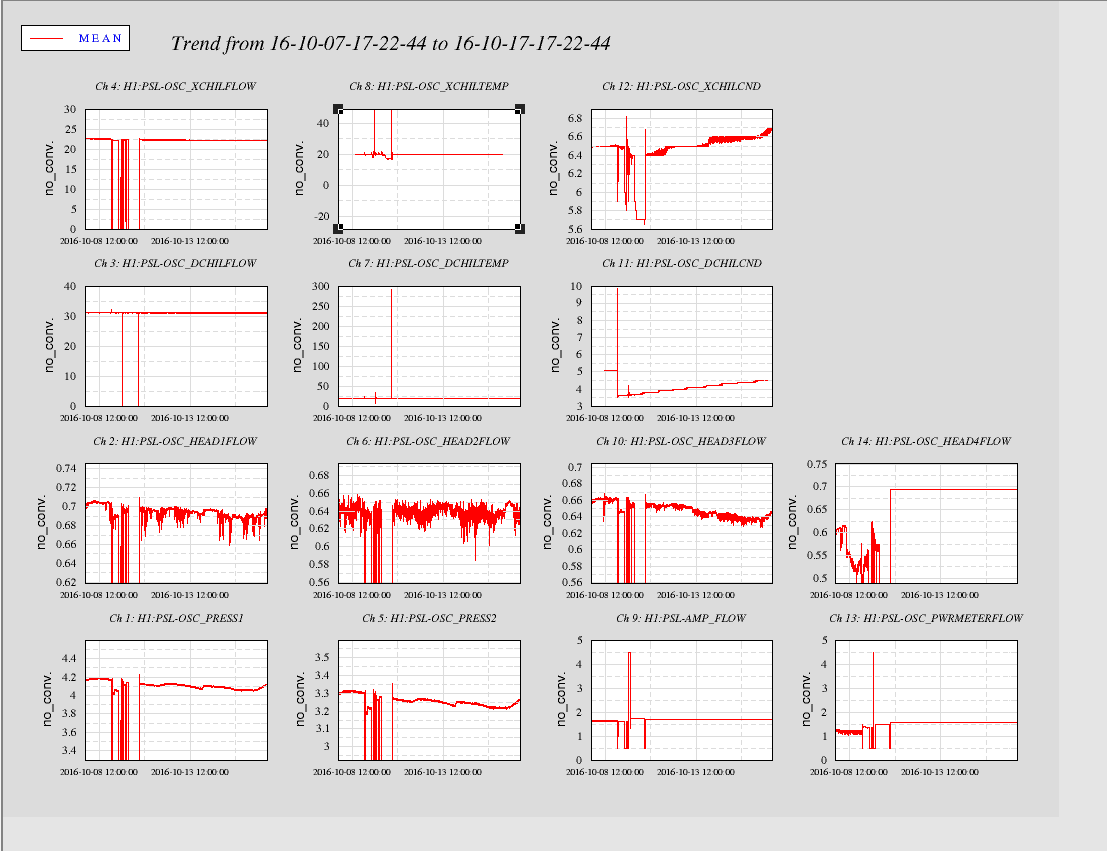
Weekly Chiller - some marginal downward trends in headflow for heads 1-3. Head 4 is eother crazy stable and good OR this data is trash. ??
Images attached to this report

Comments related to this report
Head 4, power meter circuit, and front end flows are "fake" due to force writing in TwinCAT.