Sheila Kiwamu Jenne Daniel
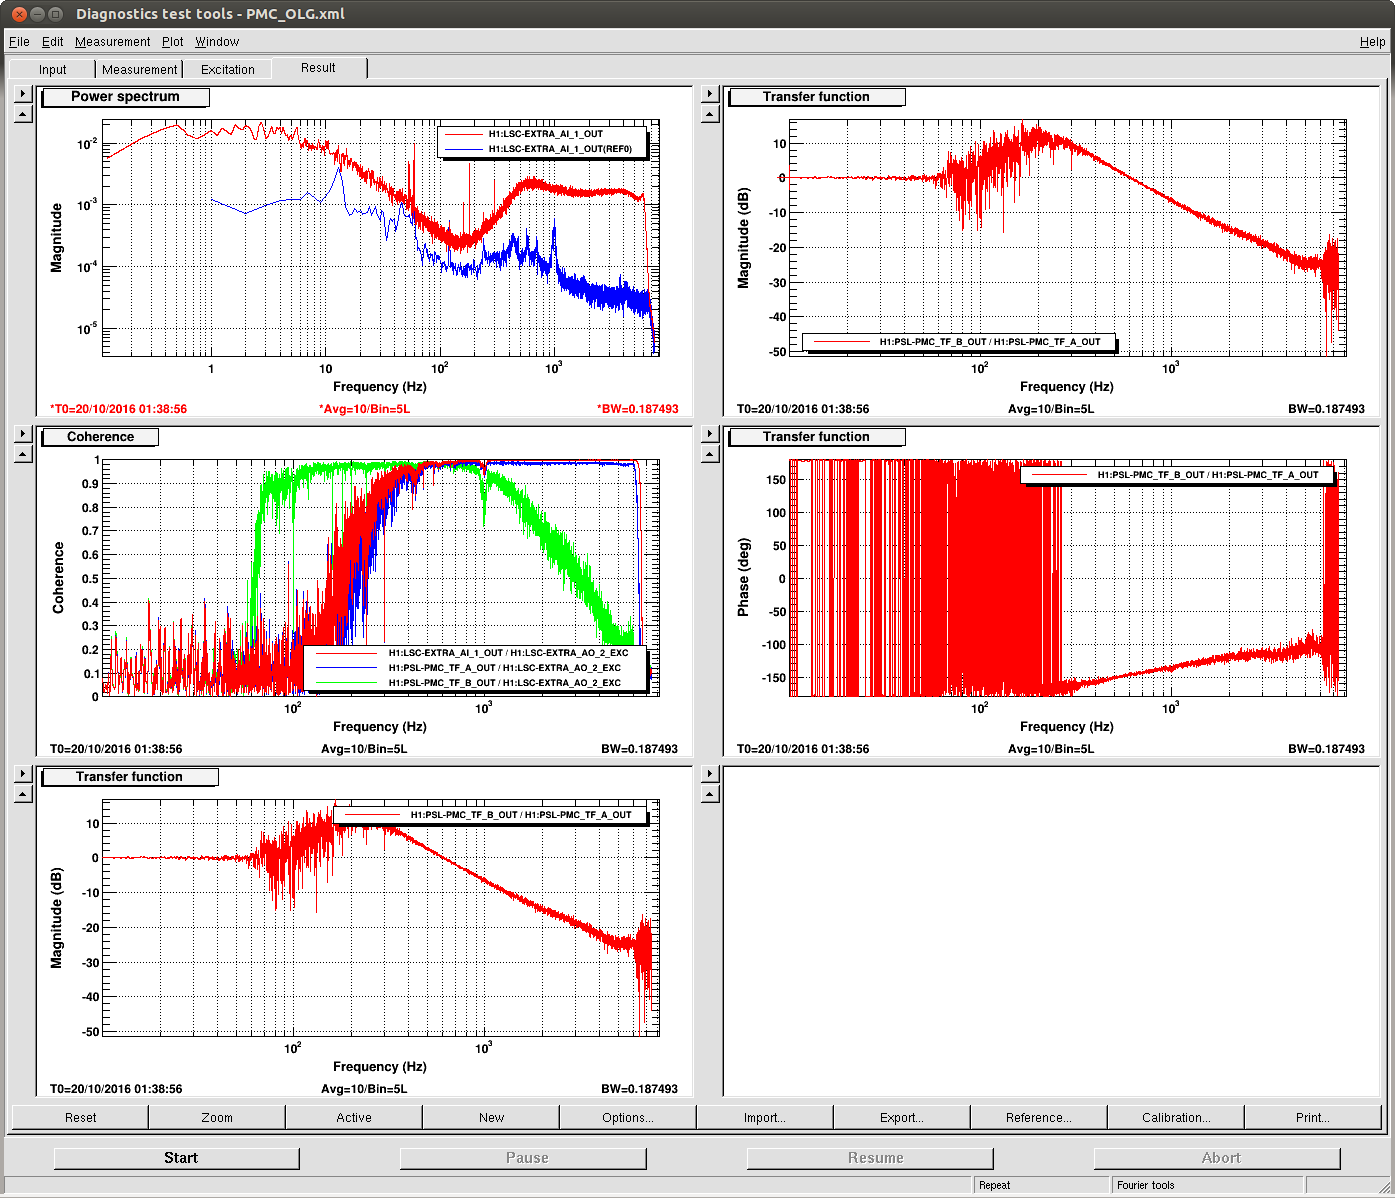
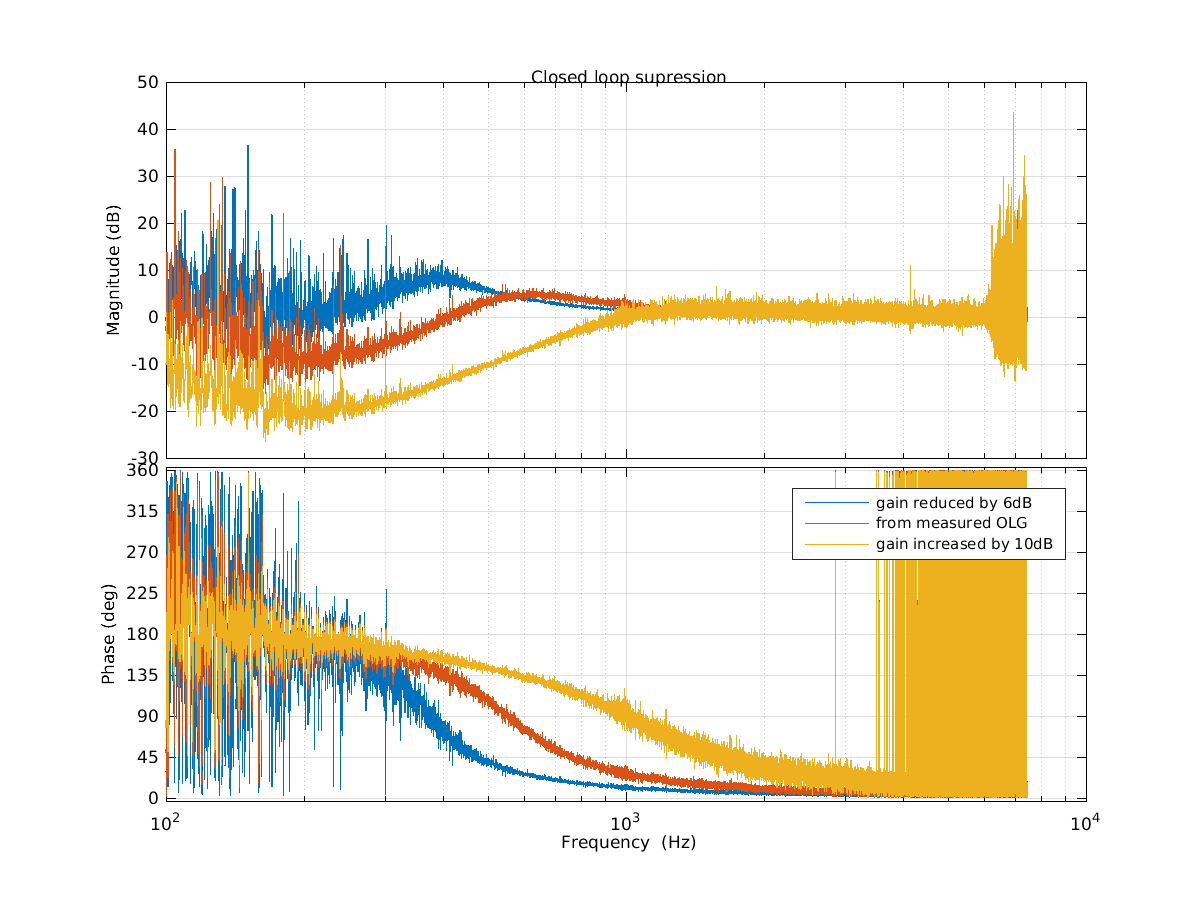
We measured the OLG of the PMC loop with the interferometer unlocked, and saw that it is aroun 500Hz while it is supposed to be at around 5kHz. Plotting the measured OLG as closed loop supression, we predict that this loop should have gain peaking approximately around the frequency of our lump in DARM. (second attachment). We tried increaseing and decreasing the gain by 6dB, and didn't see much of a change in DARM.
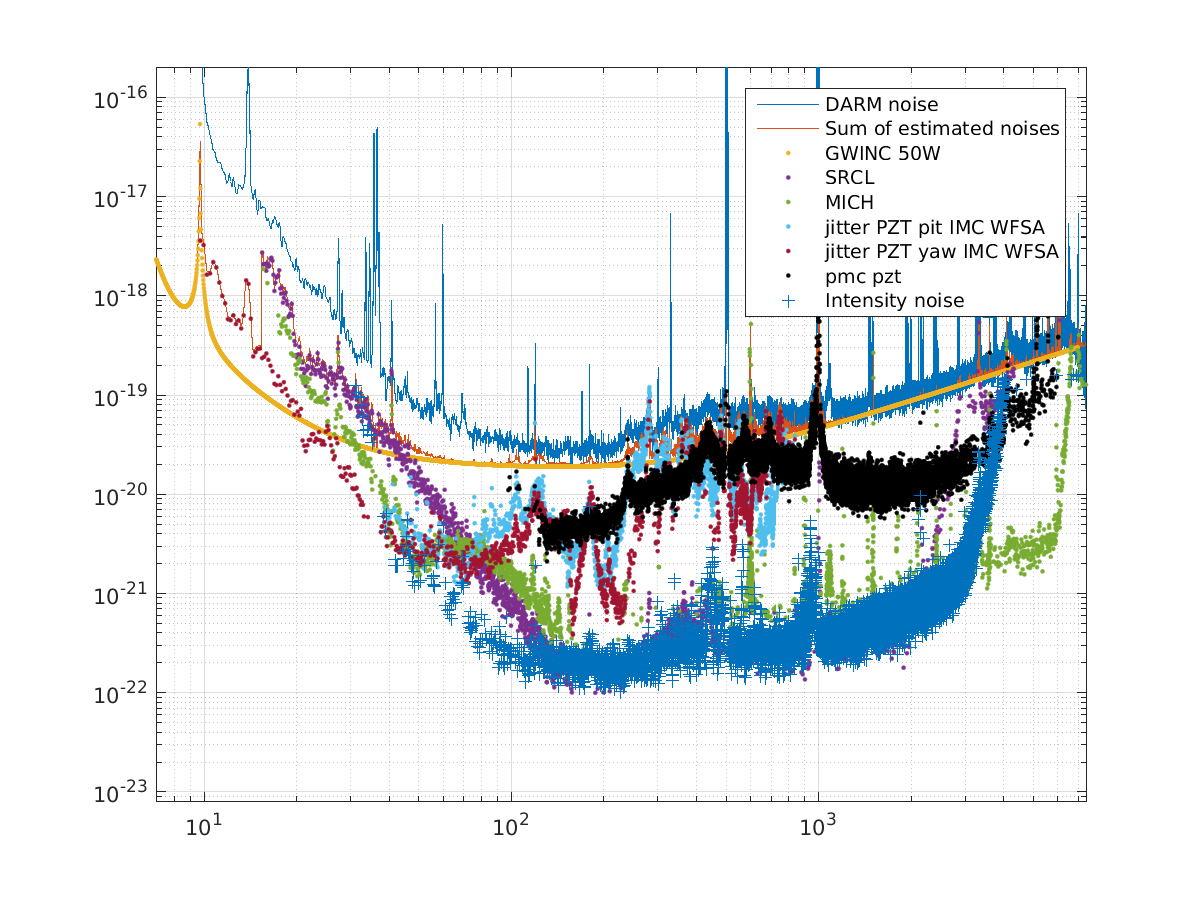
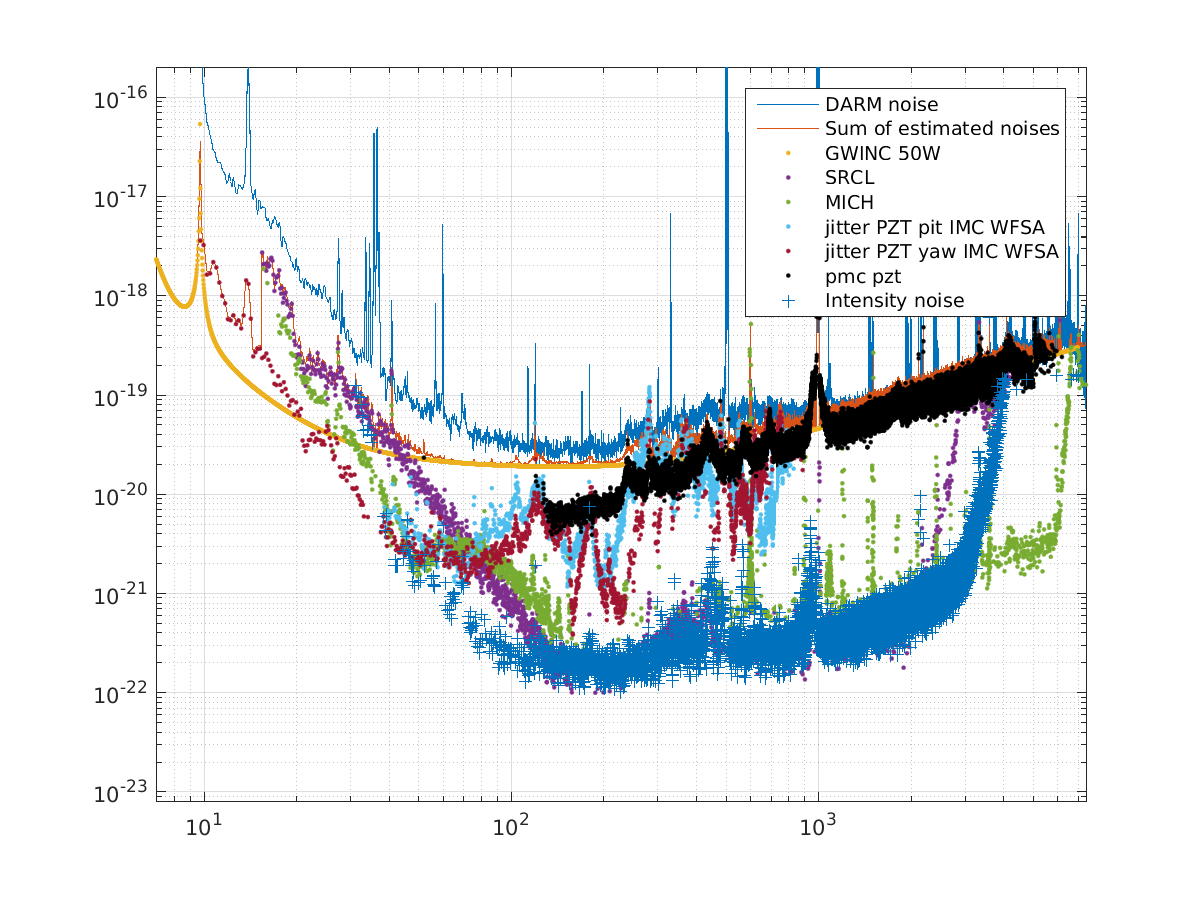
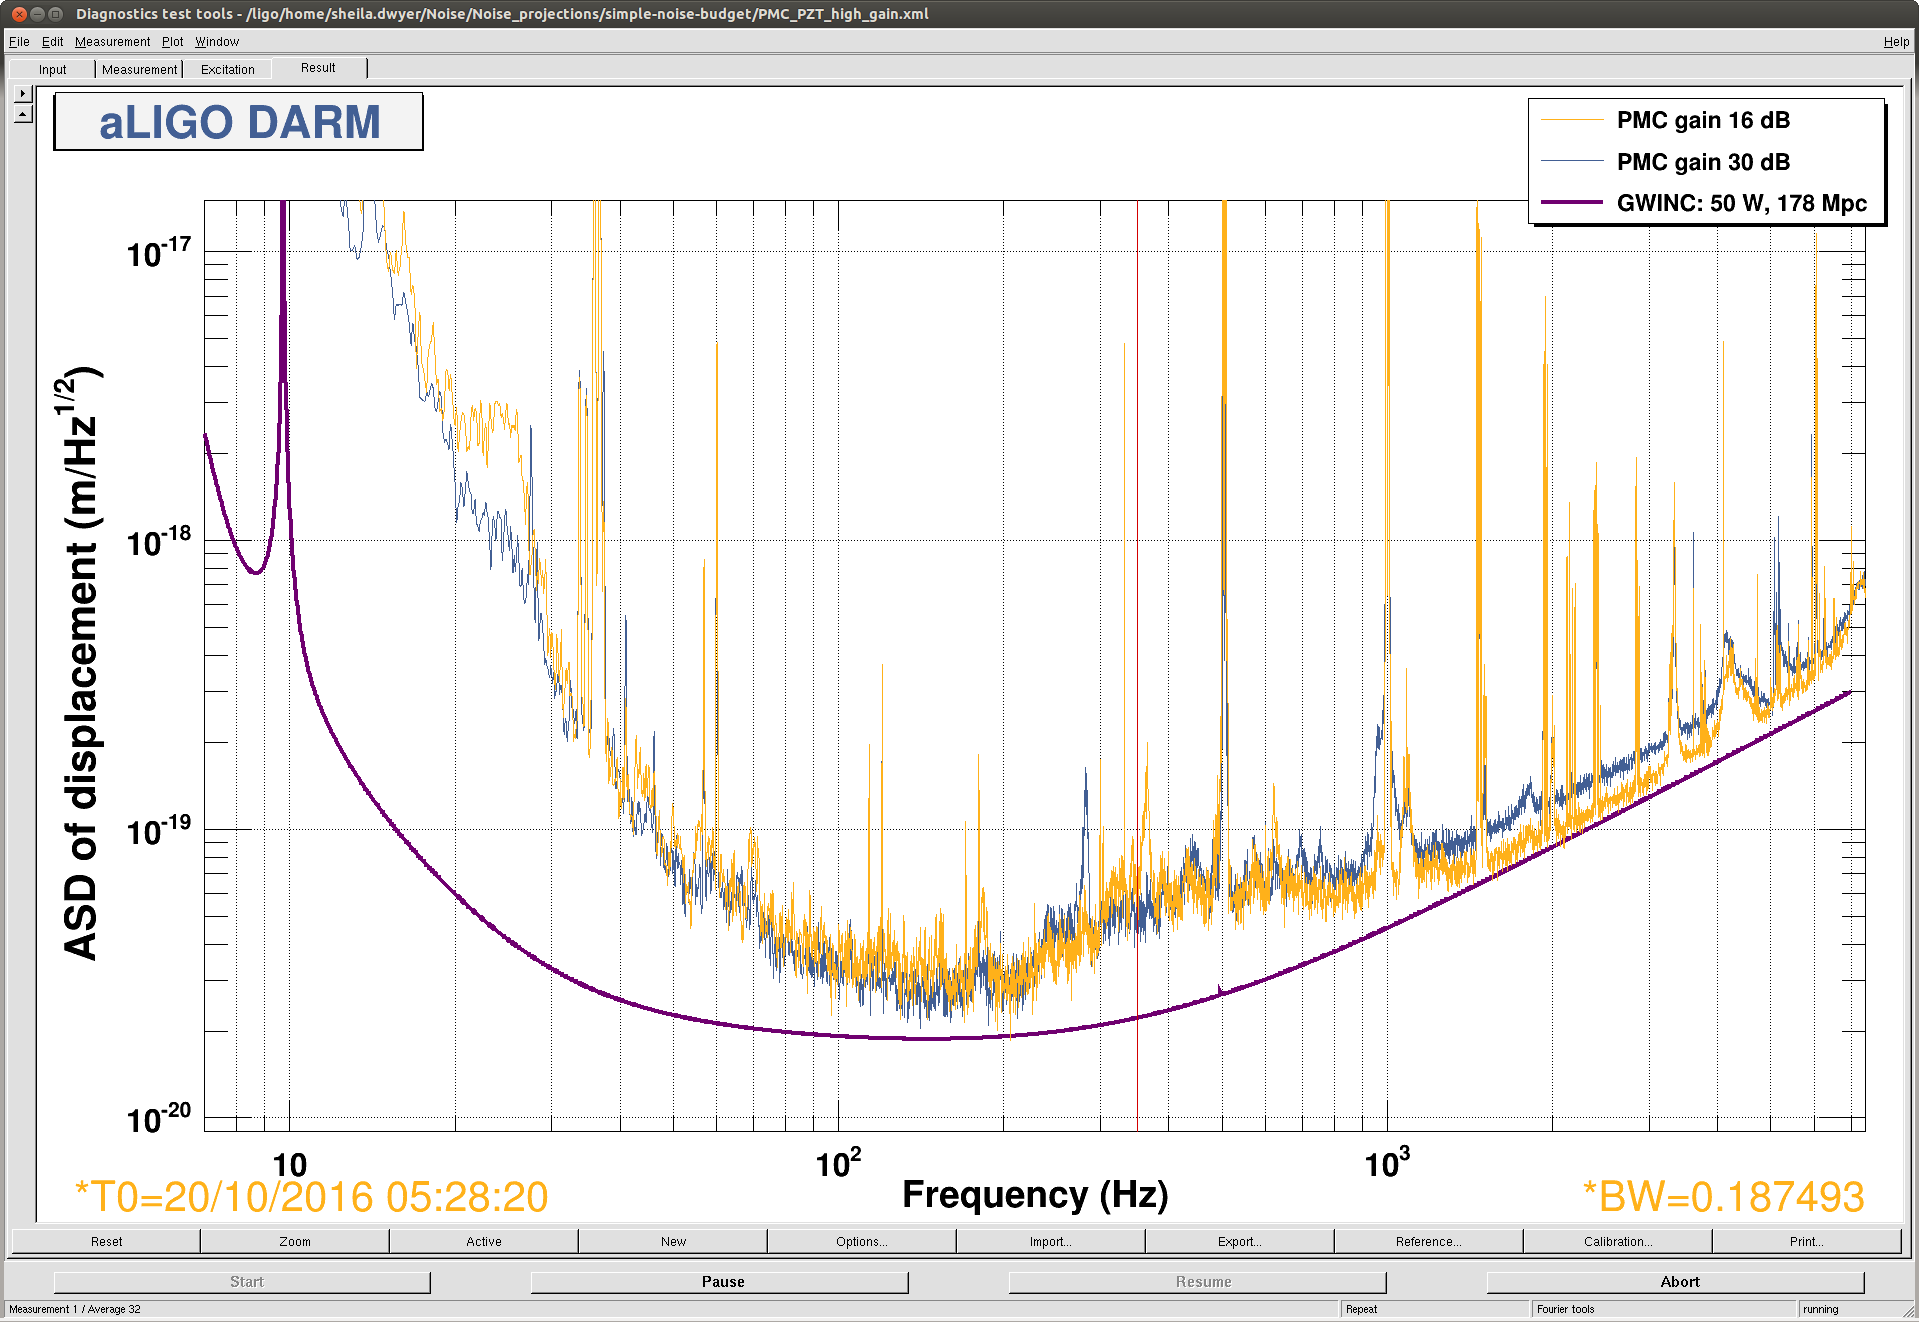
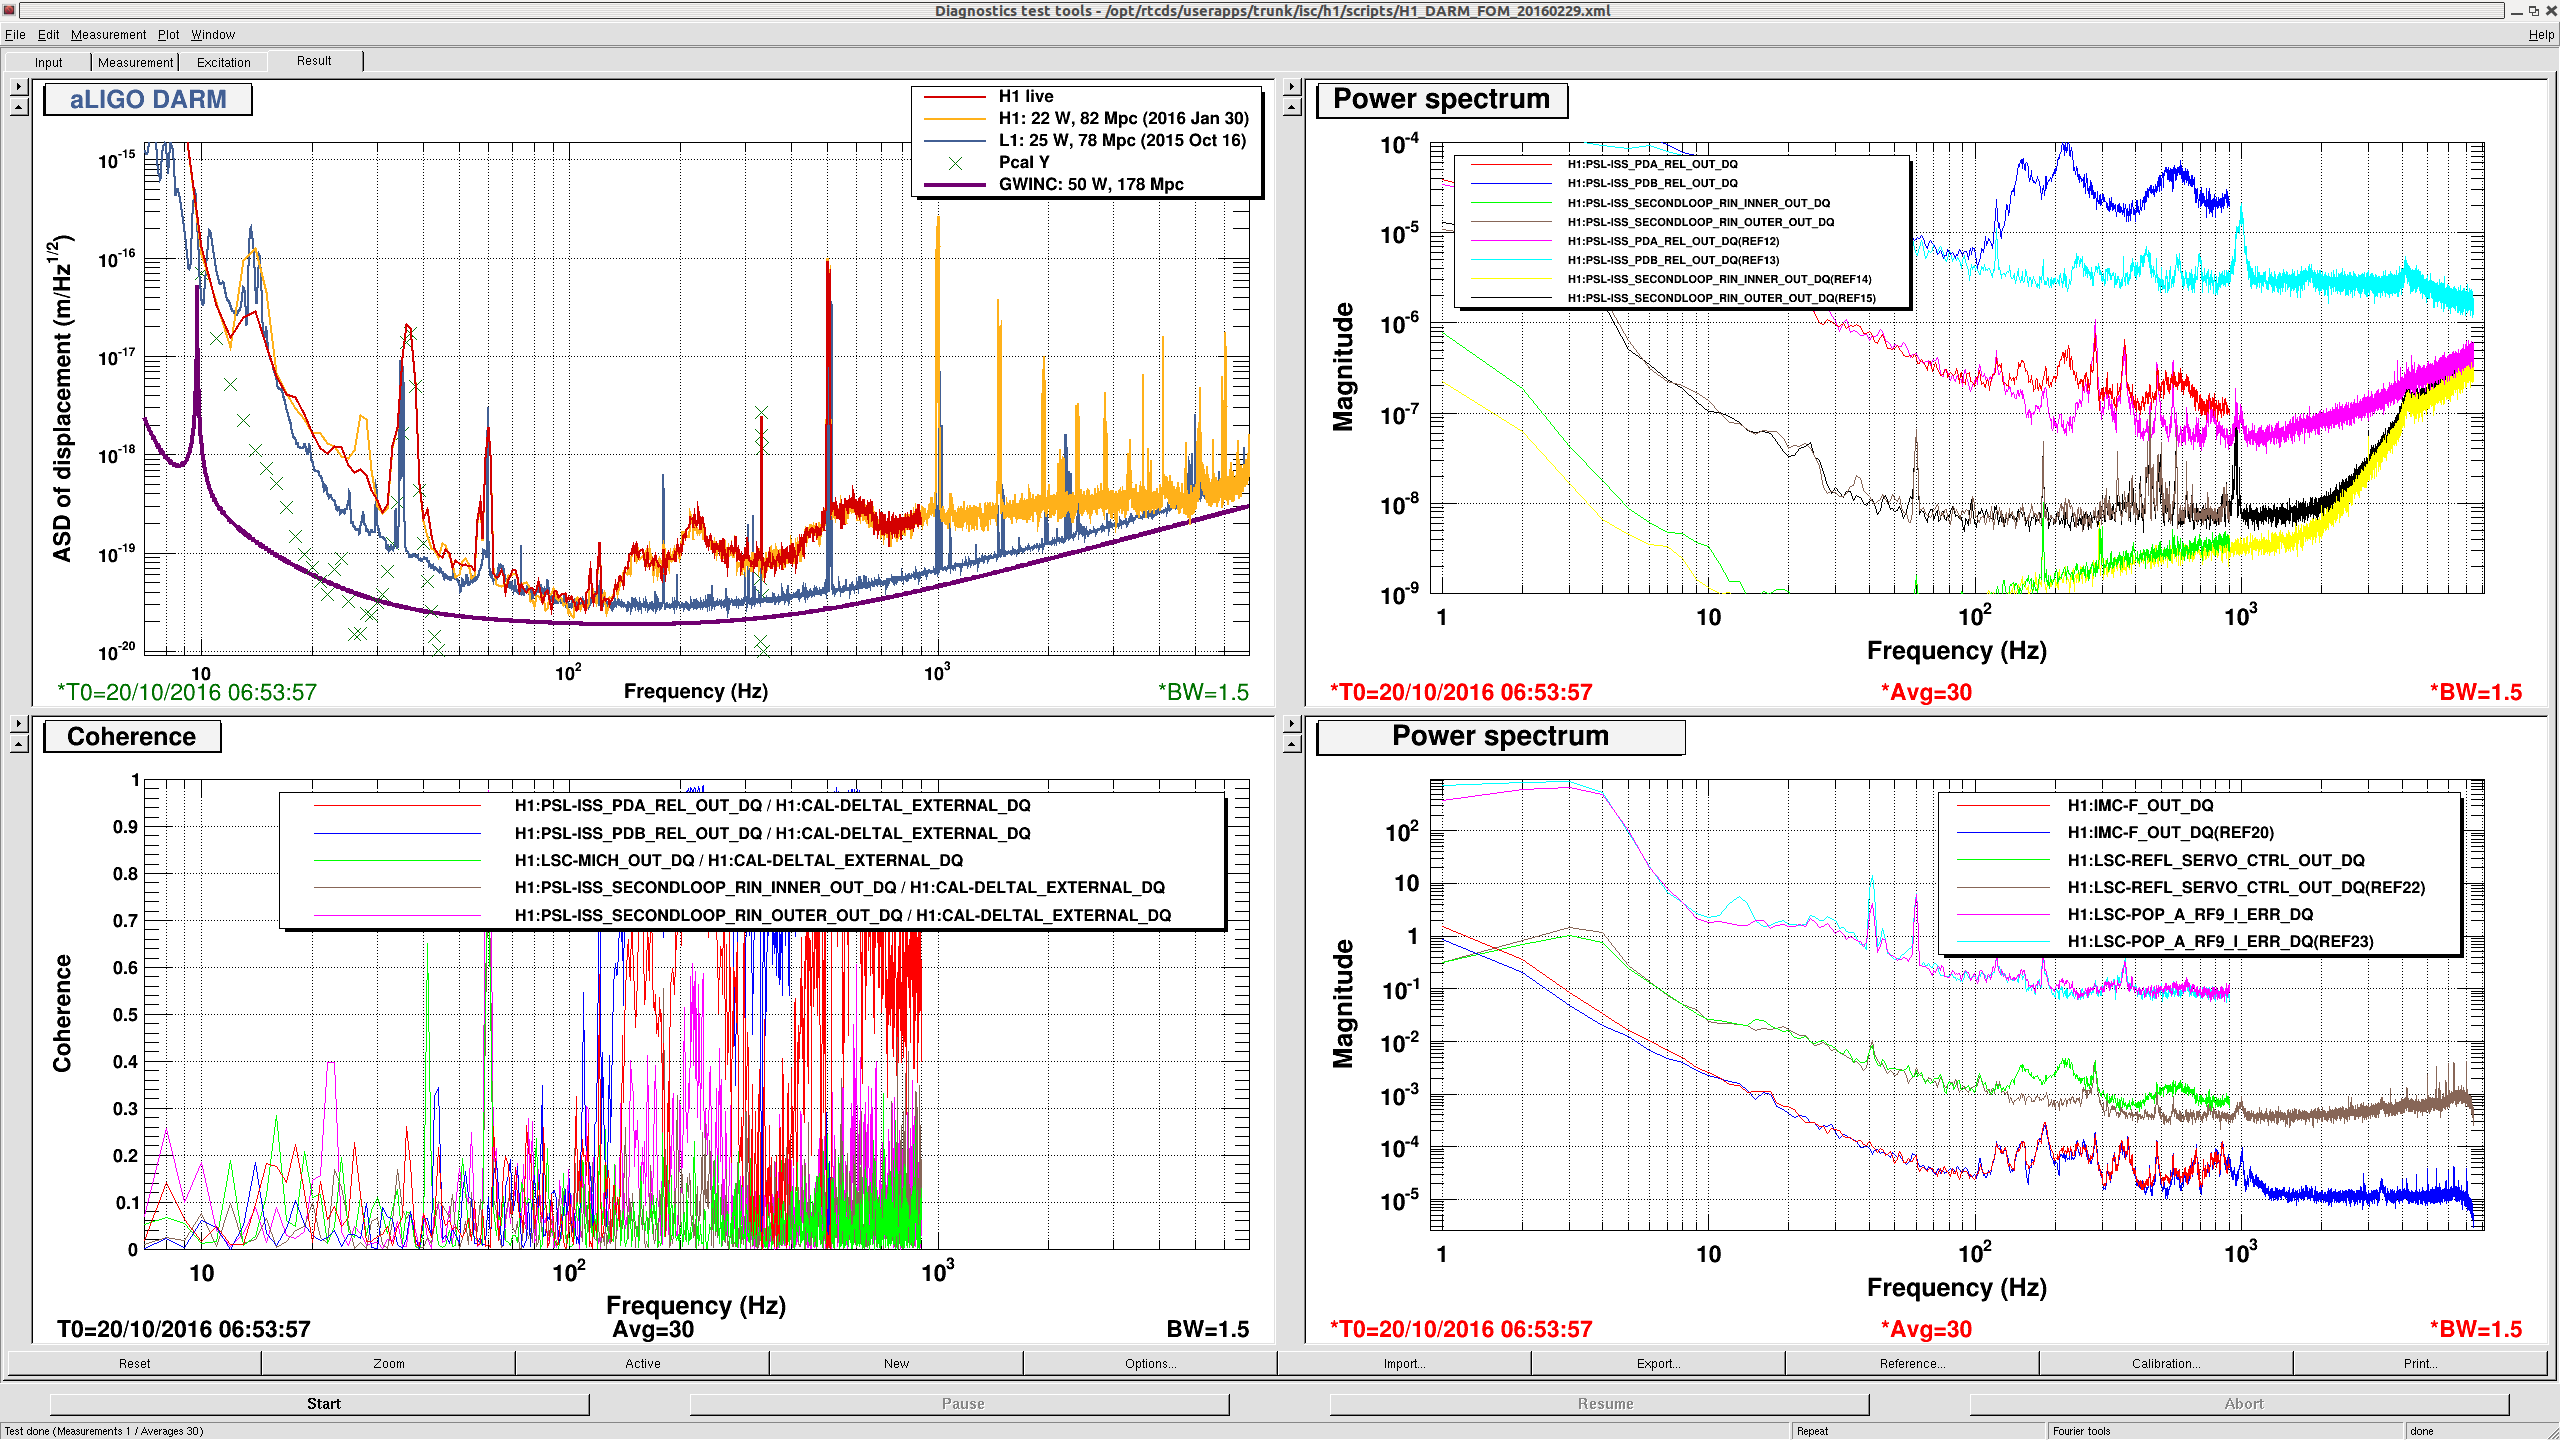
However, a driven measurement using the newly amplified HV mon as a readback predicts that this noise is about a factor of 2 below DARM in our lump. The third and fourth attachments are the same noise injections that Jenne and I posted on monday for MICH SRCL and PZT jitter, with projections based on PMC PZT HV mon. Kiwamu found an alog from april, 26538 indicating that the gain should be set to 30 dB (it has been 16 dB for the last several months). The third attachment shows the noise projection with the PMC gain at 16dB, while the 4th one shows 30dB. The 5th screenshot shows the difference in the DARM spectrum with the increased gain.
People are still invesitgating the coupling mechanism, we think that intensity noise (which we think was the explanation for the simliar noise at LLO in 2014 16186) is ruled out by the intensity noise injection, although it is interesting to note that the spectrum of this PMC HV lines up fairly well with the ISS control signal.
According to various signals when the PMC HV was excited, we are concluding that this is not a coupling through intensity or frequency of the light. We don't know how the HV noise couples to DARM.
In the attached screen shot, the right two panels show various signals with and without a broad band excitation in the HV. The PMC control gain was at 30 dB throughout the measurements. The upper right panel shows an increase in the PDA spectrum (which has been used as the sensor for the inner loop), indicating that the ISS witnesses increase in the HV noise somehow. However, the second loop sensors don't really show increase in their noise level below 1 kHz. This means that RIN at OMC DCPD should be at 1e-10 RIN/sqrtHz which is a factor of 10 lower than shot noise because our RIN to RIN coupling from the interferometer input to OMC DCPD is roughly -40 dB. So this does look like an intensity noise coupling.
As for frequency noise, the situation seems similar to intensity. The CARM loop sees higher noise level in frequency according to REFL_CTRL_OUT in the lower right panel. However POP 9I, which is an out-of-loop frequency noise sensor, did not show any elevated noise at all below 1 kHz. Based on the coupling of POP 9I measured the other day (30610), POP 9I should show higher noise level by a factor of a few in order to explain the increased noise level in DARM by frequency noise. So it does not seem to be frequency noise coupling either.
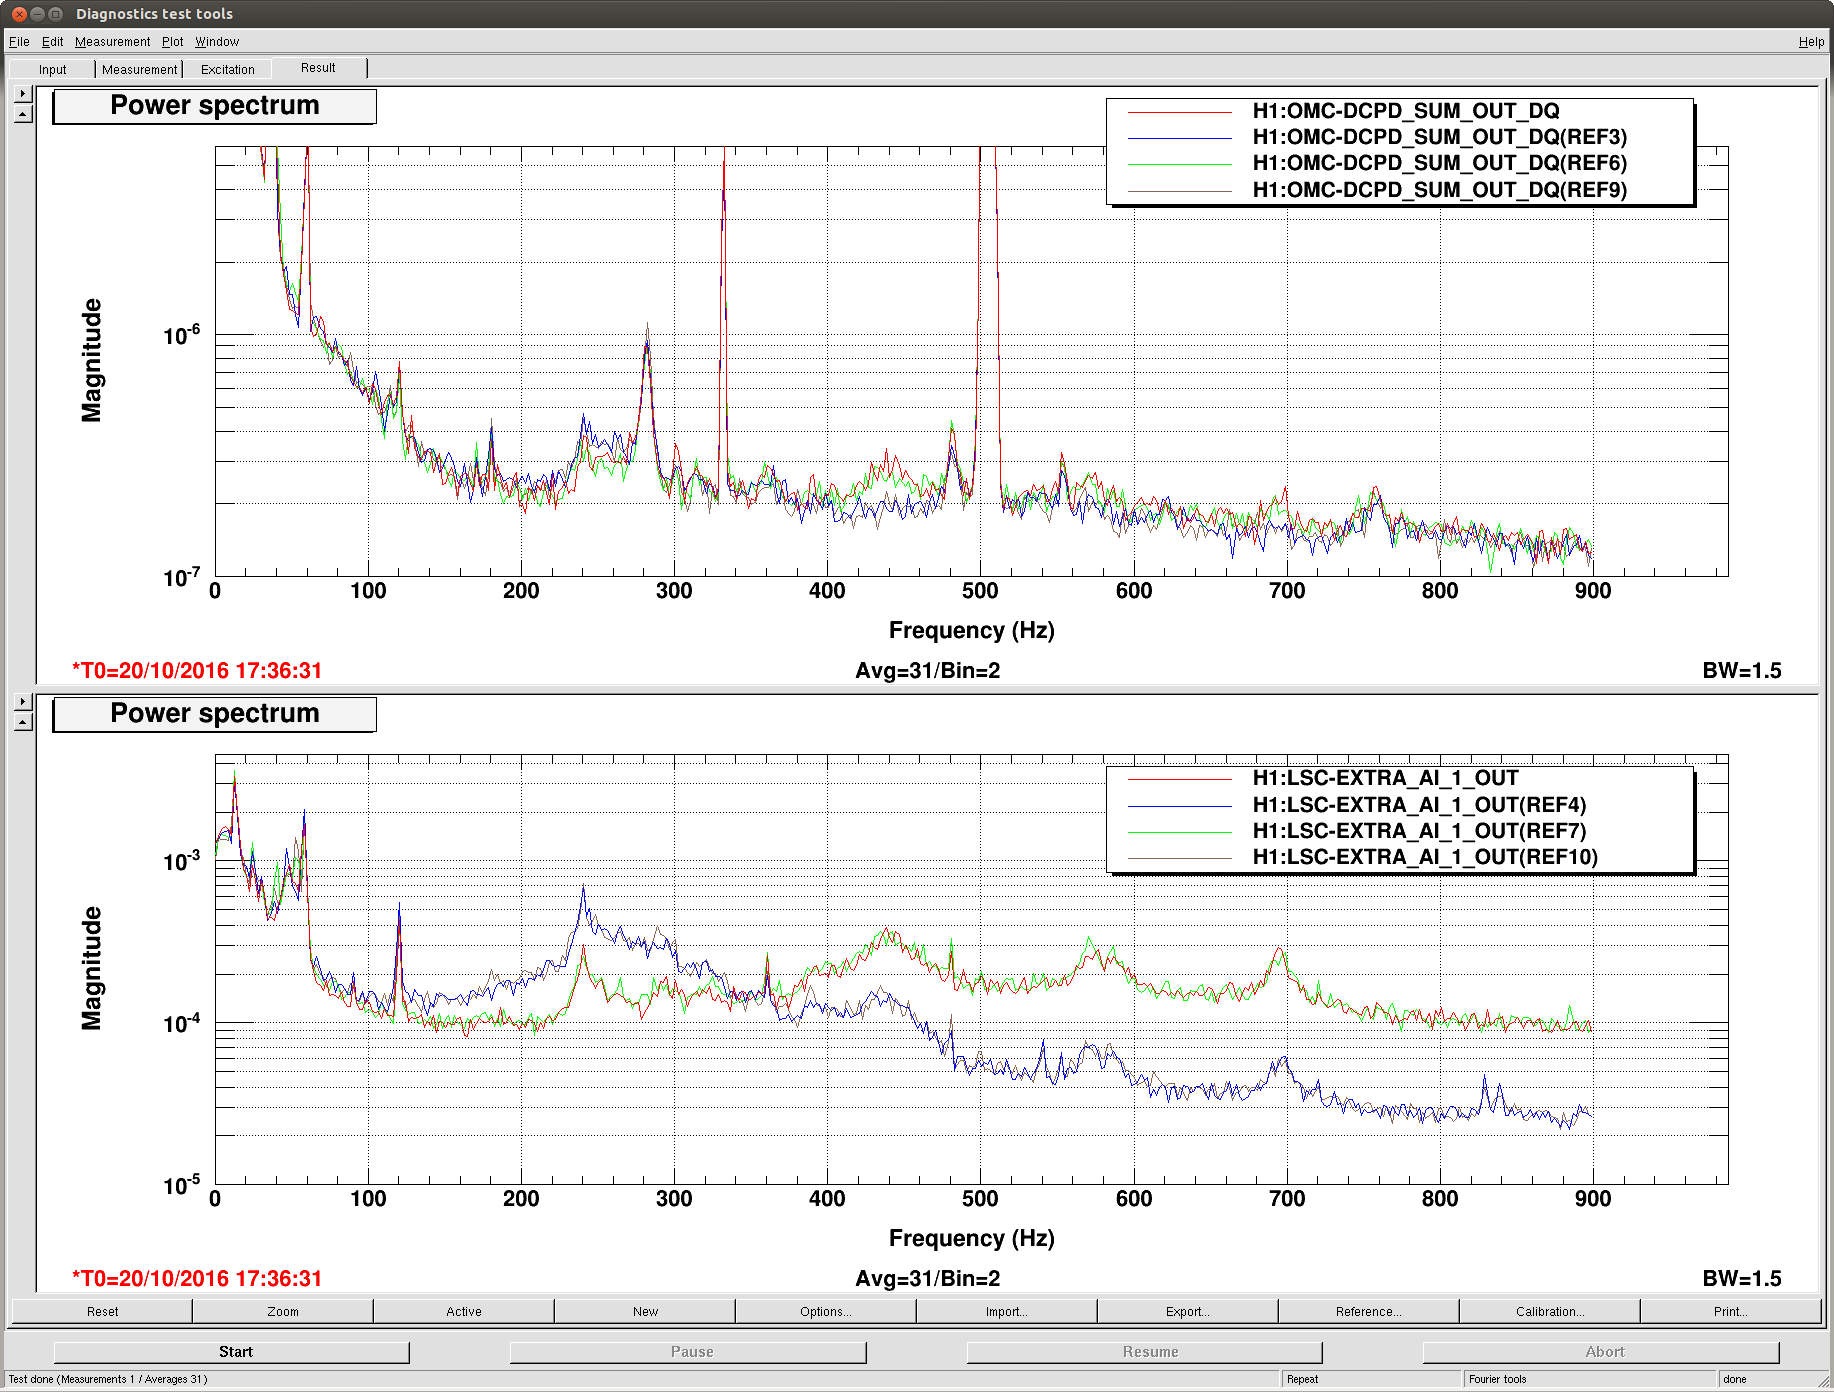
I compared nominal PMC locking gain (red, green) and 6dB lower (blue, brown).
Due to gain peaking at 240Hz the feedback signal doesn't decrease below 400Hz.
Anyway, higher than 400Hz, I see some reduction in DARM when the gain was lower, but it seems as if the reduction was mainly at around the peak of the three bumps (440, 580 and 700 Hz). For example it seems as if there's no reduction of noise at 520Hz even though the feedback signal to PMC PZT was reduced by a factor of 4.
We can also see that DARM got worse at 240Hz by reducing the gain due to gain peaking.
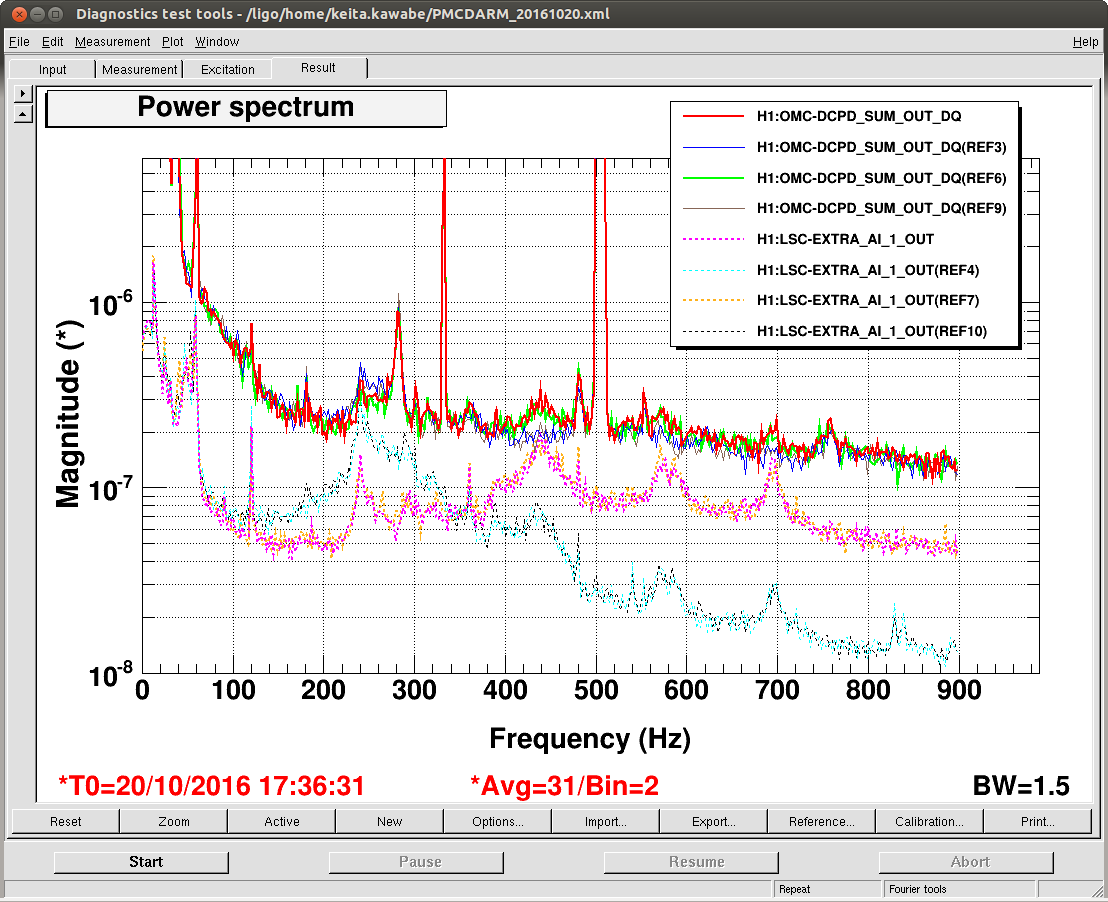
Changing the PMC filter to allow us to lock at much lower UGF would help but the featureless bump might stay. The second plot is the same as the first one but the PMC PZT (dashed) is put on top of the DCPD (solid). PMC PZT is arbitrarily scaled so that the DCPD with high bandwidth PMC lock (red, green) looks like the SUM of DCPD with low bandwidth PMC lock (blue, brown) and PZT with high bandwidth PMC lock(pink, orange).