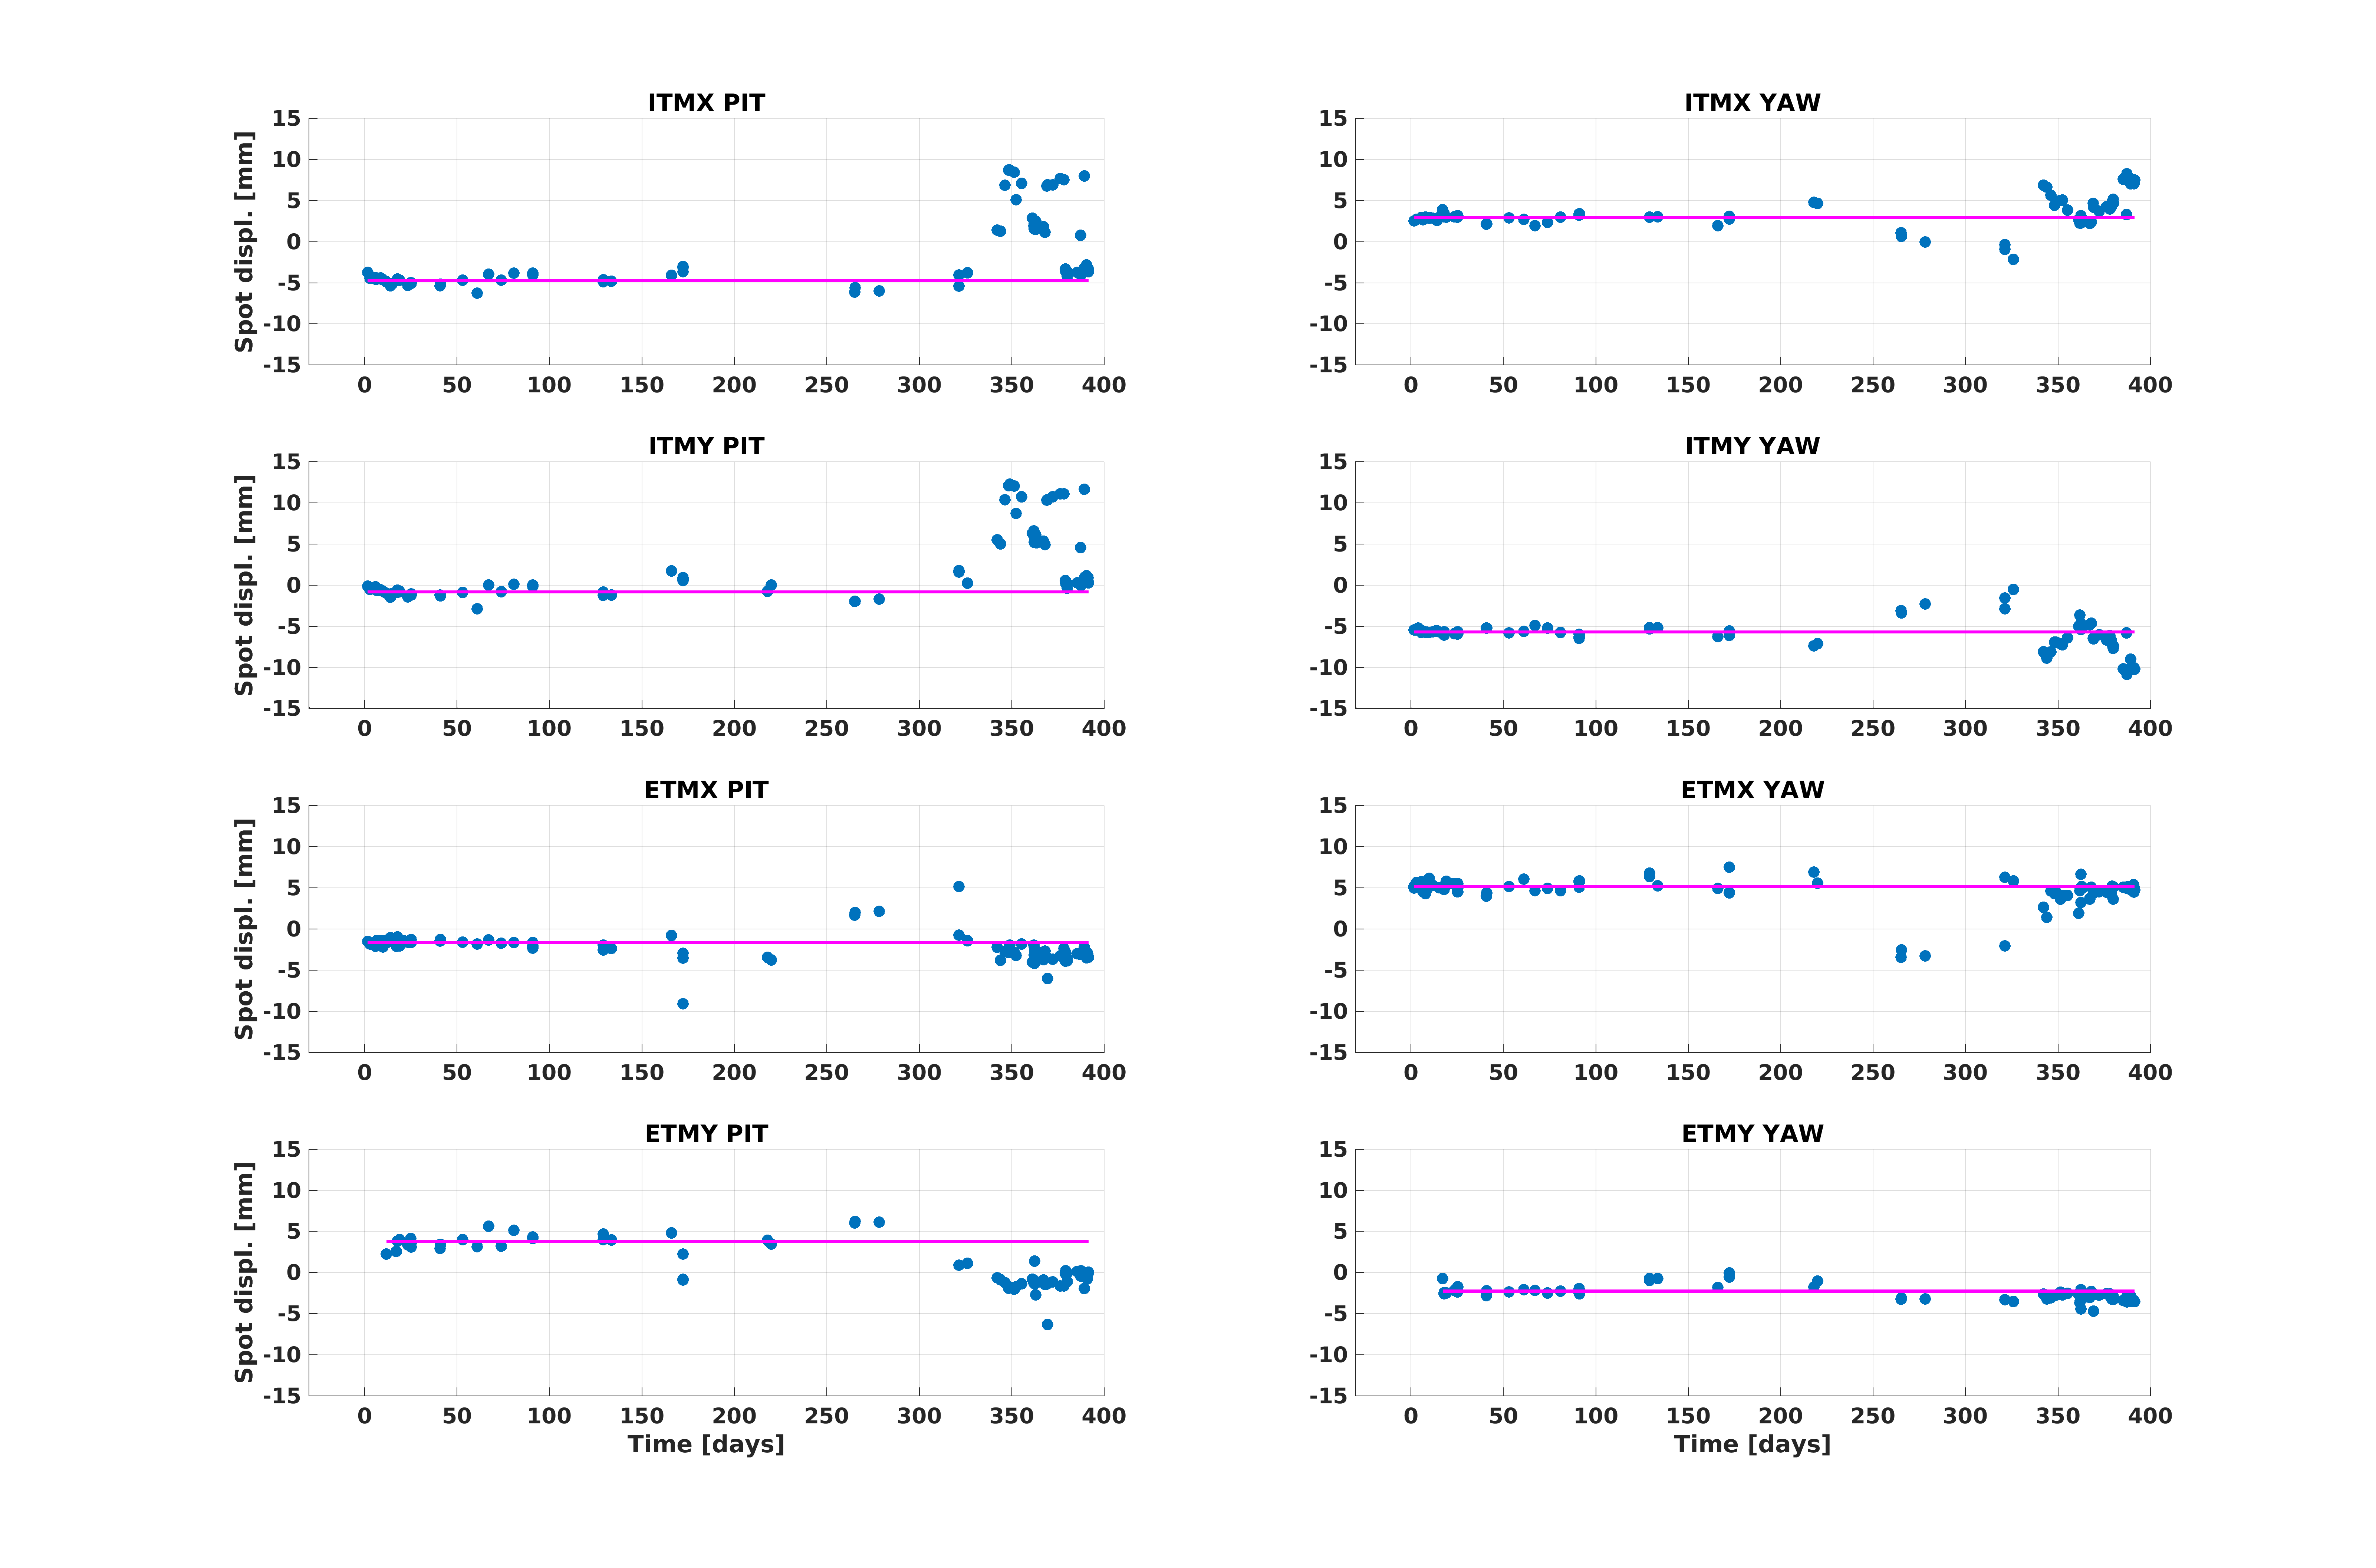
As was brought up at this afternoon's commissioning meeting, I have computed the test mass spot positions over the last year. T(0) on the plot is 10-Oct-2015, the date of the first A2L measurement that I have data for. The data through the end of O1 has been seen before, but I haven't looked at it since then. The spots have been moving a whole lot, so probably I should be better about updating these plots more often.
The 3 attached plots all show the same data, but with differing amounts of extra info. The dots are the spot positions, and the magenta horizontal line is the average position of all the measurements taken through O1.
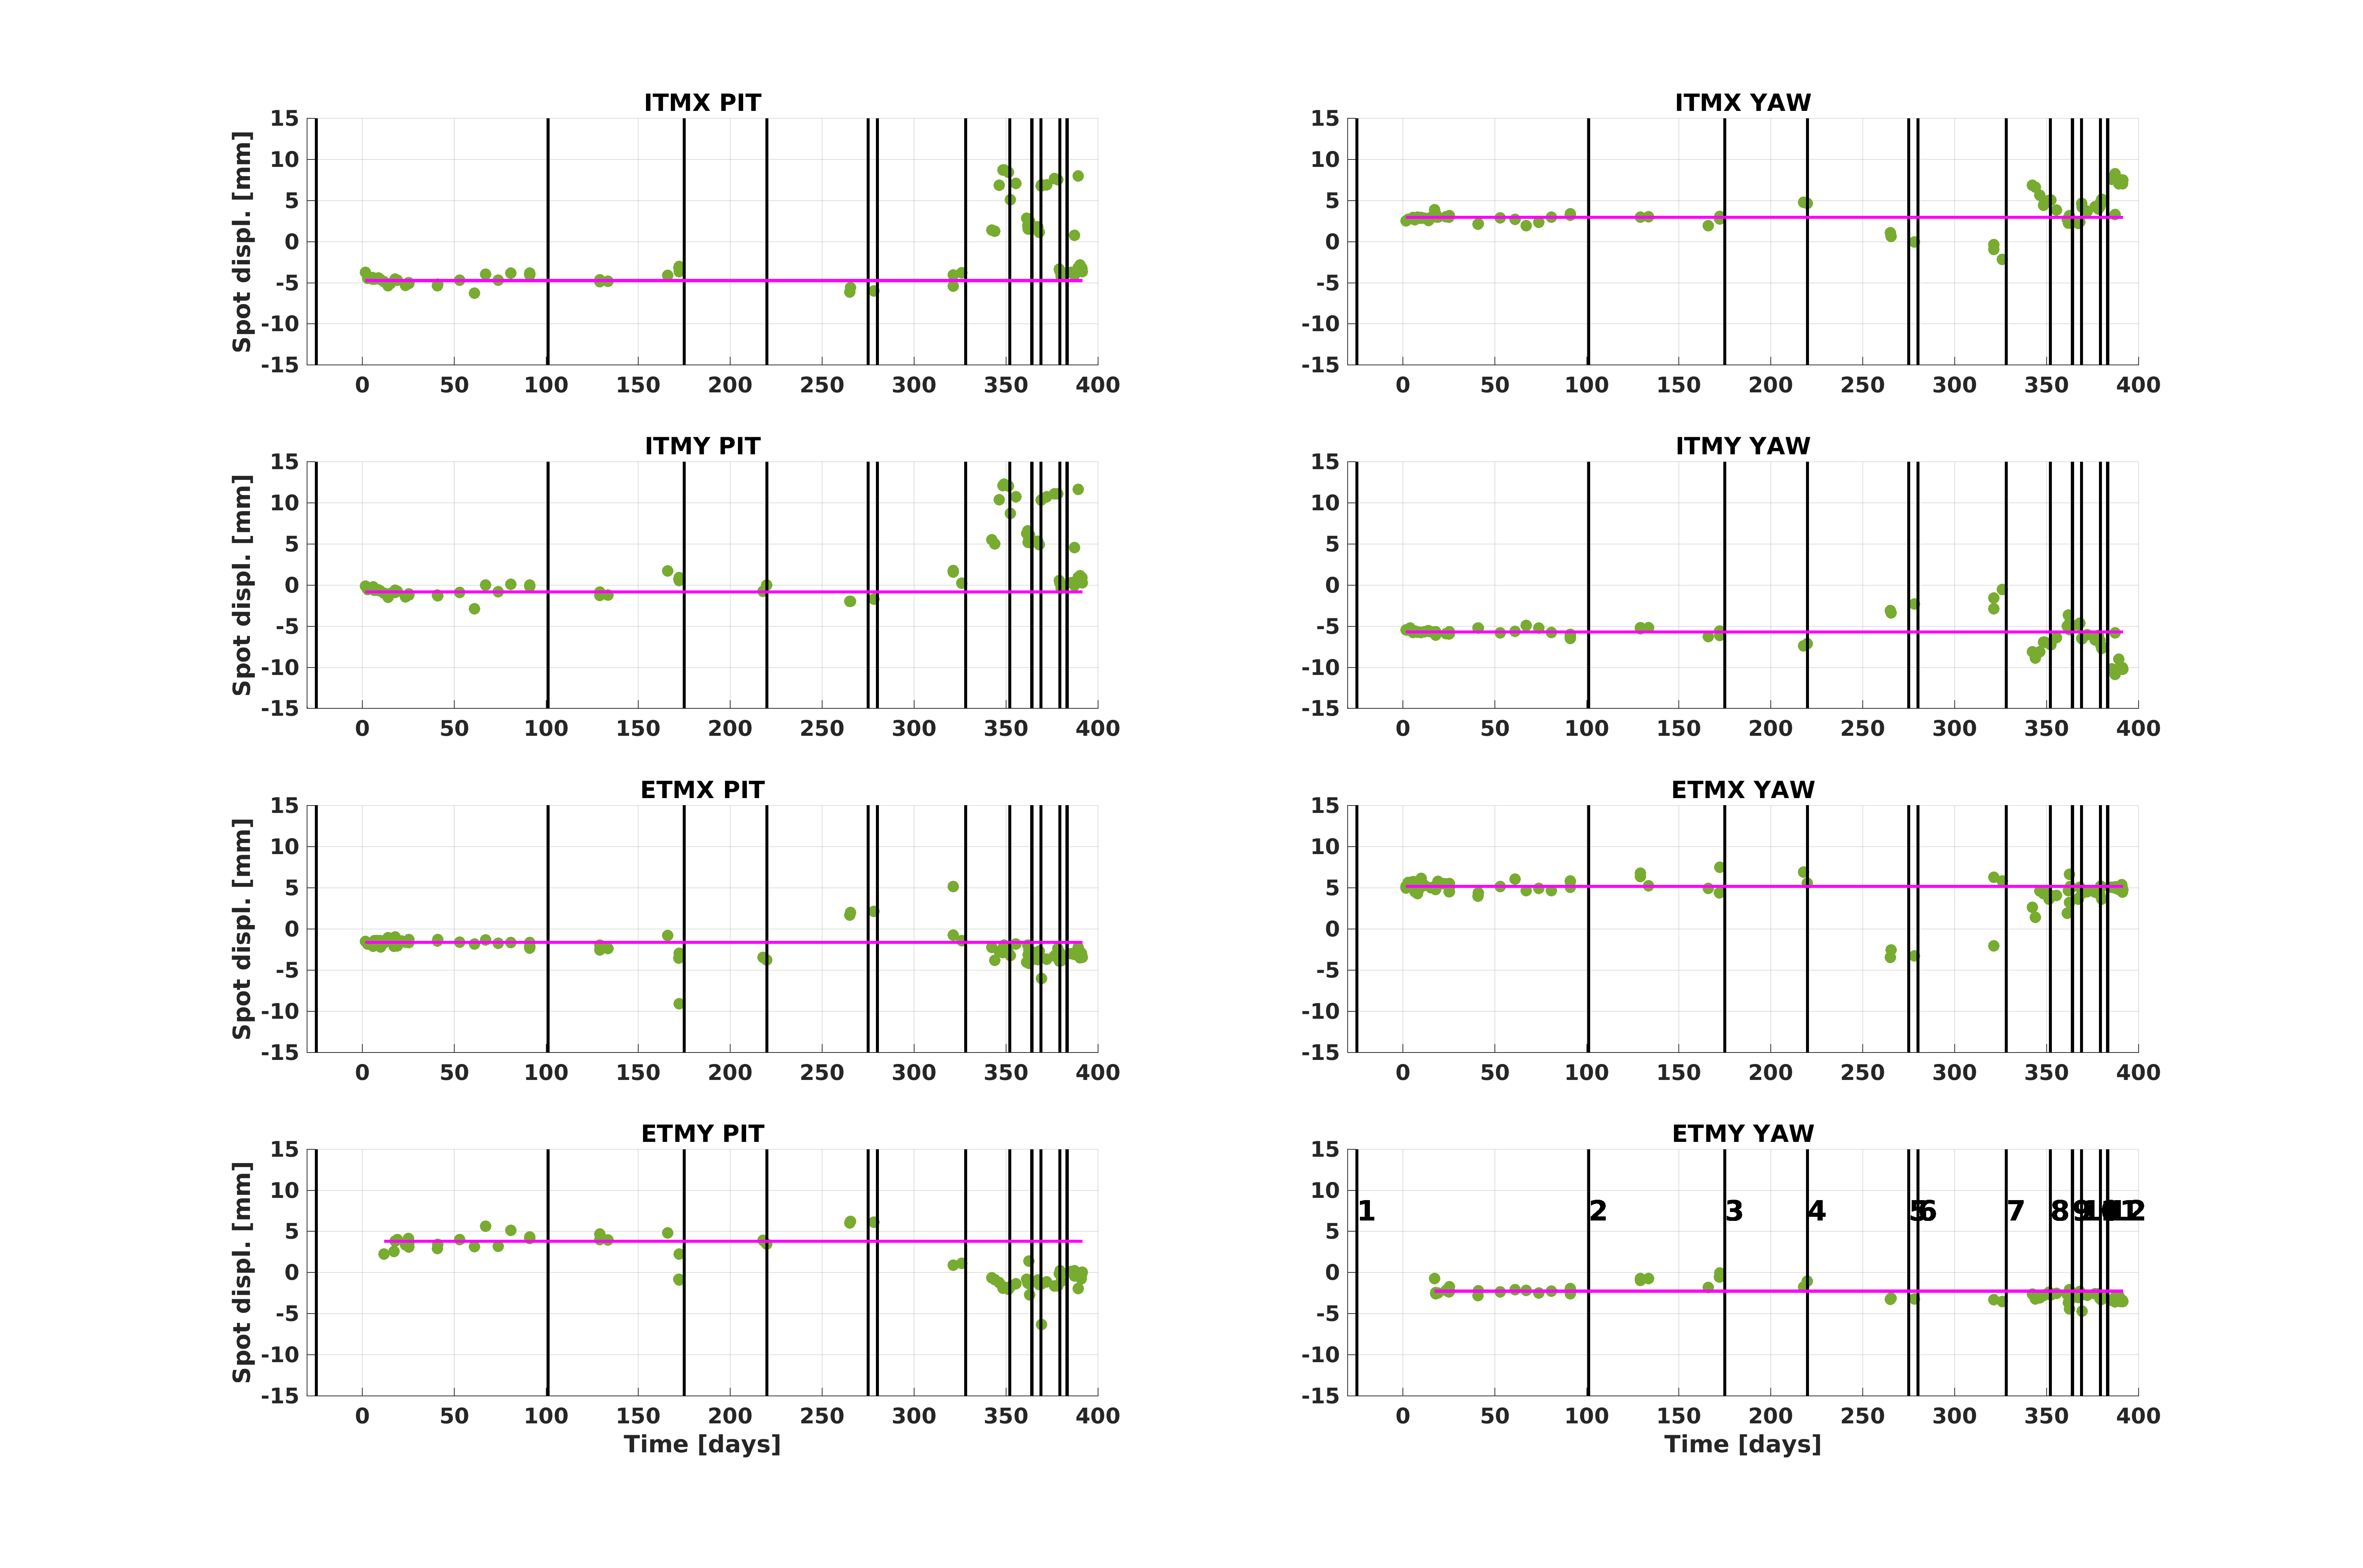
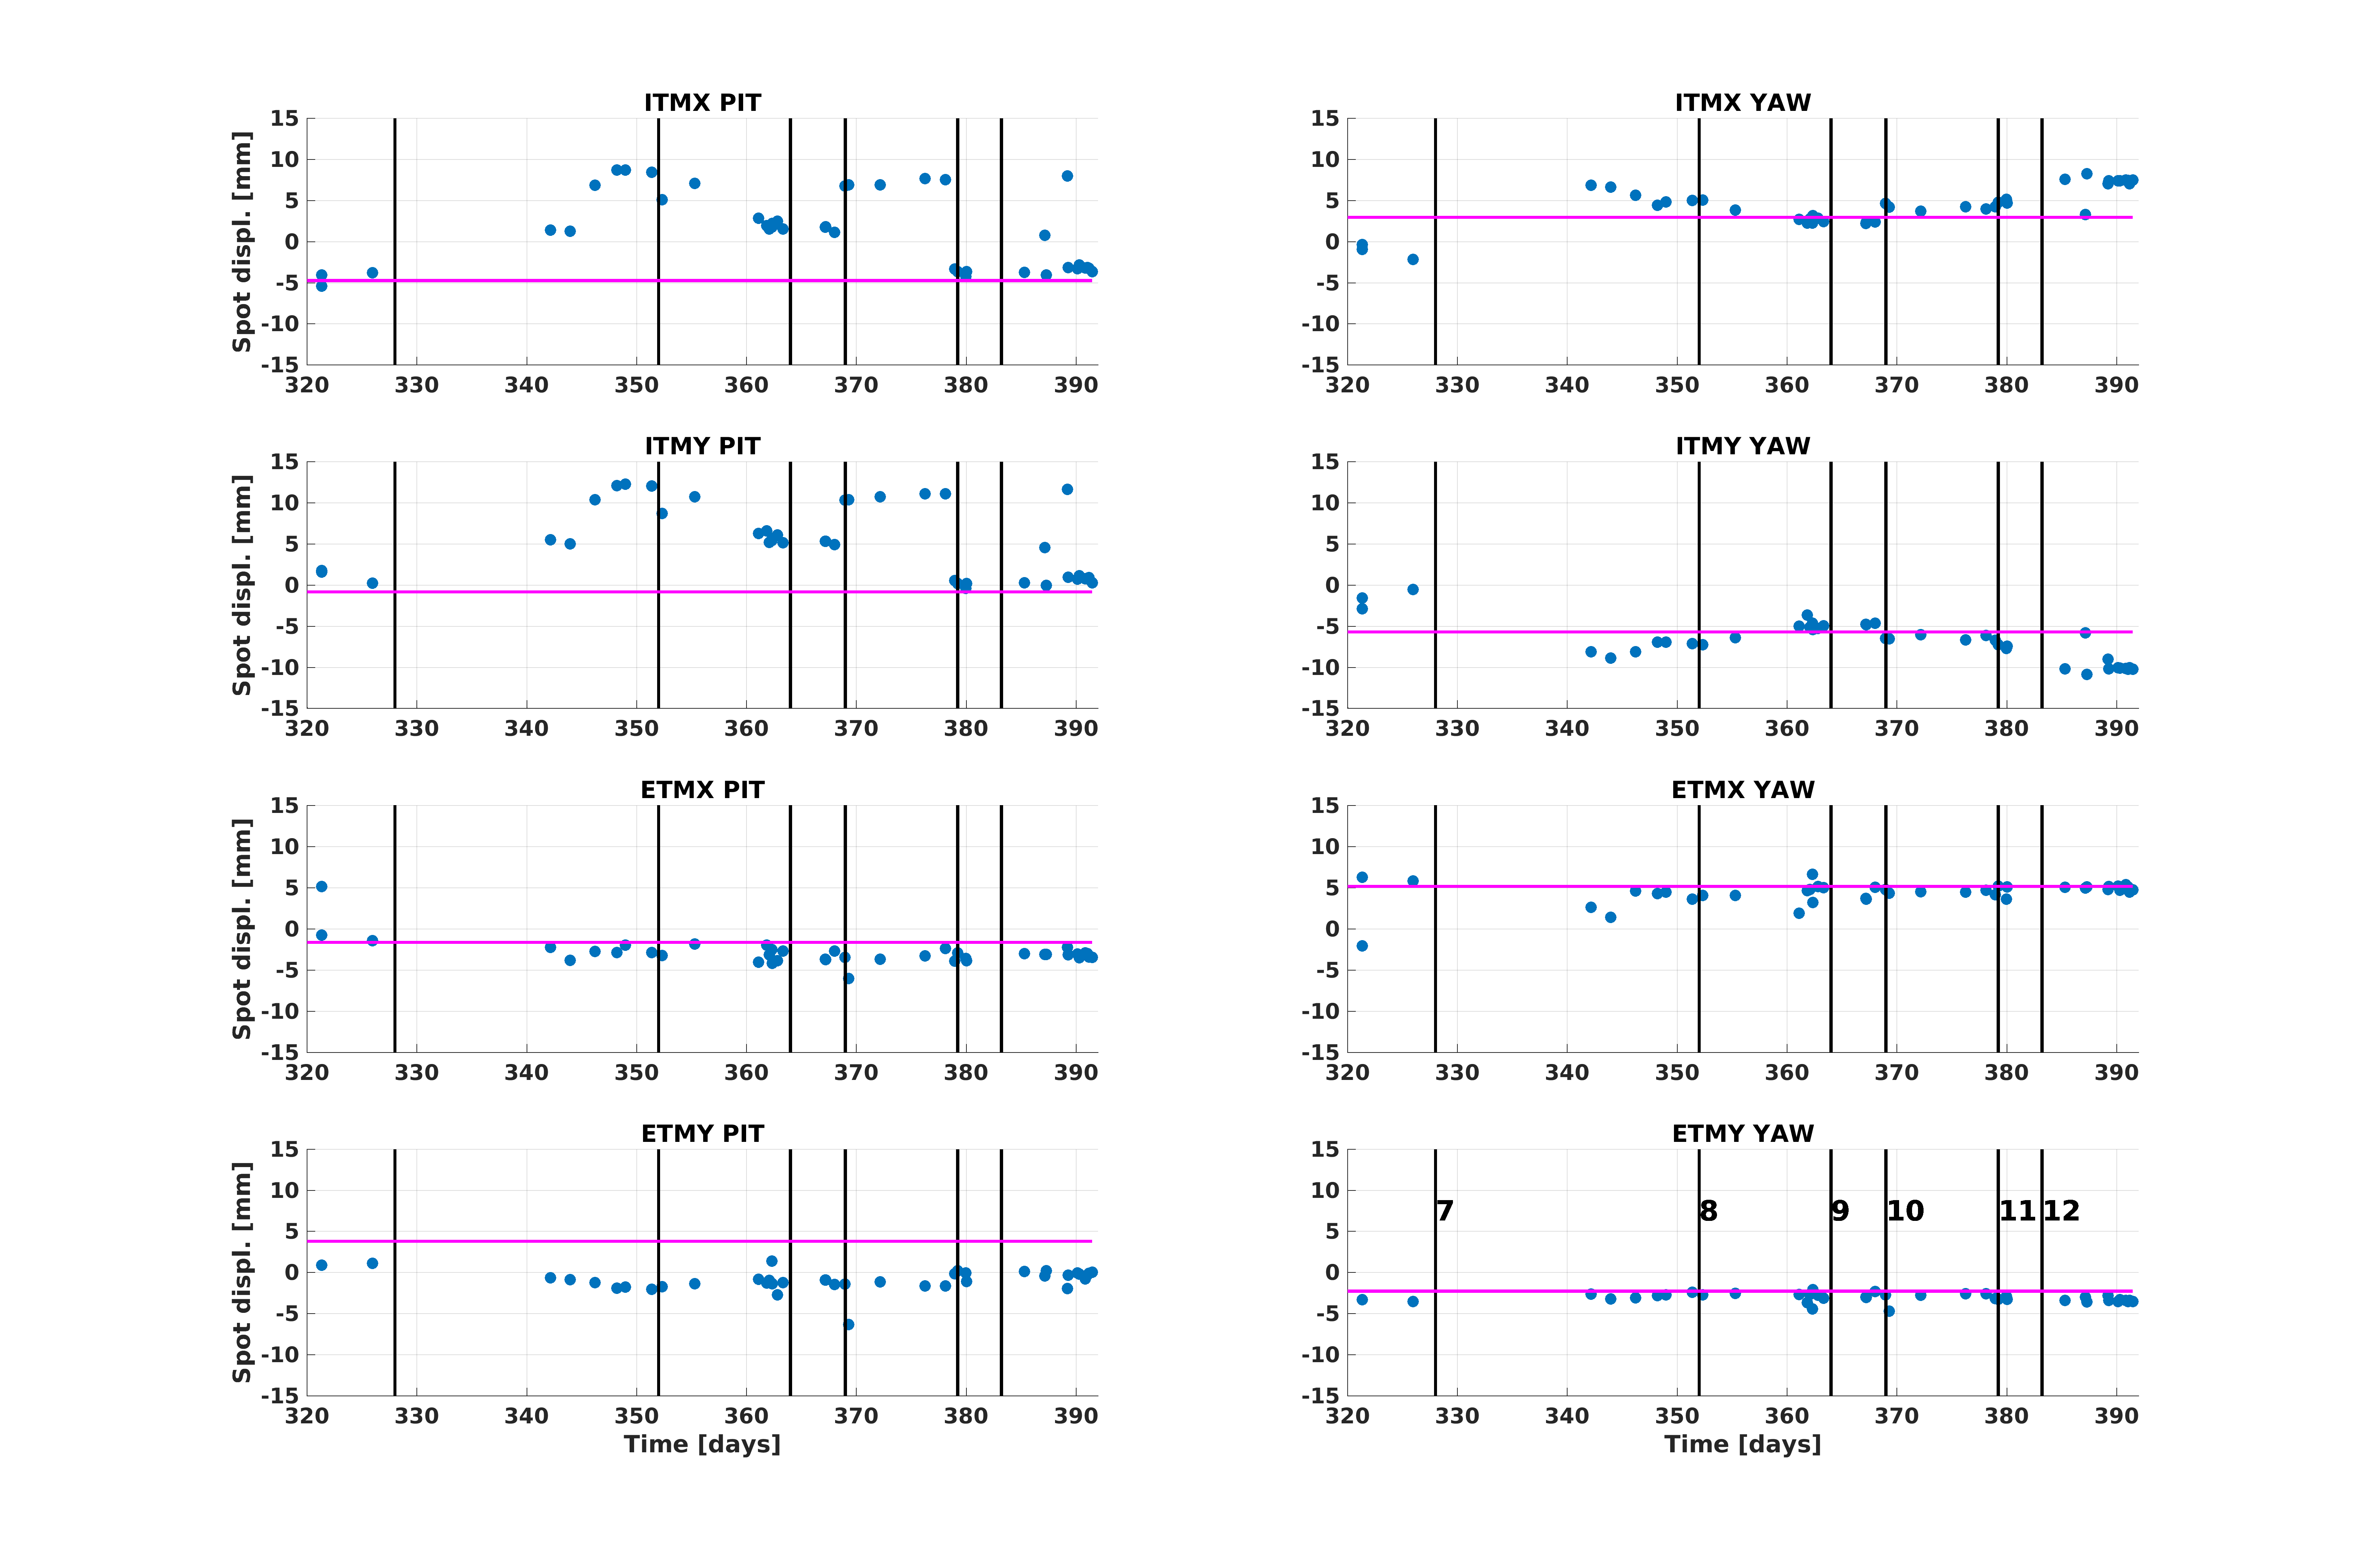
The second plot adds to this a series of vertical lines of notable events, either for the IFO or for the alignment. The third plot is the same, but zoomed in to the last 75 days.
The lines are from the following "events":
- 2015-09-15 00:00:00 (start of O1)
- 2016-01-19 00:00:00 (end of O1)
- 2016-04-02 00:00:00 (no HPO, but after HAM1 grouting work and subsequent realignment)
- 2016-05-17 00:00:00 (first lock with the HPO)
- 2016-07-11 00:00:00 (ER9 end)
- 2016-07-16 00:00:00 (Good July spectrum from Sheila's G1602240)
- 2016-09-02 00:00:00 (Big POP_A offset move, resetting of initial alignment setpoints, to improve 50W recycling gain)
- 2016-09-26 00:00:00 (Moved IMs closer to their O1 OSEM values, trying to keep rest of IFO alignment roughly constant)
- 2016-10-08 00:00:00 (Bad October spectrum from Sheila's G1602240)
- 2016-10-13 00:00:00 (Moved POP_A and SOFT offsets again to improve 50W recycling gain more)
- 2016-10-23 05:25:00 (TCS and alignment settings back to July values)
- 2016-10-27 05:00:00 (Alignment recovery after PSL shift - IM3 now close to actuation edge)
You can see that after #7 many of our spot positions moved pretty significantly, although they continued to move after event 7 and I just didn't find / remember an event to explain this specifically. But, we'd been doing lots of alignment searching during that time. Also, after #11 when we went back to our July TCS and alignment values our spot positions largely went back to where they were before the big POP_A move. We could try more to get closer to the O1 spots, and that may be somewhat helpful. Food for thought.