Our operators have been running A2L a lot lately, so I've started looking at the spot positions that we infer from those measurements.
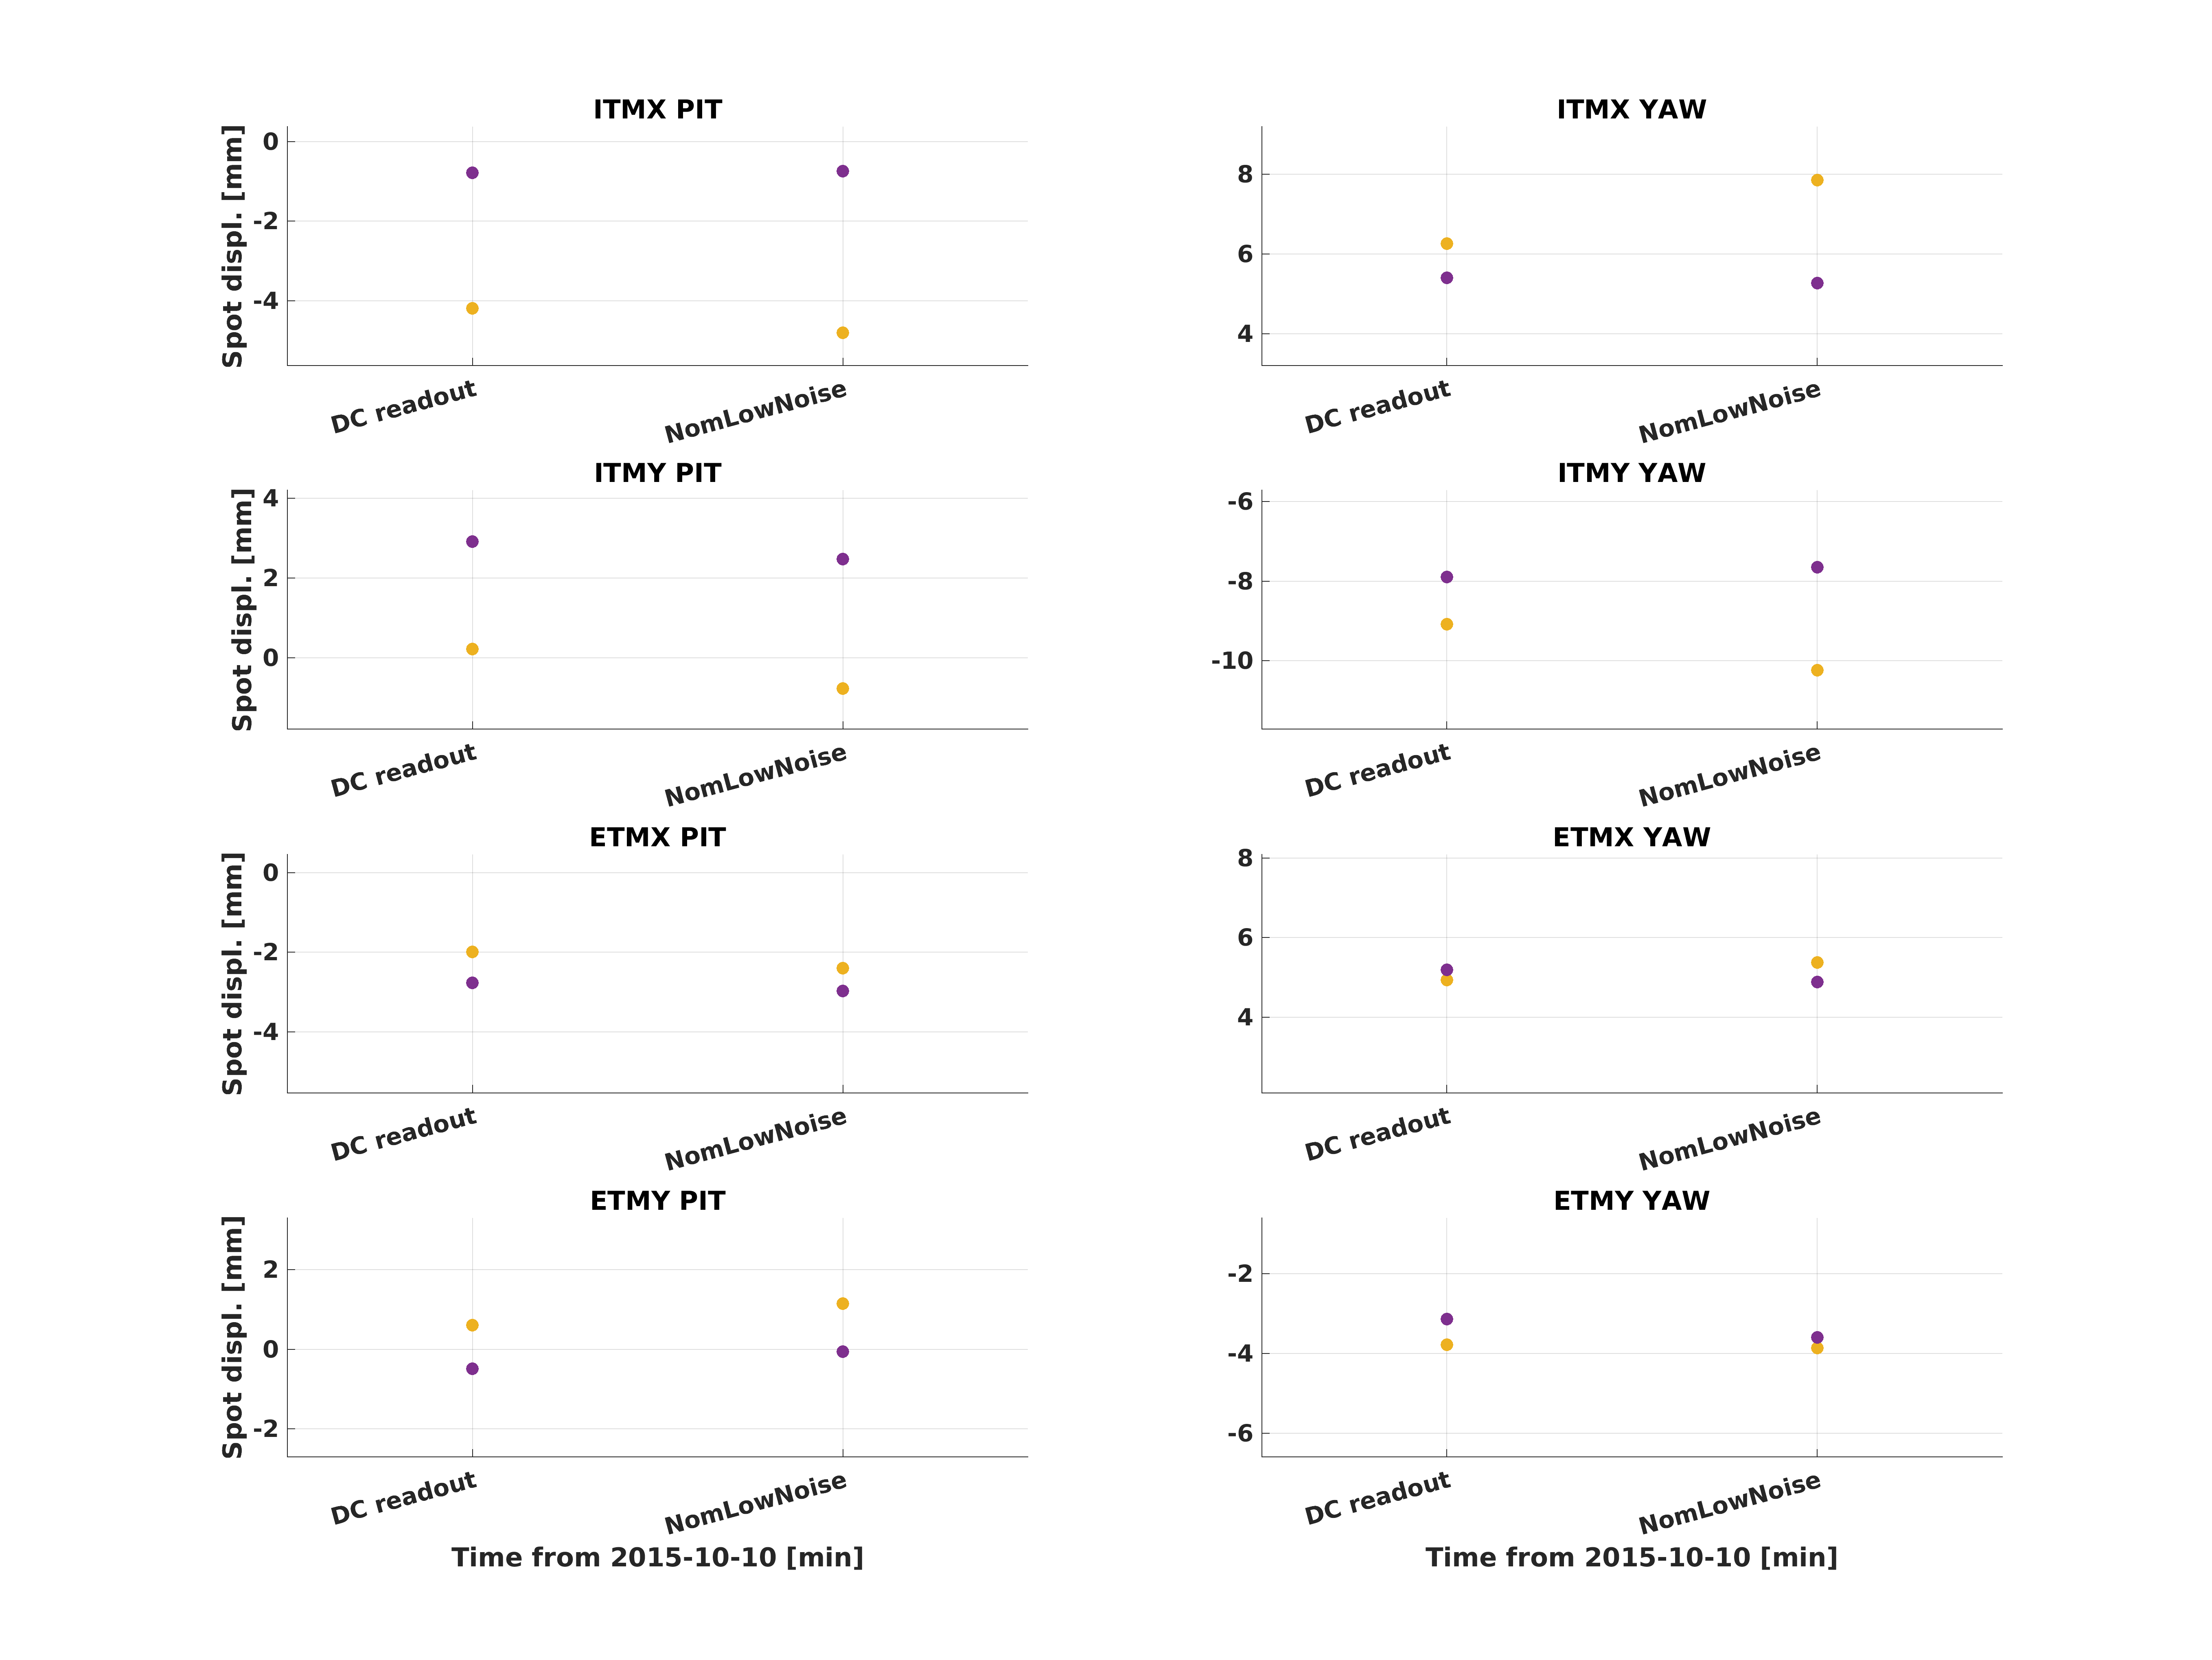
Sheila asked specifically for a comparison of our spot positions at DC readout versus NomLowNoise. I took the times from Cheryl's alog 31630, and Nutsinee's alog 31647 and plot the spot positions in the first plot. Yellow points are those from 19 Nov 2016, 00:30:00-00:01:00, and Purple are those from 19 Nov 2016 15:10:00-15:40:00. The Xaxis is labeled with the interferometer state at the time, DC readout or NomLowNoise. I think that Sheila may have done some alignment work (alog 31628) in between these times, which is why they're not consistent between these two locks. ITMY changes in a very different way between the two locks, but the rest of the optics and degrees of freedom at least move in the same way when we power-up, even if the start or stop positions aren't the same.
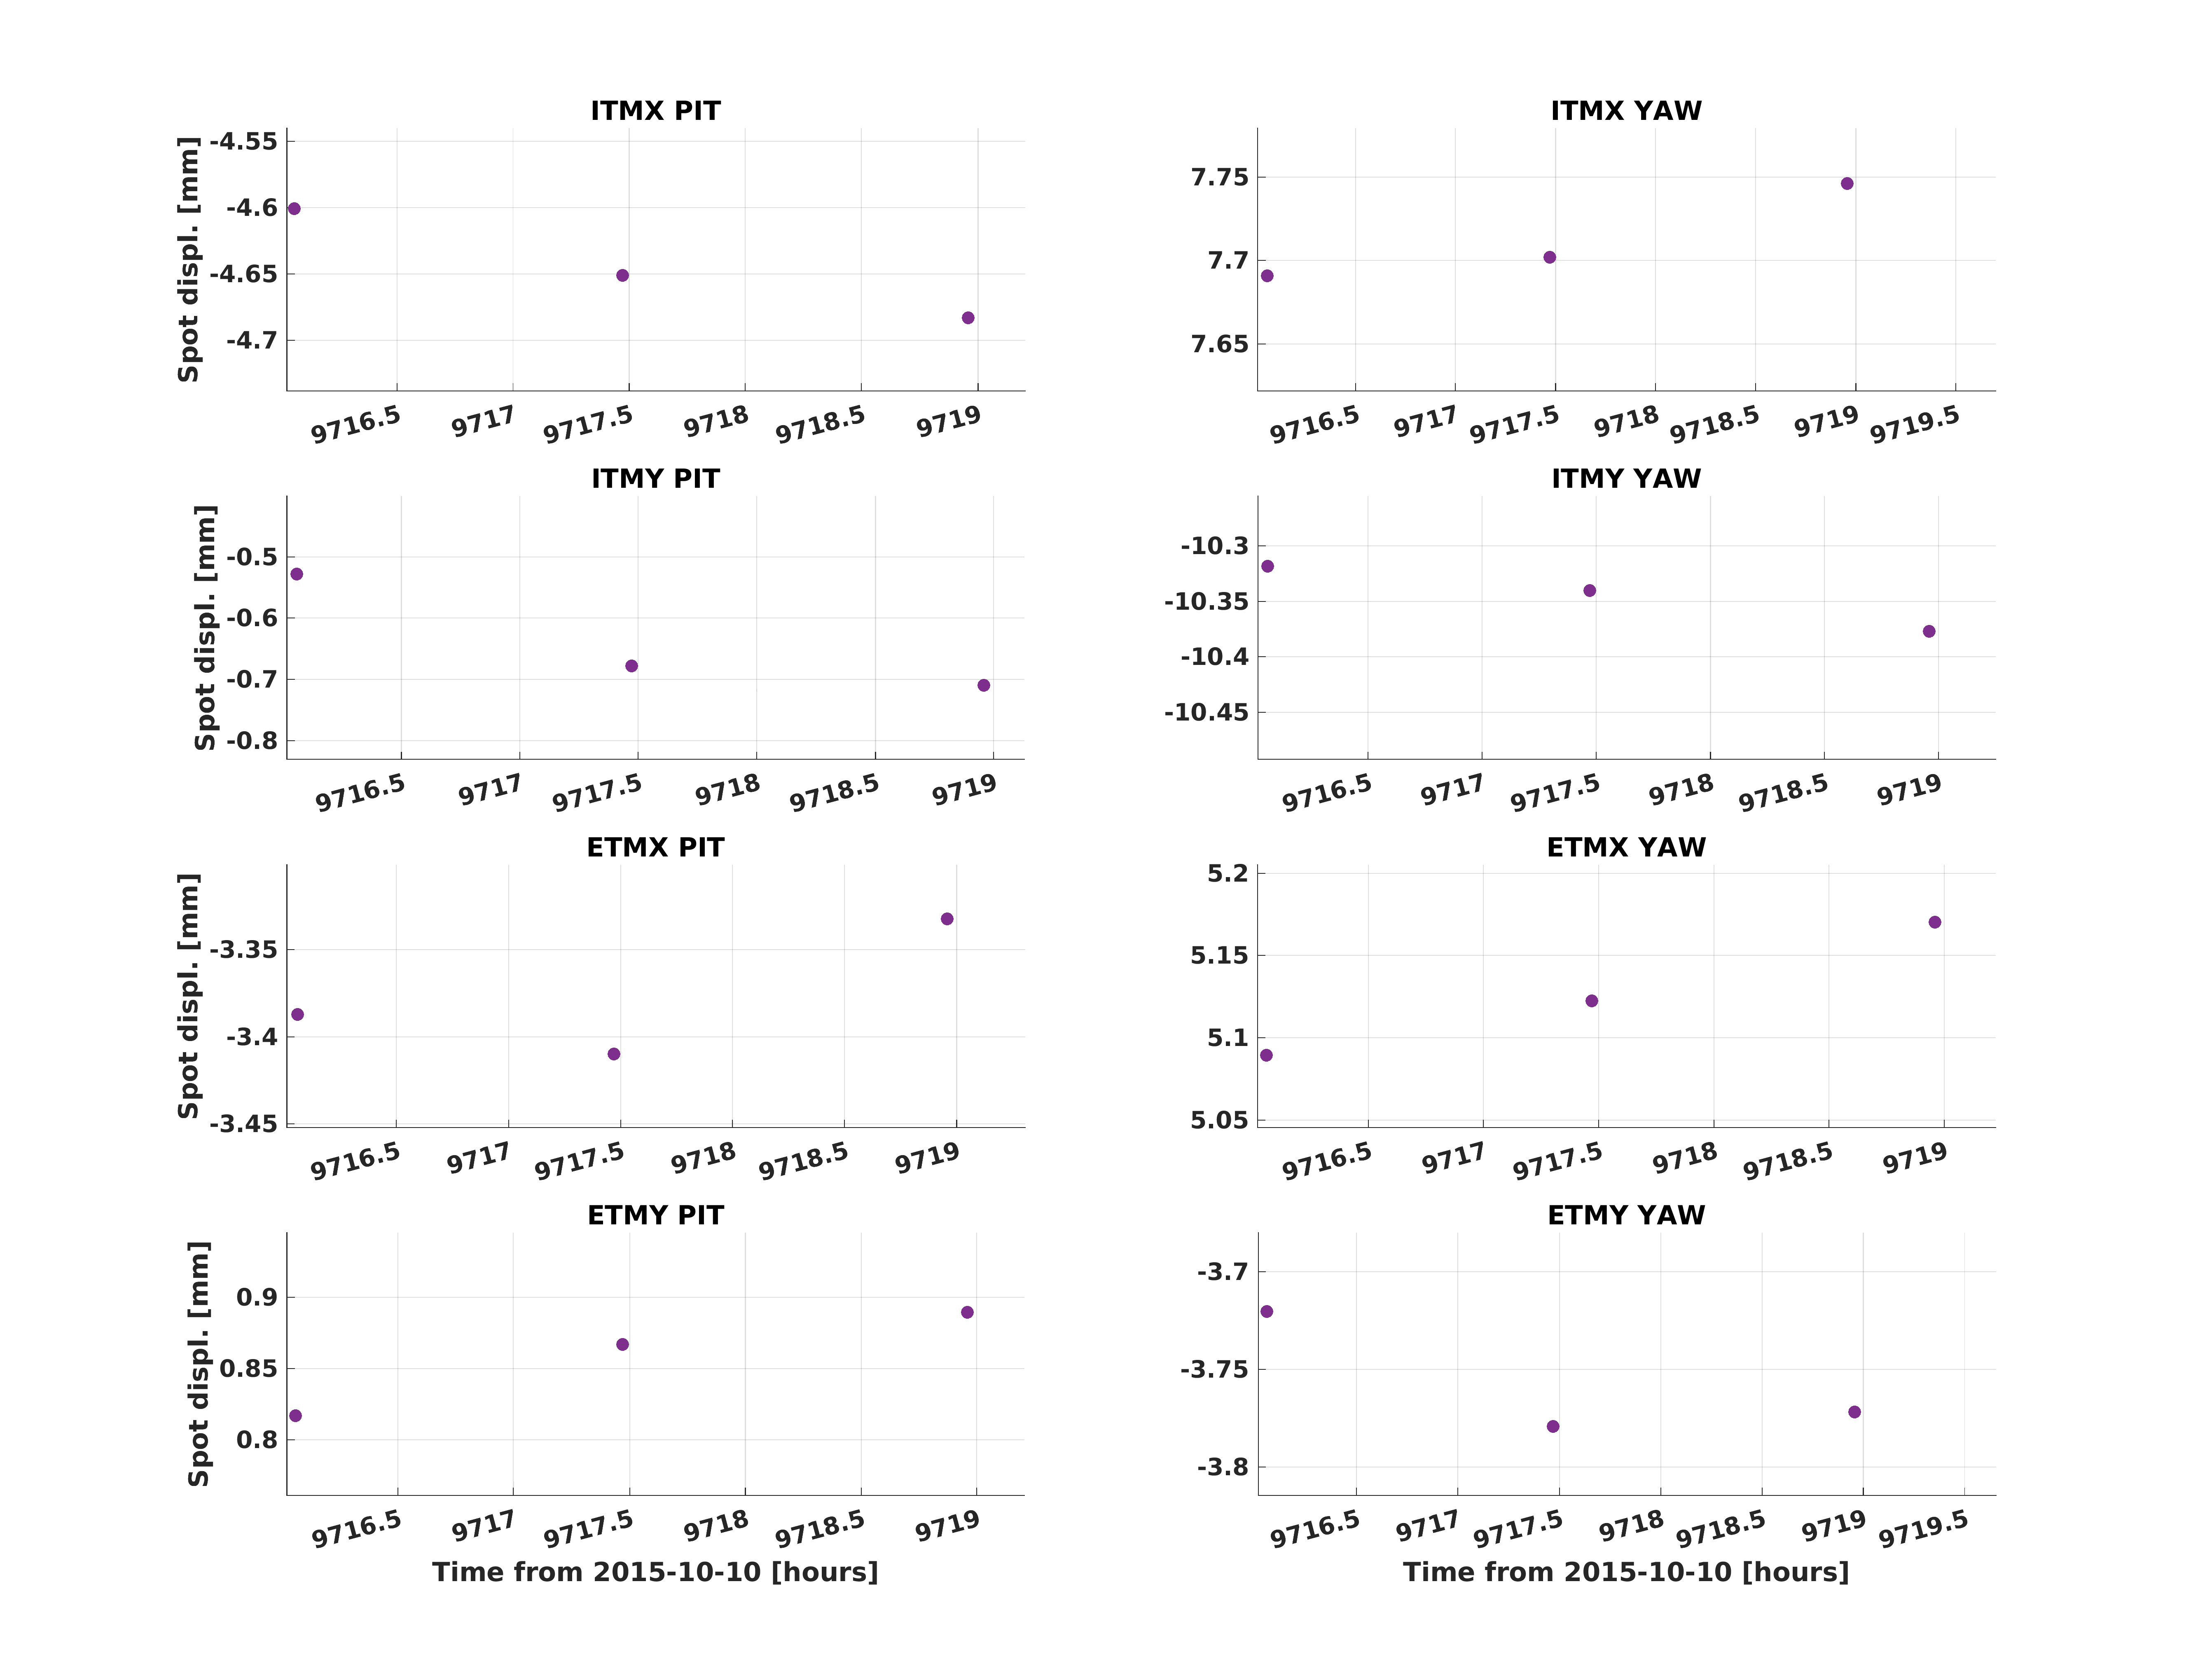
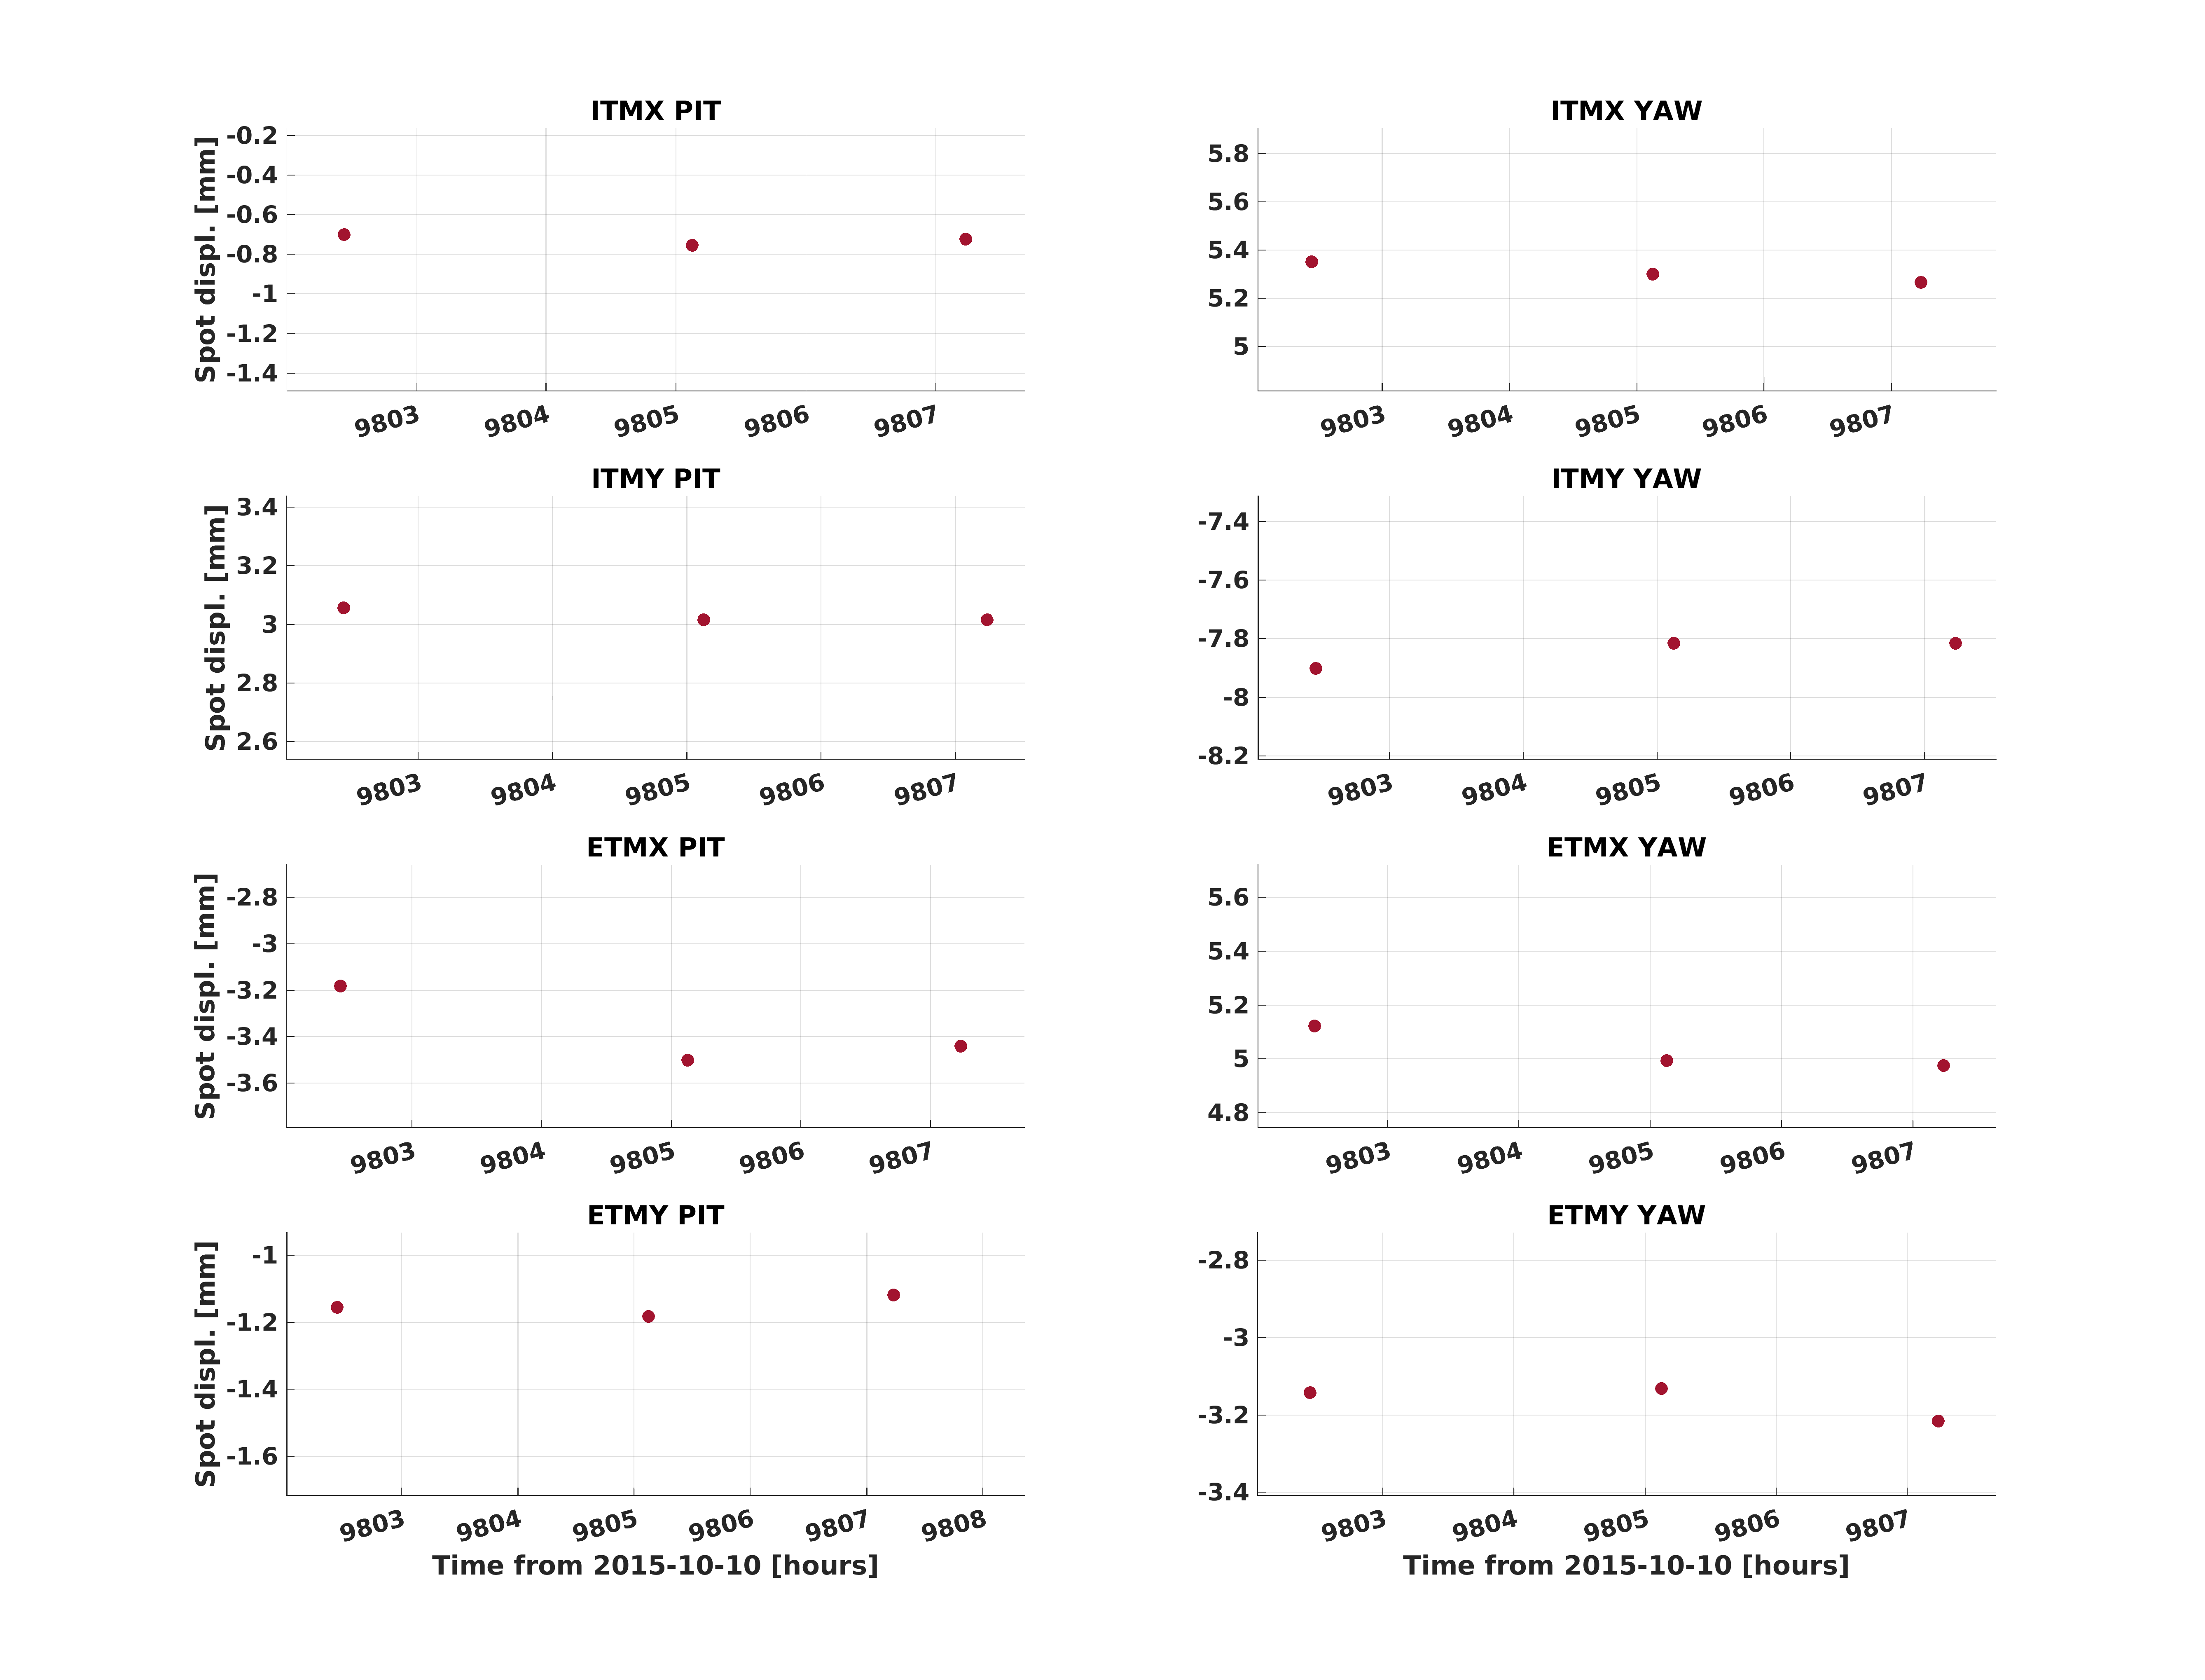
I have also plotted two times when our operators ran A2L several times over a single lock stretch. alog 31560 is from 17 Nov, and alog 31678 is from 21 Nov. The dates are in the figure names attached. As we had seen during O1, if the IFO is left alone, the spots on the test masses do not change with time very significantly. The Xaxes are hours from the first time A2L was run, back in October 2015, but you get the idea that each measurement is 60-90 minutes apart. I've zoomed the scales pretty significantly here, so note the Yaxes.
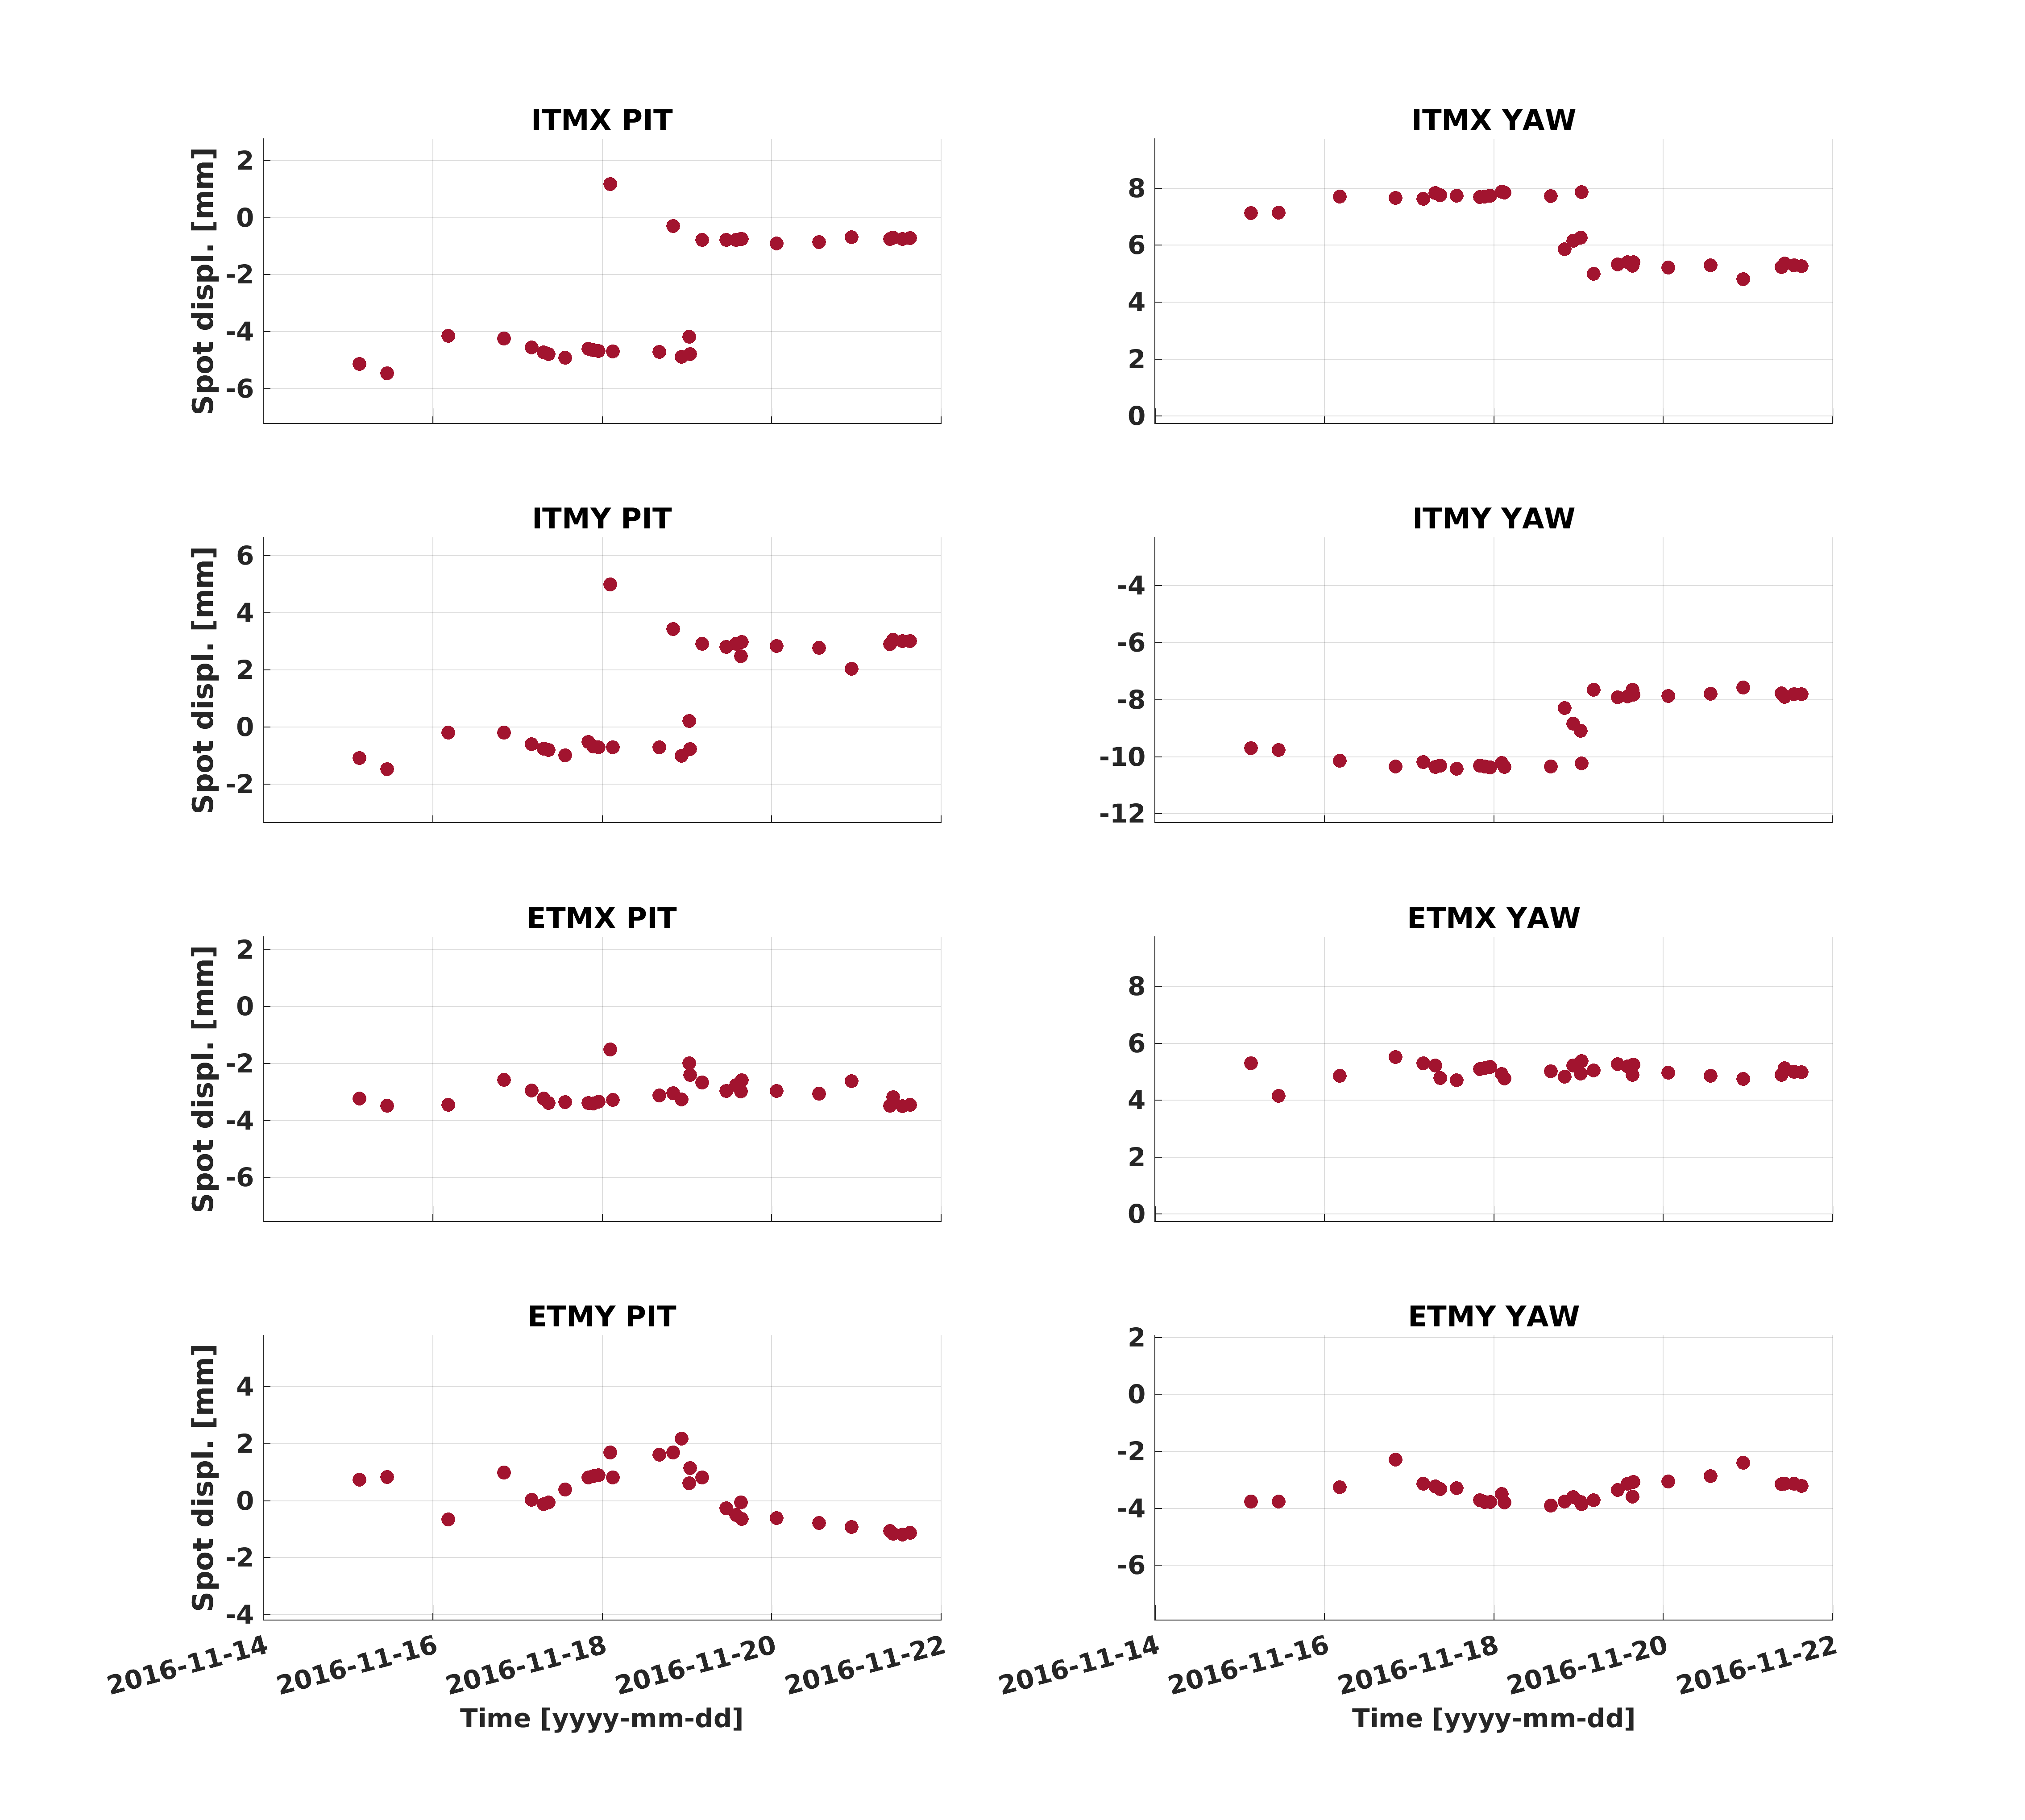
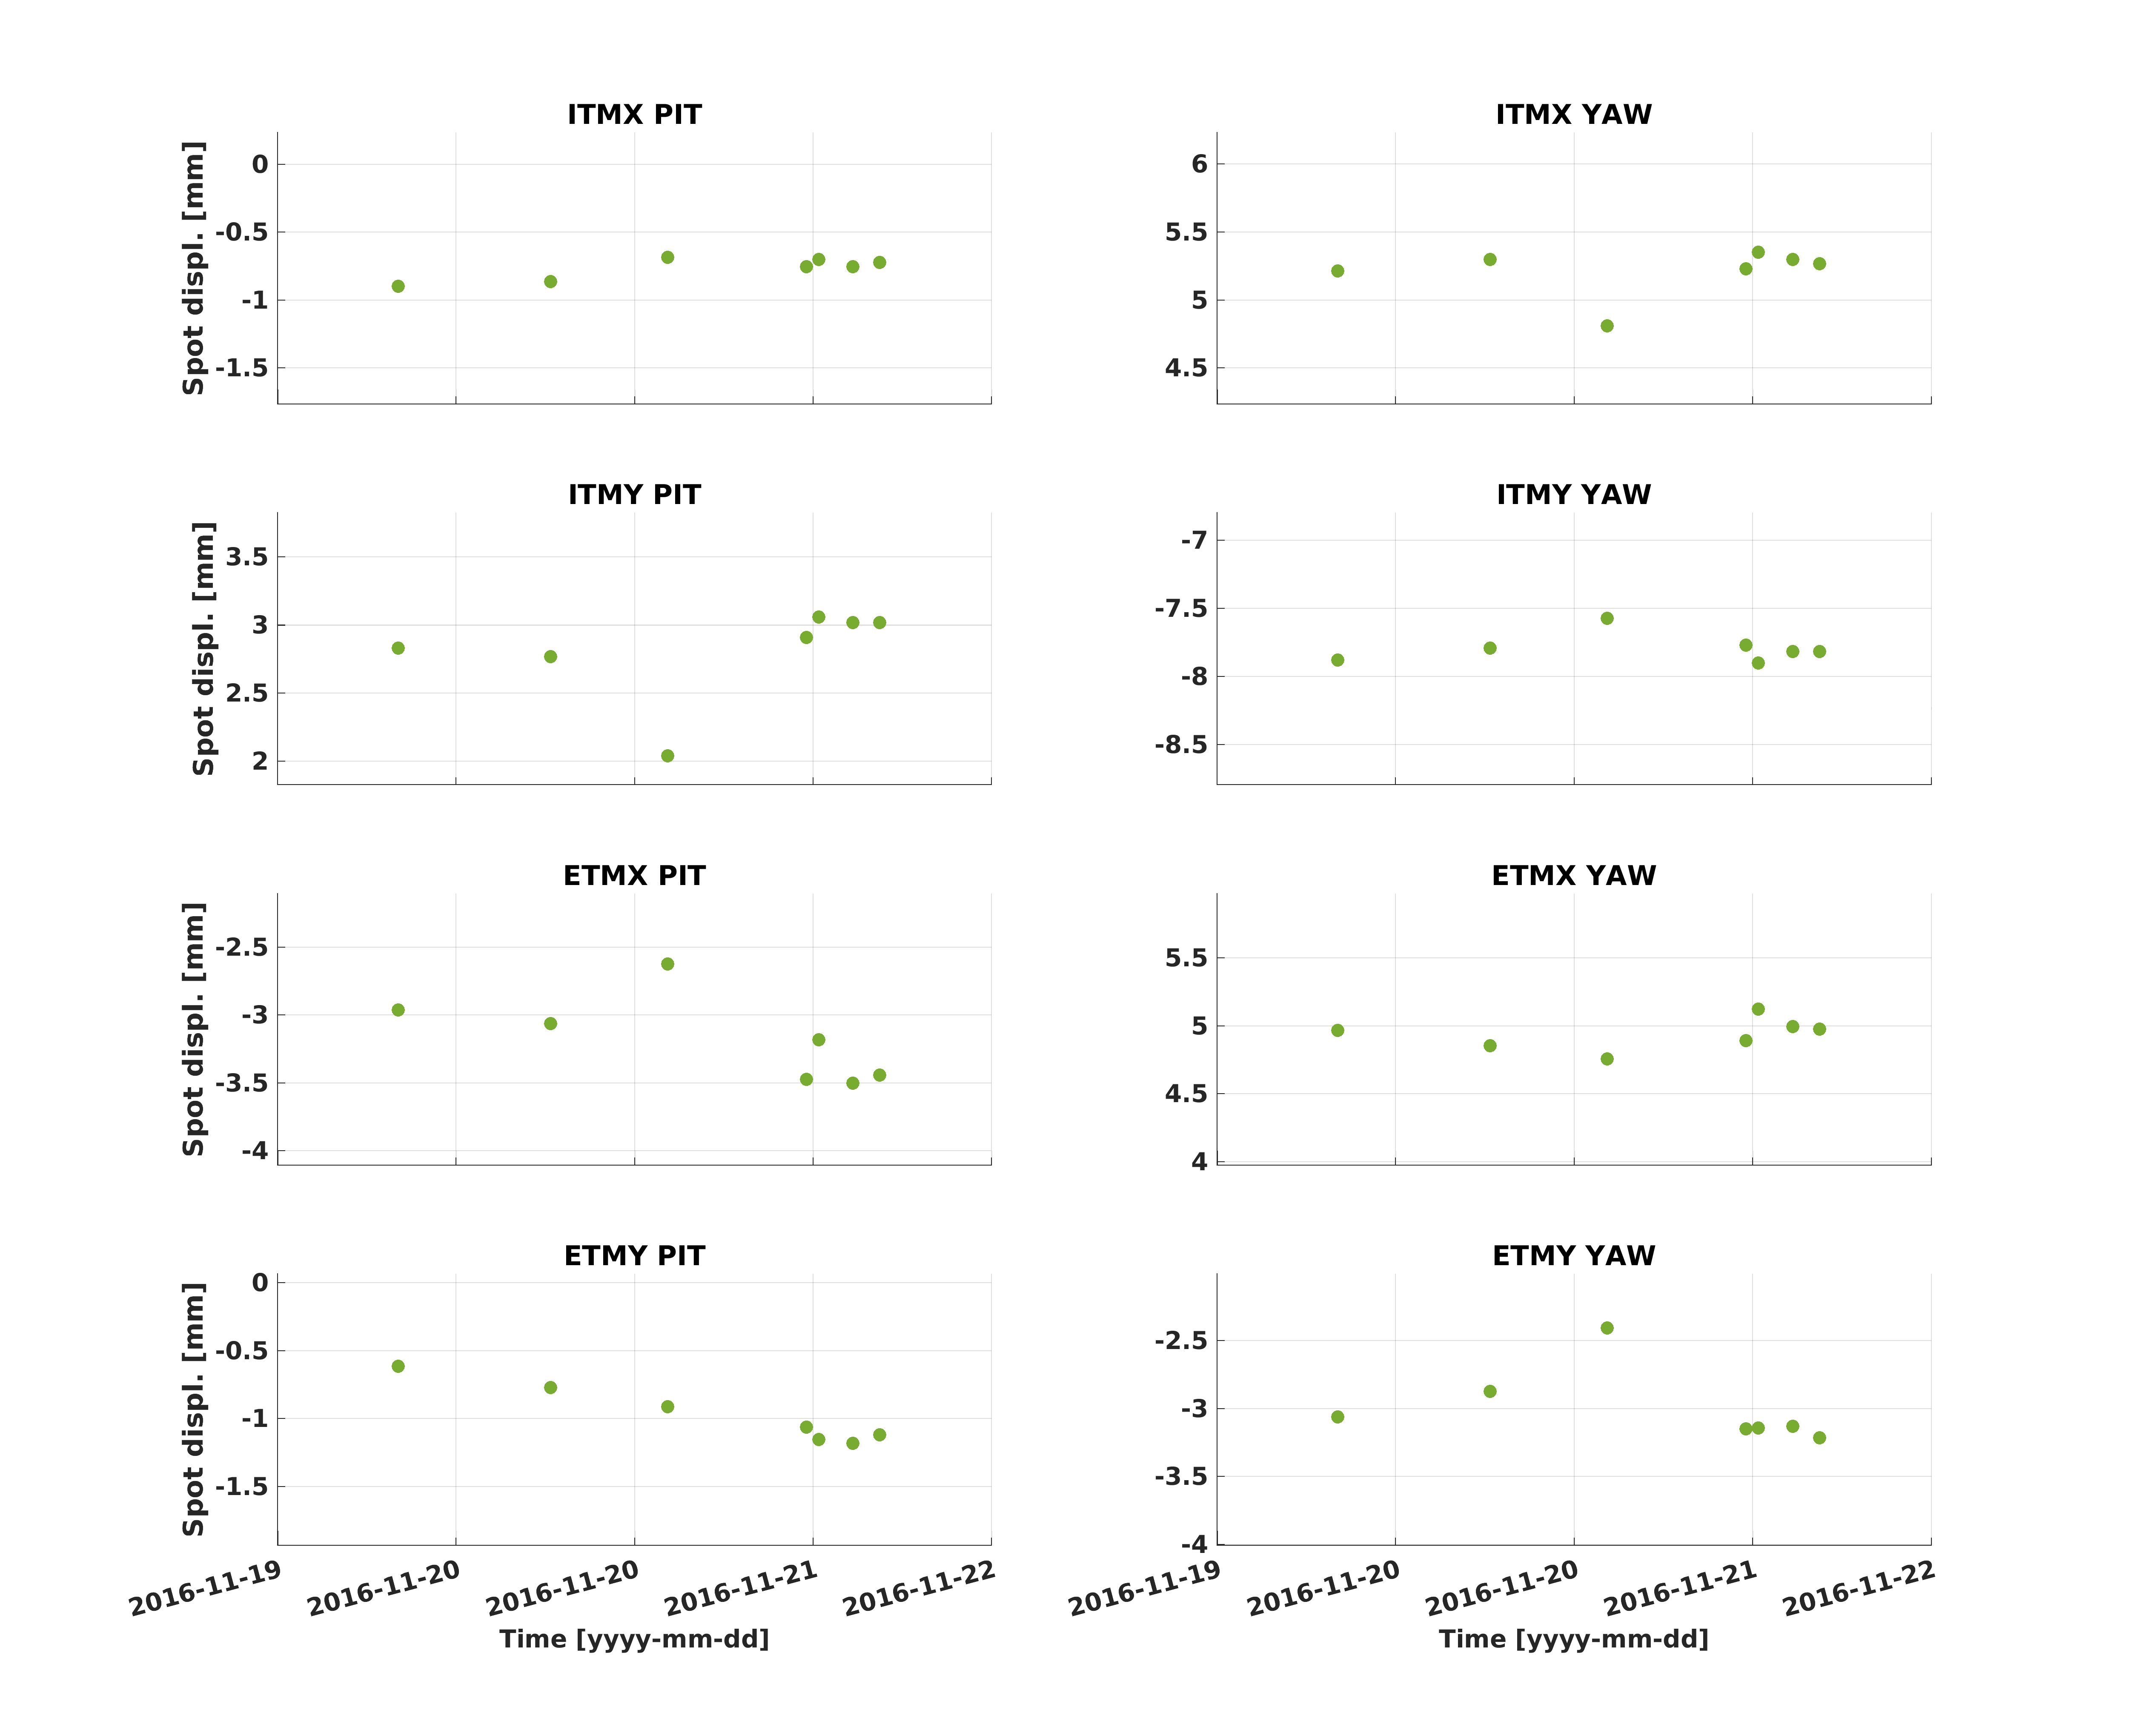
Finally, the last 2 plots are our spot positions since ER10 began on ~14 Nov 2016, and just the last few days, since our last big alignment work on Friday night. Once we stopped doing alignment work, we're becoming more consistent.
For Jeff: I also attach a .mat file with the spot positions in mm, along with the gps times of each measurement. The data is in 4x2 cells at each time:
| ITMX Pit | ITMX Yaw |
| ITMY Pit | ITMY Yaw |
| ETMX Pit | ETMX Yaw |
| ETMY Pit | ETMY Yaw |