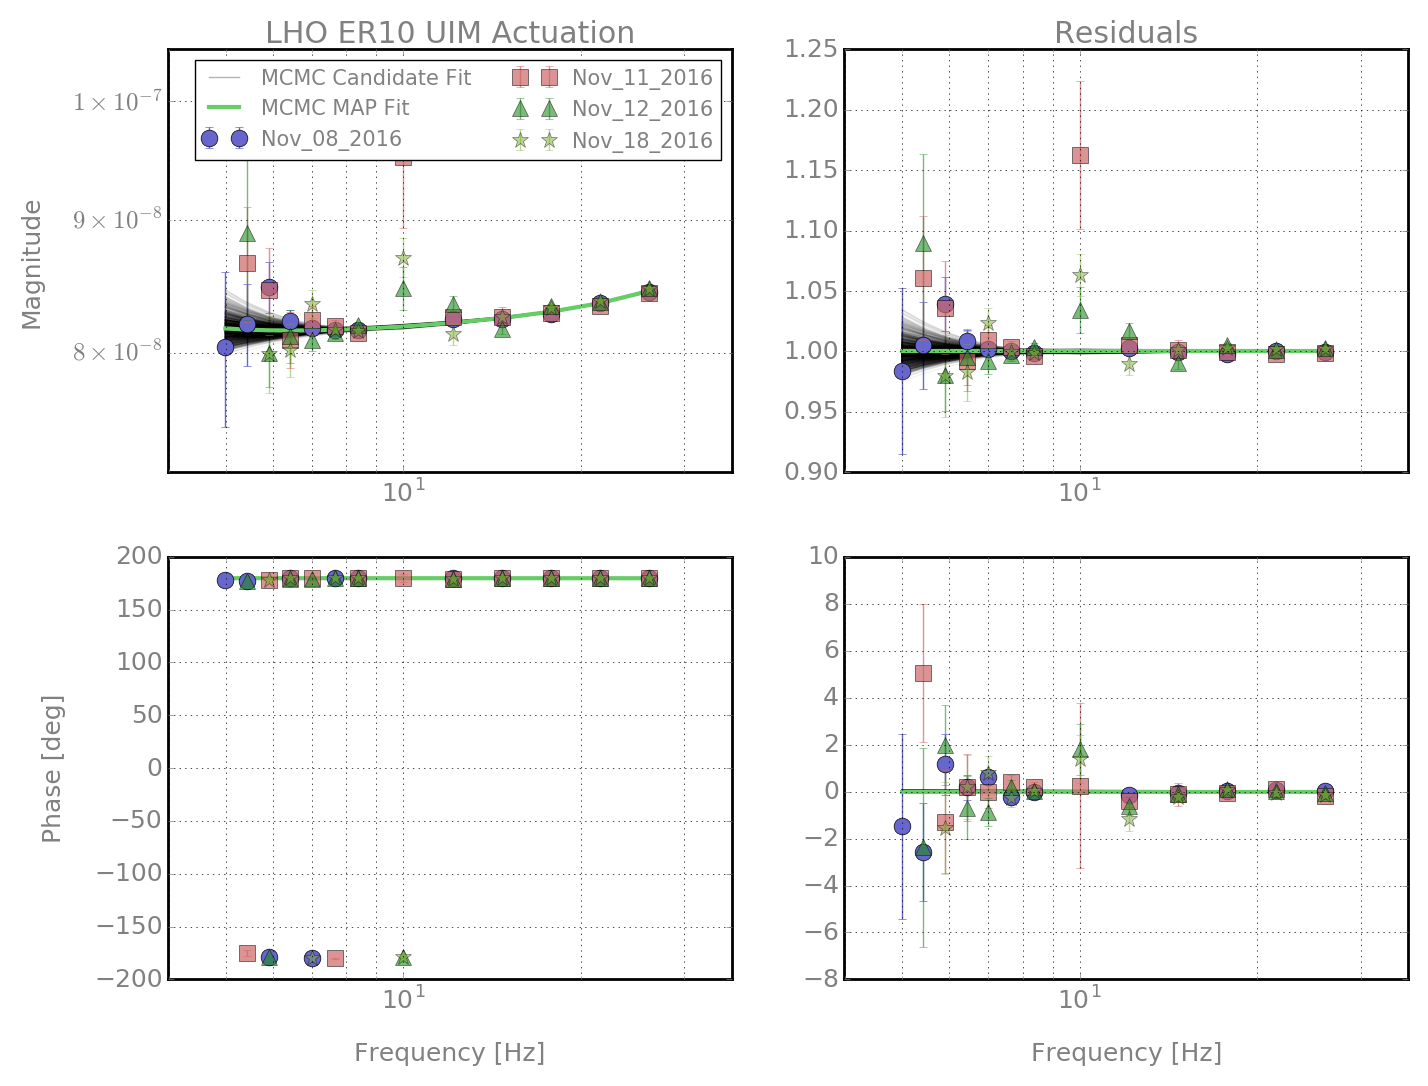
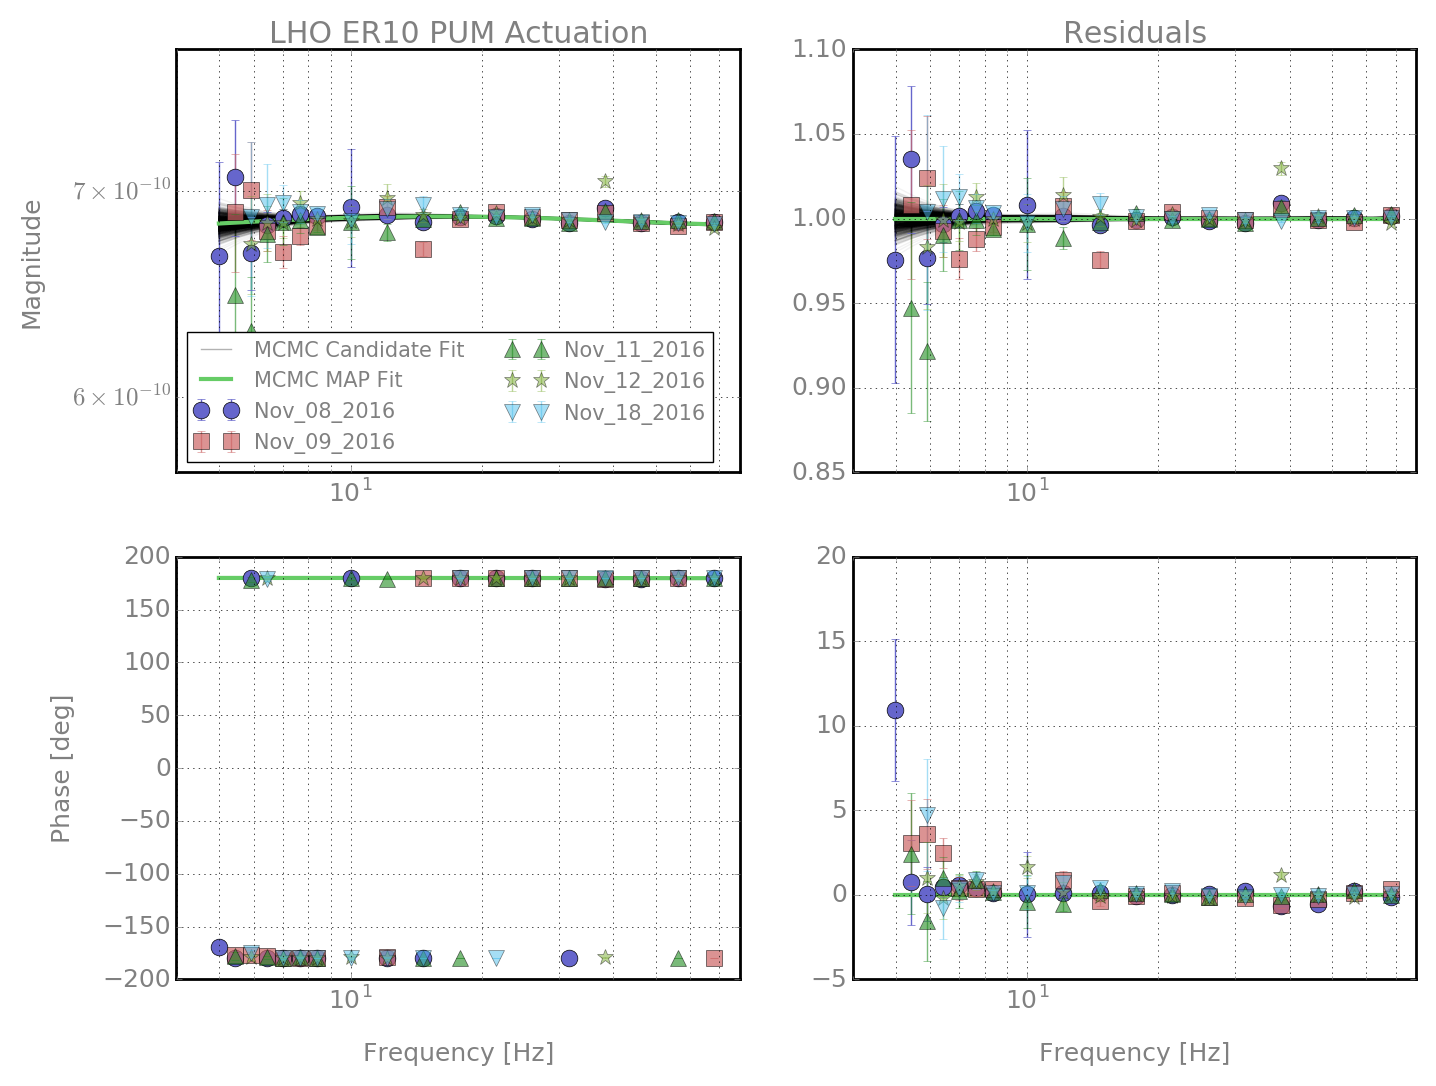
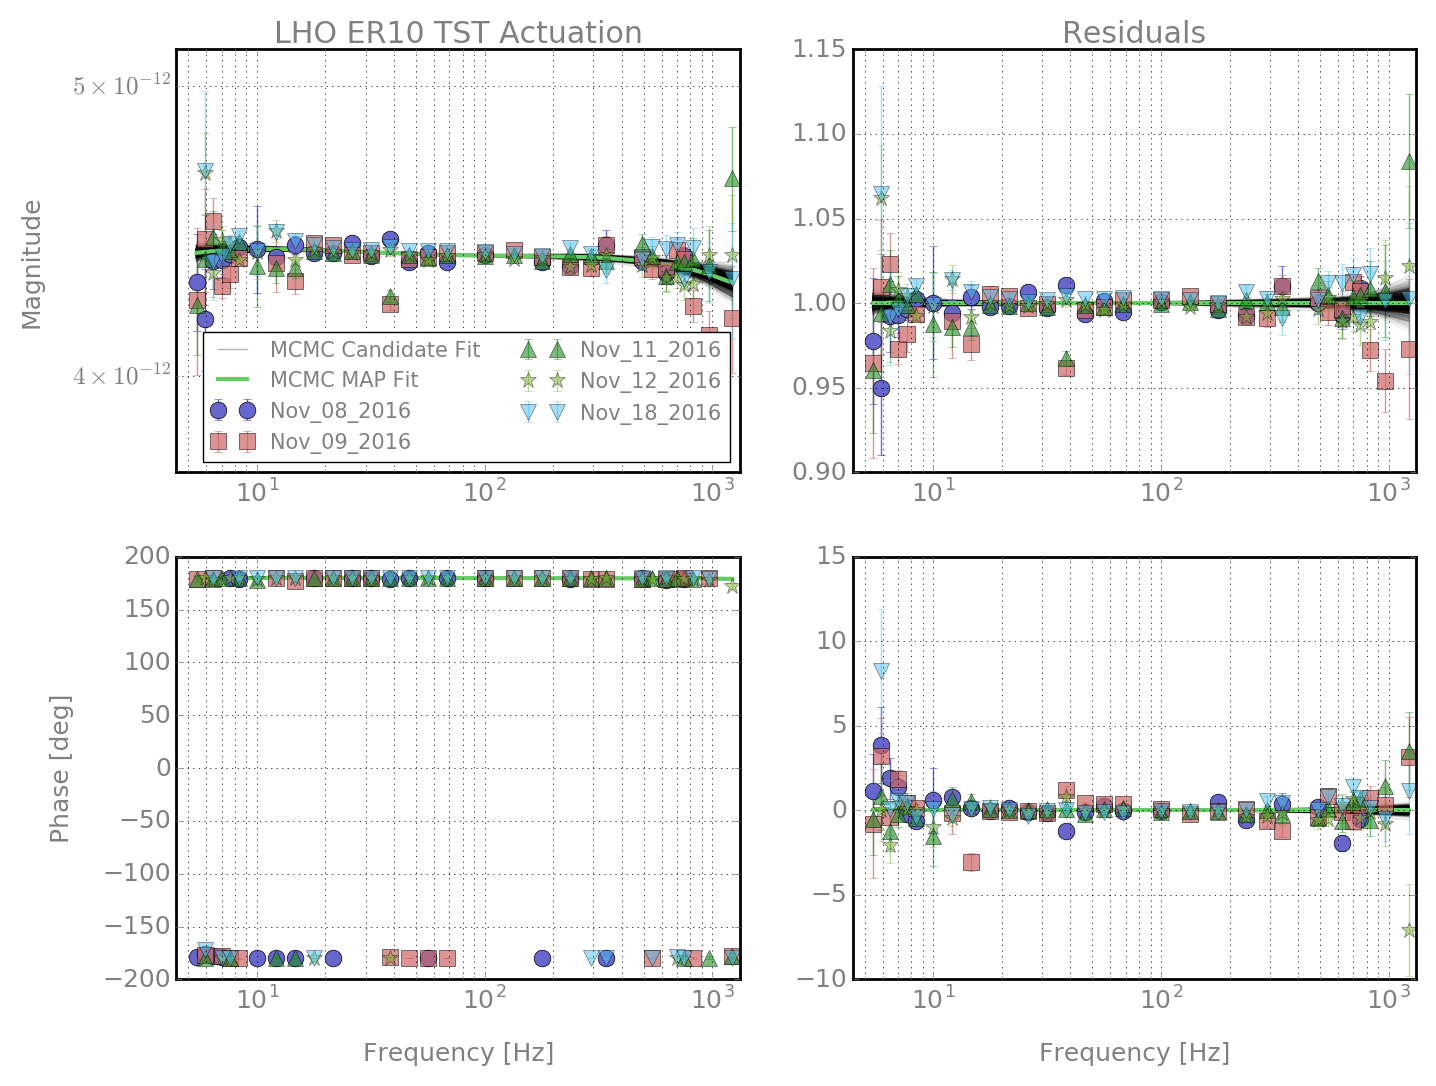
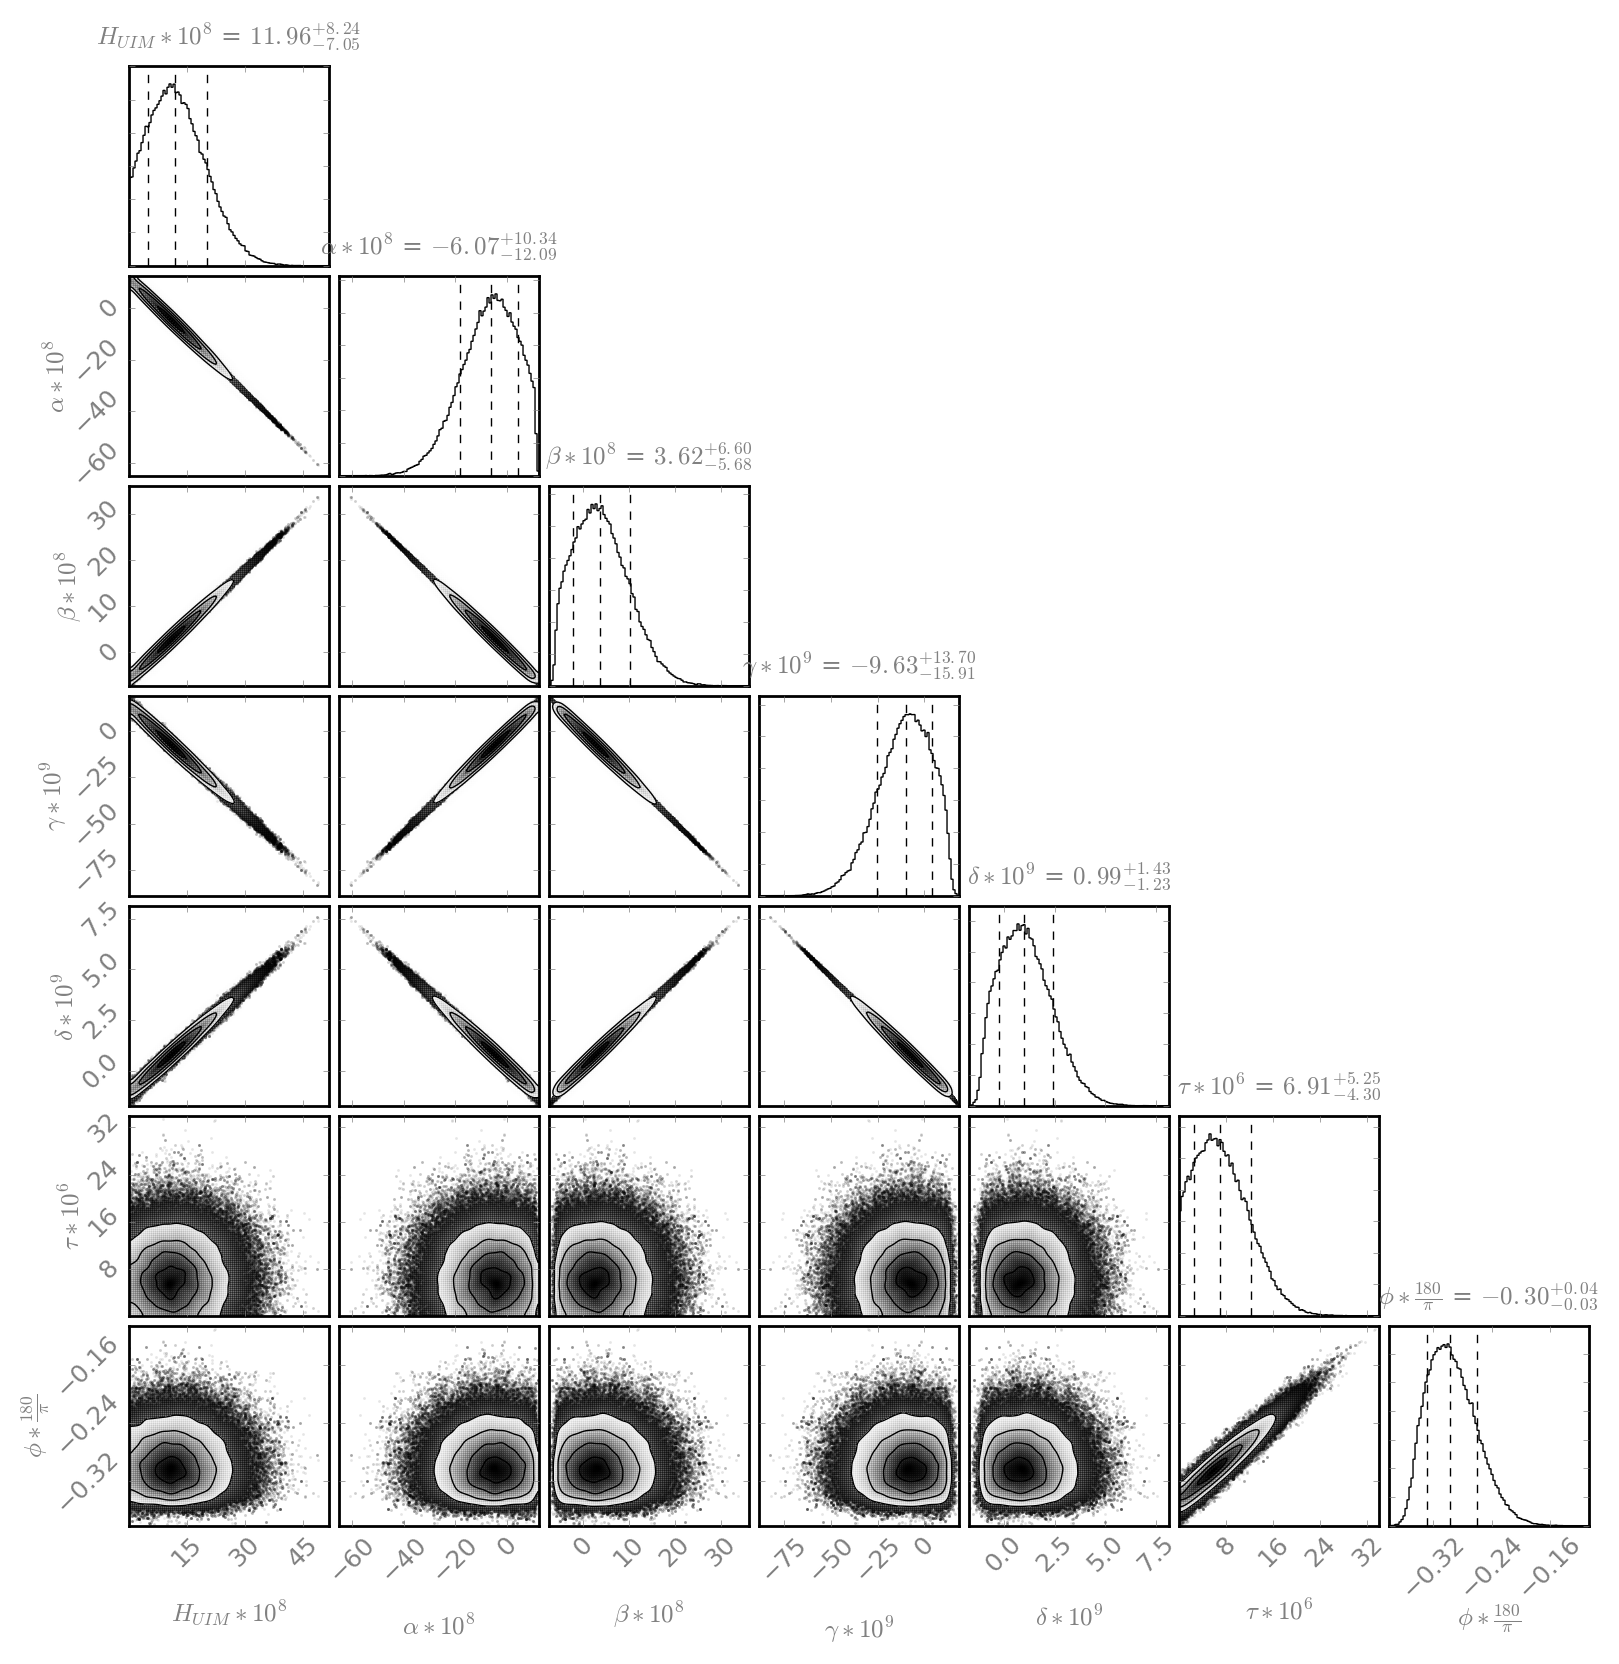
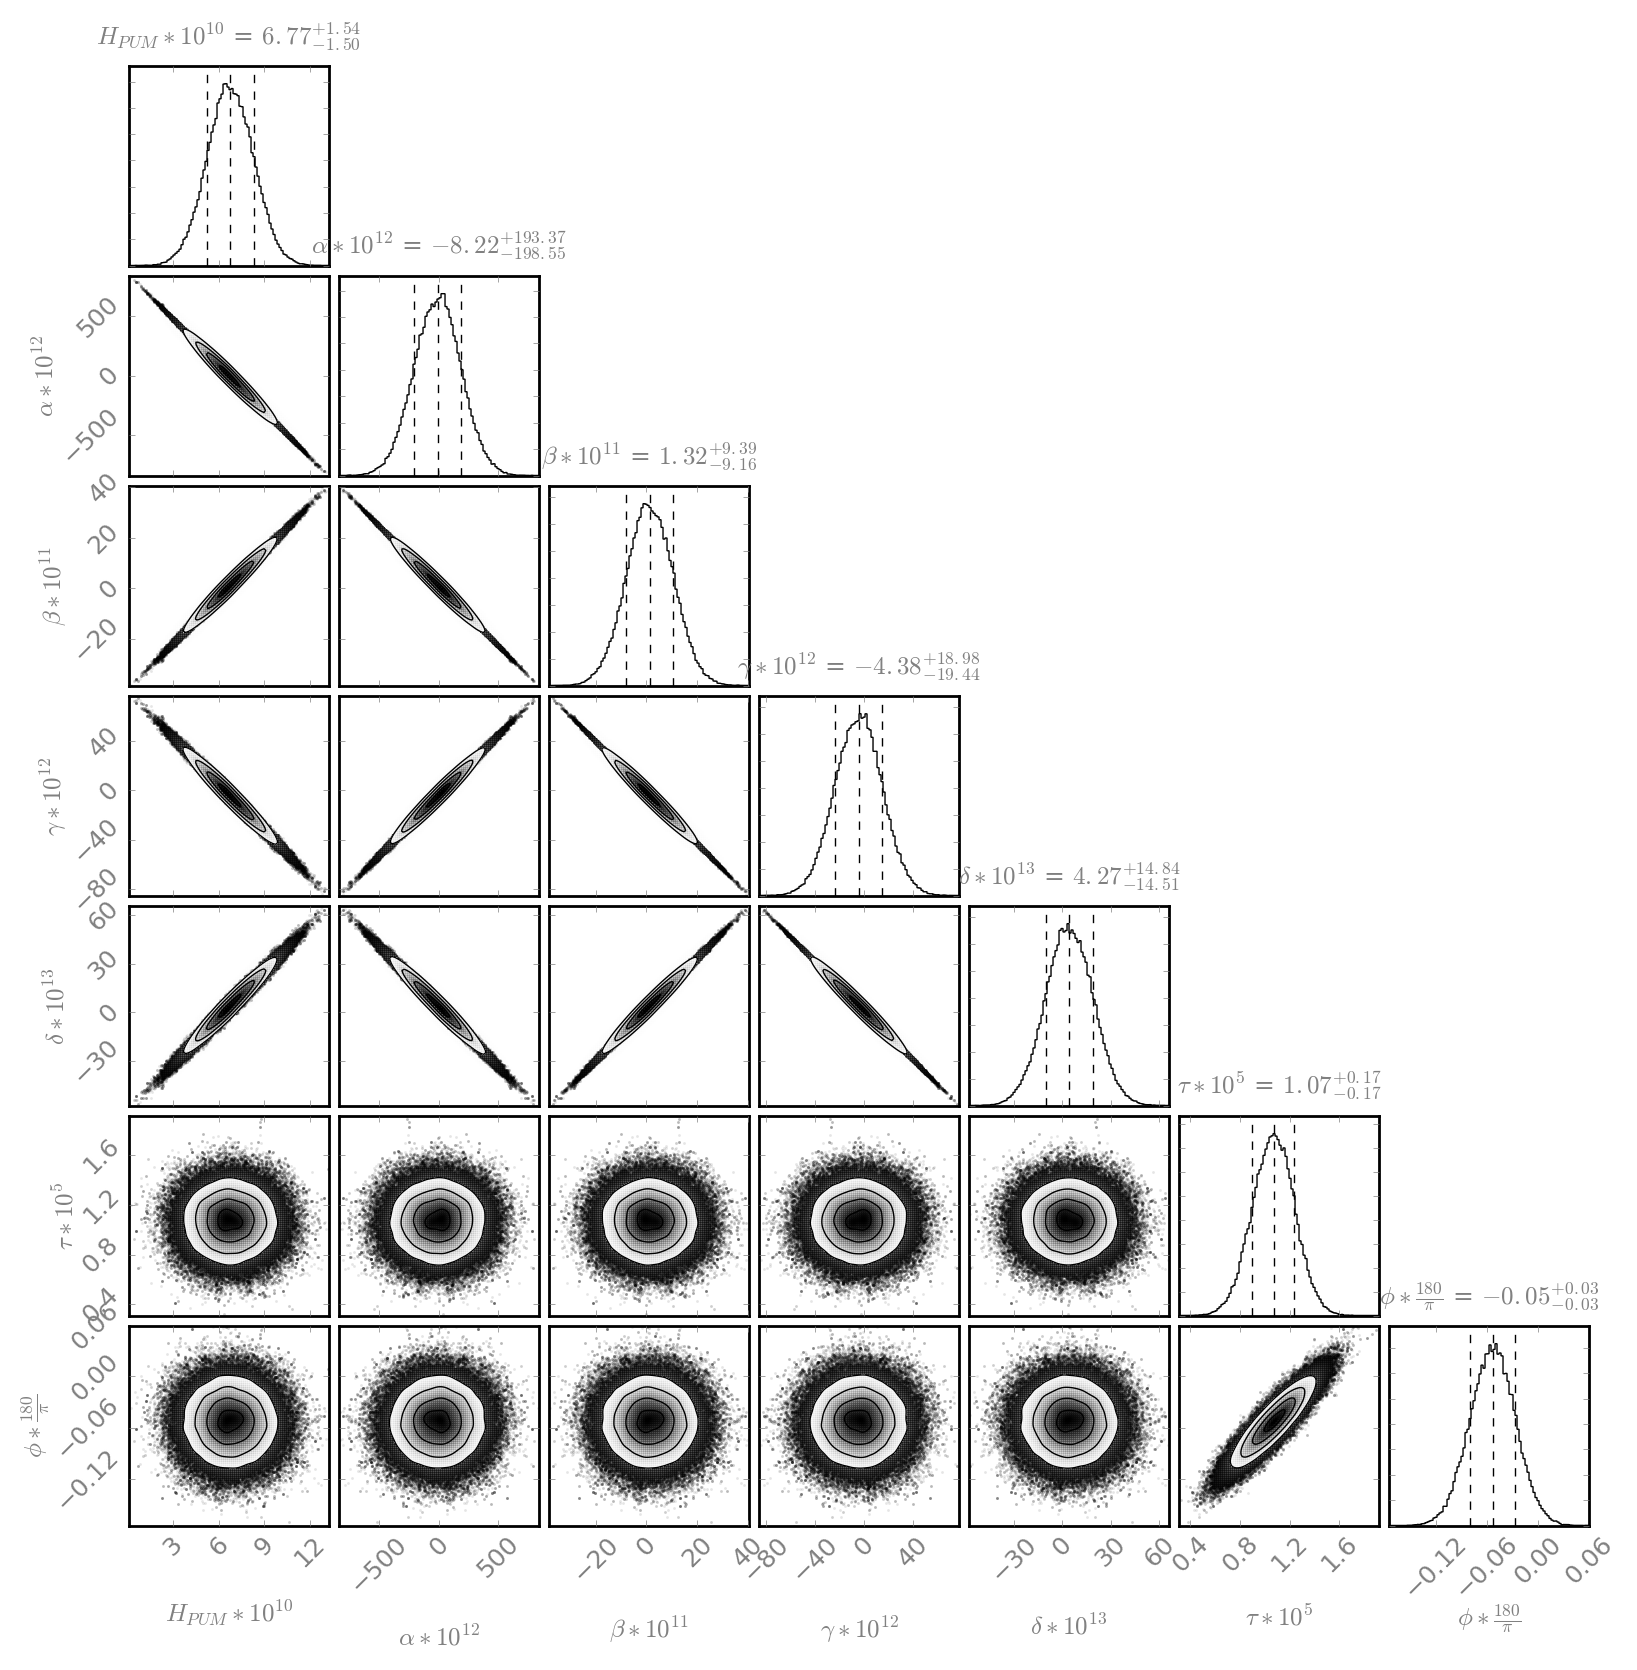
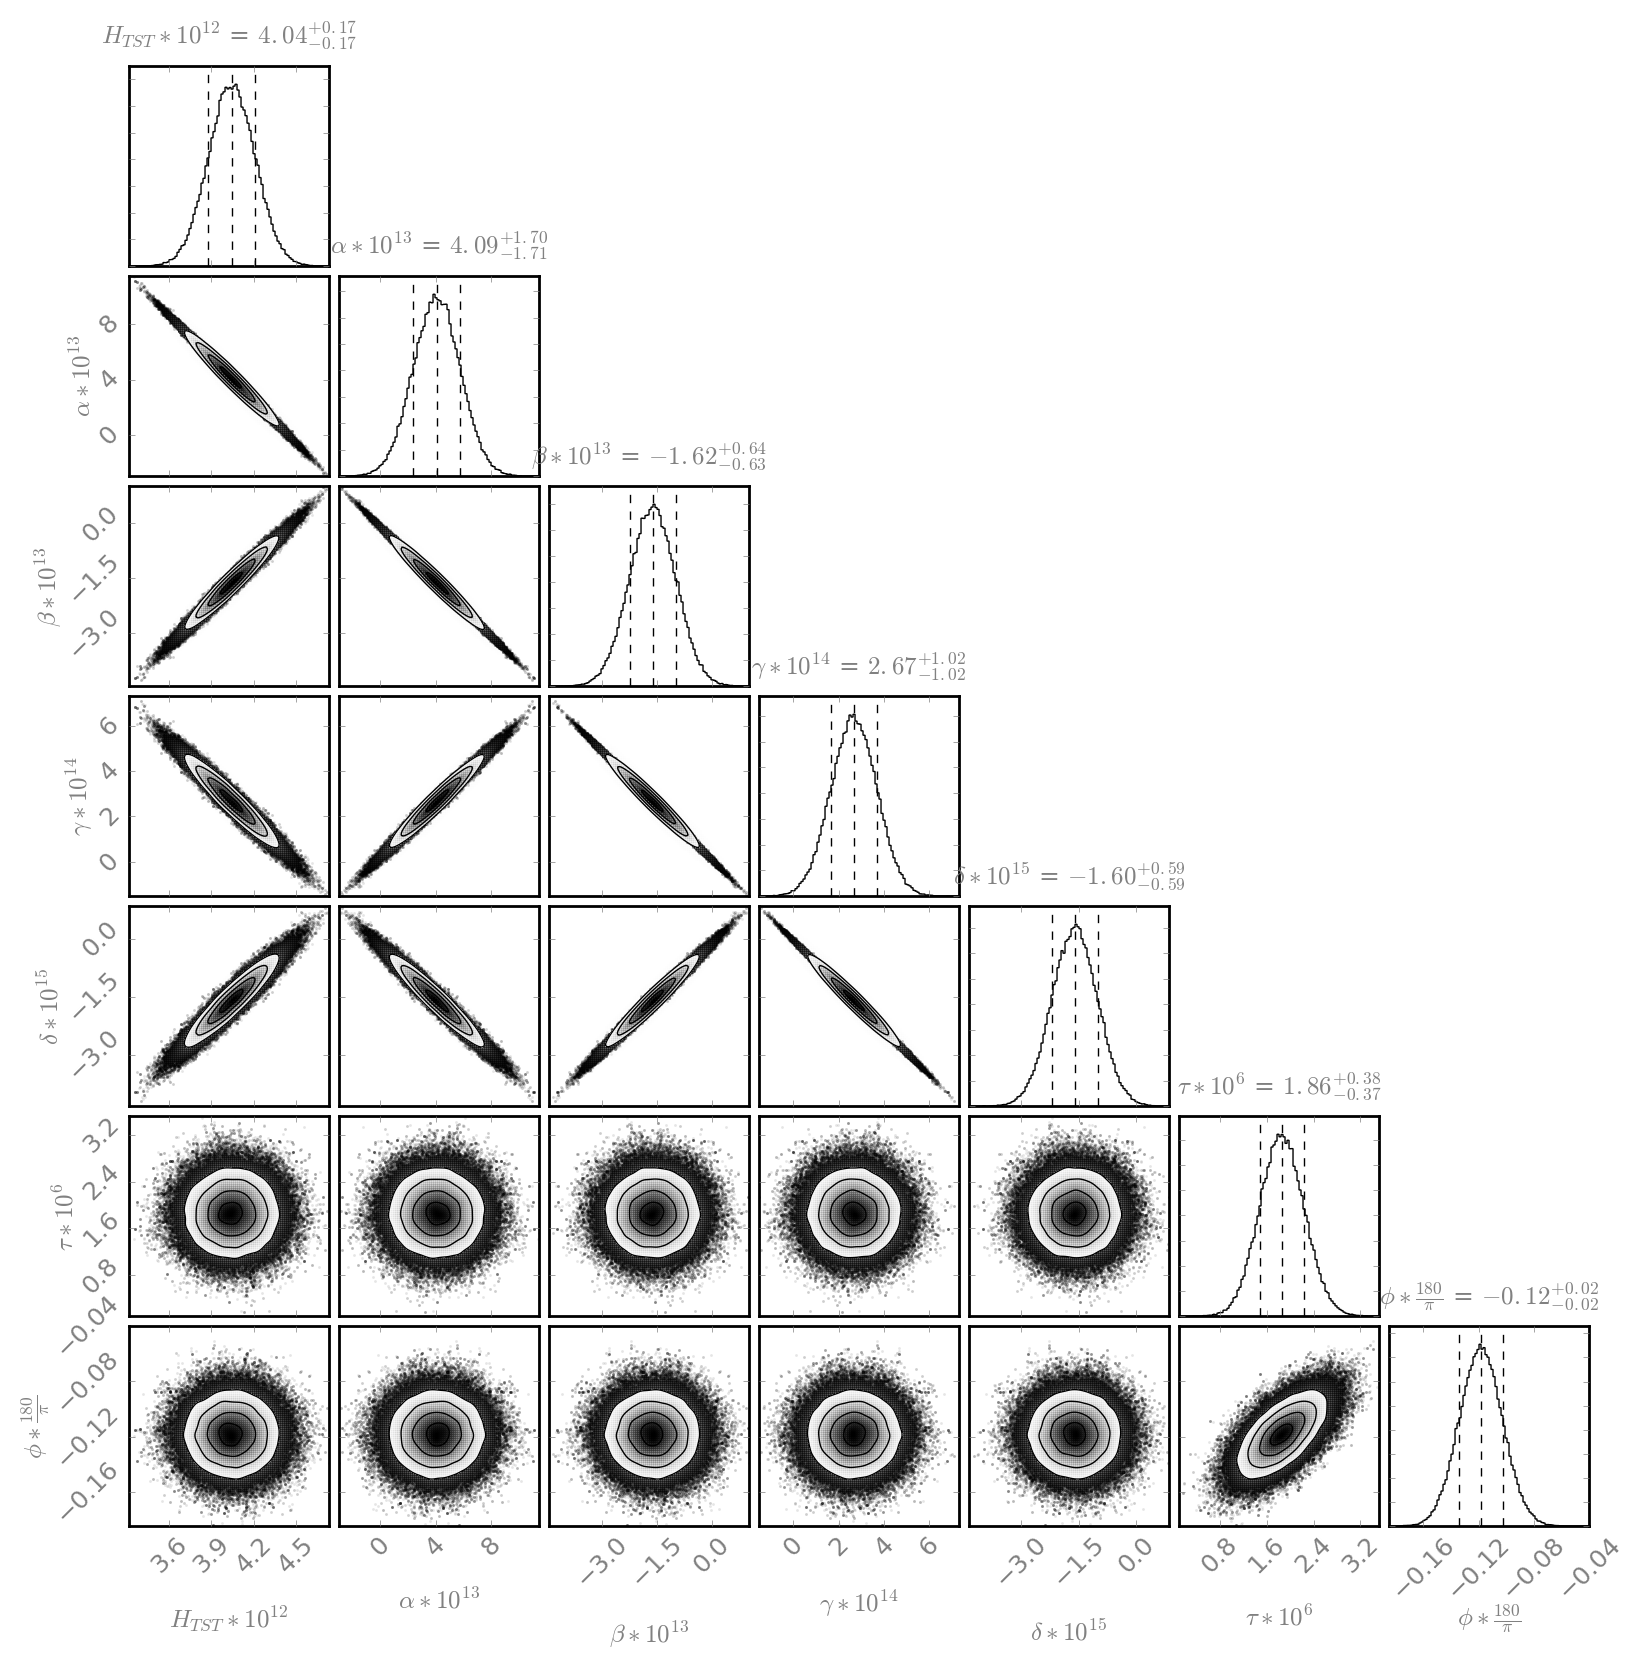
C. Cahillane ER10 Actuation uncertainty budget for LHO based on theN/cttransfer function measurements from November 8, 9, 11, 12, and 18th. To be clear, these measurements have the suspension models already divided out. Additionally, we only take measurement points for UIM up to 30 Hz, and PUM up to 100 Hz, since these are the only regions they have any actuation authority. We perform 4th order linear fits in the log(f) domain of the three actuation stages, UIM, PUM, and TST:Fit = ( a_0 + a_1 * log(f+1) + a_2 * log(f+1)**2 + a_3 * log(f+1)**3 + a_4 * log(f+1)**4 ) * exp(i * 2*pi*f*a_5 + i * a_6)The coefficients [a_0, ..., a_5] are the linear coefficients governing the magnitude of the fit. The coefficient a_5 is the time delay term, and a_6 is some phase offset. I fit the magnitude in the log(f+1) domain because the data is taken with logarithmic frequency spacing, and this gives the MCMC more freedom to fit the more-uncertain low frequency data points while constraining itself in the bucket. The plus one is solog(0 + 1) = 0and notlog(0) = -infinity, so at DC we don't explode our MCMC predicted results. I fit the phase in the linear f domain because exp(i* 2*pi*f*time_delay) is the typical expression for a time delay, and this seemed to be a sufficient fit given our data. There are two types of plots shown below: the corner plot and the measurement + fit + uncertainty results. There is one such plot for each stage. Plots 1, 2, and 3 are the UIM, PUM, and TST measurements + fit + uncertainty results. The shapes represent the ER10 measurement sweeps, the green line is the MCMC MAP fit, and each individual grey line is a potential fit according to the MCMC. The 1000 grey lines together form our uncertainty budget. Plots 4, 5, and 6 are the UIM, PUM, and TST fit corner plots. These show each parameter of the MCMC, its MAP value, and its 68% confidence interval in the title. The PDF of each parameter is shown along the diagonal, while the bulk shows the covariance of each parameter with one another. The names of each parameter is slightly different from my equation above:a_0 = H_{Stage} a_1 = alpha a_2 = beta a_3 = gamma a_4 = delta a_5 = tau (time delay) a_6 = phiIn comparison with LHO aLOG 31344, the DC coefficient values found were:H_UIM = 1.2 (+ 0.8 or - 0.7) * 10^-7 H_PUM = 6.8 (+ 1.5 or - 1.5) * 10^-10 H_TST = 4.0 (+ 0.2 or - 0.2) * 10^-12However, 4th order fits may not be the best method of finding the DC coefficient, since even a small change in value on the 4th order coefficient can have a huge effect on the 0th order coefficient. But for characterizing uncertainty in our actuation plant, this is the correct way since we don't in principle know the function we're fitting for. Overall Uncertainty:UIM Stage: < 3% magnitude and < 1 degree phase uncertainty PUM Stage: < 2% magnitude and < 1 degree phase uncertainty TST Stage: < 2% magnitude and < 1 degree phase uncertainty(All stages have their maximum uncertainty at low frequency.) This level of uncertainty is exceptionally tiny, even with 4th order polynomial fits. The great deal of measurements taken constrains the fit, lowering uncertainty drastically, especially in the bucket. Once we can account for time dependence, we may be close to achieving 5% and 5 degrees, depending on the sensing function uncertainty, or becoming kappa-limited.
Jeff, Darkhan, Kiwamu,
Looking at Craig's quad bode plots, we noticed that the data often showed large deviations in the data points at 38.3 Hz, especially in magnitude. We suspect that this is due to the fact that the DARM line at 37.3 Hz was not turned off during most of the measurements. While their separation is large and about 1 Hz, the DARM line can still influence our measurement because the integration time in the measurements was set to 1 sec which is not long enough to completely reject noise neighboring by 1 Hz. Out of 5 sets of the data that Craig processed, the Nov-18 data seems the only one which had the DARM line off. Indeed, the Nov-18 data shows a small deviation at 38.3 Hz.
A lesson we (re)learned today: Do not forget to turn off the calibration lines when running a swept sine measurement.