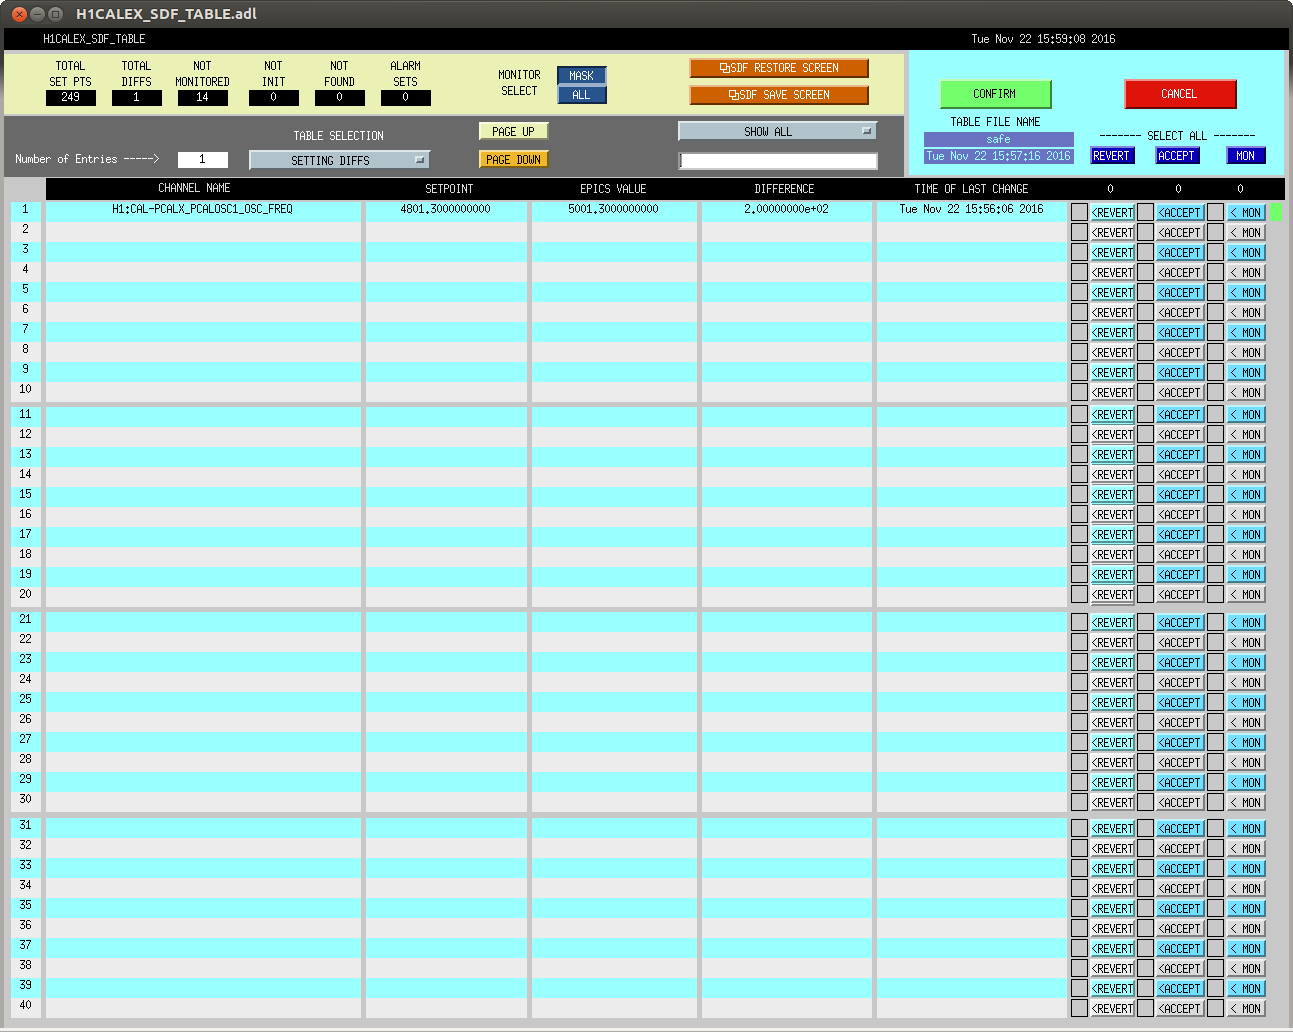
J. Kissel for S. Karki

I've moved the roaming calibration line to its highest frequency we intend to go, and it's also the last super-long duration we need. We may run through the lower frequency points again, given that (a) they need much less data, and (b) those data points were taken at various input powers that will likely confuse/complicate the analysis. Below is the current schedule status.

Current Schedule Status:
Frequency    Planned Amplitude        Planned Duration      Actual Amplitude    Start Time                 Stop Time                    Achieved Duration
(Hz)         (ct)                     (hh:mm)                   (ct)               (UTC)                    (UTC)                         (hh:mm)
---------------------------------------------------------------------------------------------------------------------------------------------------------
1001.3       35k                      02:00                   39322.0           Nov 11 2016 21:37:50 UTC    Nov 12 2016 03:28:21 UTC      ~several hours @ 25 W
1501.3       35k                      02:00                   39322.0           Oct 24 2016 15:26:57 UTC    Oct 31 2016 15:44:29 UTC      ~week @ 25 W
2001.3       35k                      02:00                   39322.0           Oct 17 2016 21:22:03 UTC    Oct 24 2016 15:26:57 UTC      several days (at both 50W and 25 W)
2501.3       35k                      05:00                   39322.0           Oct 12 2016 03:20:41 UTC    Oct 17 2016 21:22:03 UTC      days     @ 50 W
3001.3       35k                      05:00                   39322.0           Oct 06 2016 18:39:26 UTC    Oct 12 2016 03:20:41 UTC      days     @ 50 W
3501.3       35k                      05:00                   39322.0           Jul 06 2016 18:56:13 UTC    Oct 06 2016 18:39:26 UTC      months   @ 50 W
4001.3       40k                      10:00                   39322.0           Nov 12 2016 03:28:21 UTC    Nov 16 2016 22:17:29 UTC      days     @ 30 W (see LHO aLOG 31546 for caveats)
4301.3       40k                      10:00                   39322.0           Nov 16 2016 22:17:29 UTC    Nov 18 2016 17:08:49 UTC      days     @ 30 W
4501.3       40k                      10:00                   39322.0           Nov 18 2016 17:08:49 UTC    Nov 20 2016 16:54:32 UTC      days     @ 30 W (see LHO aLOG 31610 for caveats)
4801.3       40k                      10:00                   39222.0           Nov 20 2016 16:54:32 UTC    Nov 22 2016 23:56:06 UTC      days     @ 30 W
5001.3       40k                      10:00                   39222.0           Nov 22 2016 23:56:06 UTC
Before the HW injection test, we turned off this line (before entering observation intent). I turned it back on at Nov 23 2016 03:25 UTC, but this did not drop us out of observation intent.
This line was again turned off at 4:12 Nov 23 2016 UTC so that DetChar safety study can be made late tonight.
The analysis of sensing function at frequency above 1 kHz obtained from the roaming lines listed in the alog above is attached. These lines were run at different times than the low frequency sweep (below 1 kHz) taken on Nov 18 and included in this plot. So, the lines above 1 kHz will need to be compensated for the time varying parameters to make accurate comparison and has not been done for this plot.
One way of compensating the changes are by applying kappas calculated using the SLM Tool (or GDS). The other way of doing it is comparing each individual line with 1083.7 Hz (which is always on) line at time t (time at which each line is running) and time t0 (time of low freqeuncy sweep).
Sensing Function [ct] /[m] = (DARM_ERRR/TxPD) f= hf, t * (TxPD/DARM_ERR) f = 1083.7, t * (DARM_ERRR/TxPD) f= 1083.7, t0
Both methods are essentially same but I will use the second method and the plot with the correct compensation applied to come soon.
