The free memory size on the guardian machine is about 4GB. At the current rate of usage we predict a reboot is needed before next Tuesday. At the next opportune time, we will increase the memory size from 12GB to 48GB and perhaps schedule regular reboots on Tuesdays.
Plot of available memory for the month of November is attached (Y-axis mis-labelled, actually MB).
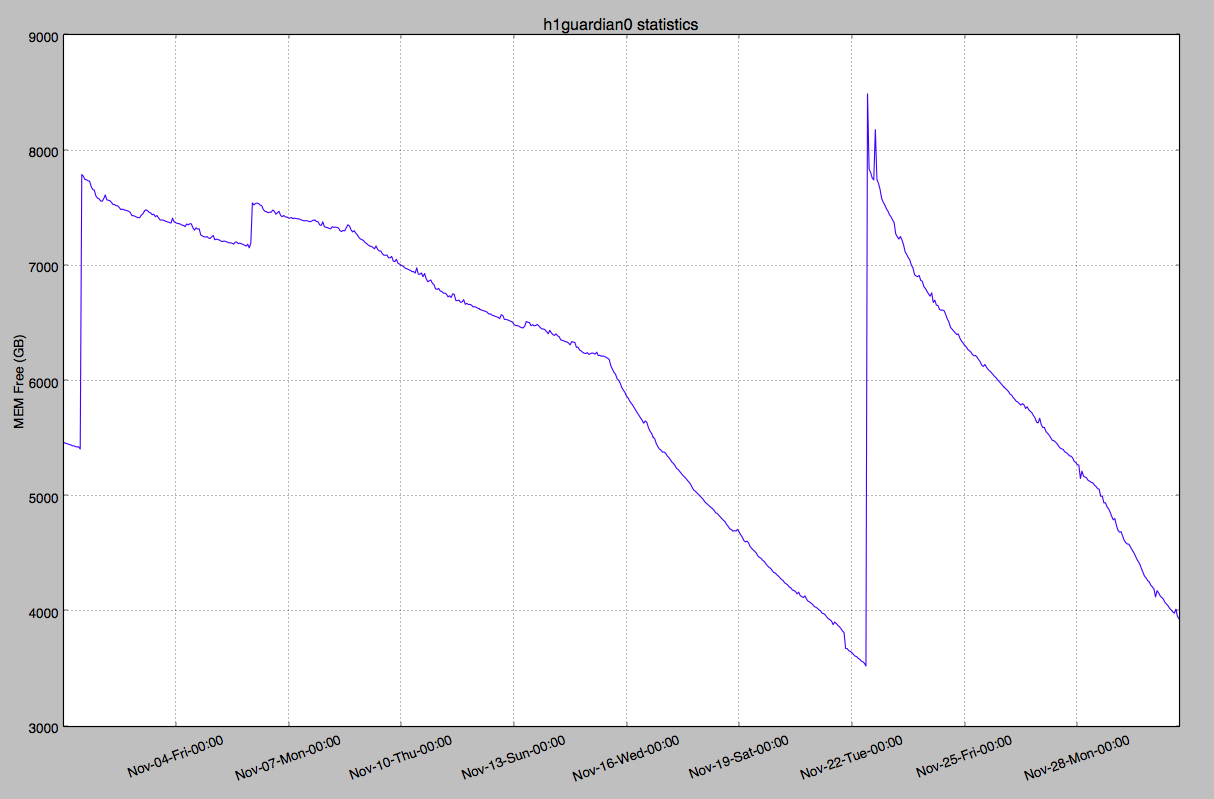
We did similar analysis at LLO ( See LLO aLOG 30004 ). We do see increasing memory over time from the guardian process.
Does this LHO memory plot include cached memory? It would be interesting to see the amount of cache memory used along with the free memory.
The character of memory usage on the LLO guardian machine is quite different, and doesn't look the same as what Dave has posted at all. The LLO usage seems to plateau and not continually increase. The plots that Dave is showing here look like a very steady increase, which looks much different. The LHO plot looks more disturbing, as if there's a memory leak in something. Memory usage has been fairly flat when we've looked in the past, so I'm surprised to see such a high rate of increase.
I also note that something changed two Tuesday's ago, which is what we also notice at LLO. Was there an OS upgrade on h1guardian0 on Nov. 14?
The LLO guardian script machine was rebooted 16 days ago on Nov 15 (typically after we do a 'aptitude safe-upgrade'). The other dips are likely due to Guardian restarts due to DAQ, etc.