Dave, TJ:
A recent plot of free memory showed that the rate-of-decrease increased around noon Tuesday 15th Nov. TJ tracked this to a DIAG_MAIN code change wherein a slow channel is being averaged over 120 seconds every 2 seconds. Doing the math, this equates to 0.33GB per day. This matches the increased memory consumption rate seen since Nov 15.
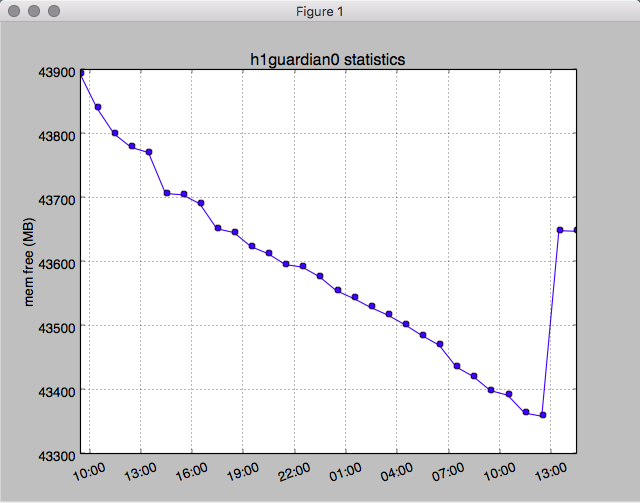
To test this, during the lunch time lock loss today, we killed and restarted the DIAG_MAIN process. Attached is a plot of free memory from 9:30am Thursday PST (after the memory size of h1guardian was increased to 48GB) and 2:30pm PST today. The last data points show the memory recovered by the restart of DIAG_MAIN, and it agrees with 330 MB per day.
With the increased memory size we anticipate no memory problems for 3 months at the current rate of consumption. However we will schedule periodic restart of the machine or the DIAG_MAIN node during maintenance.
BTW: free memory is obtained from the 'free -m' command, and taking the free value from the buffers/cache row. This does not use the recoverable buffers/cache memory usage in calculating the used size.
This maybe points to a memory leak in the nds2-client. We should figure out exactly what's leaking the memory and try to plug it, rather than just relying on node restarts. The DIAG_MAIN node is not the only one to make cdsutils.avg calls.