The TCSY chiller flow seems to be struggling for the last 40min or so. This doesn't seem to be the normal issue of an air bubble because it is not recovering as it normally would. I saw a WP for the replacement of this flow meter but I didn't see an alog stating that it happened.
Attached is an hour trend of the flow rate.
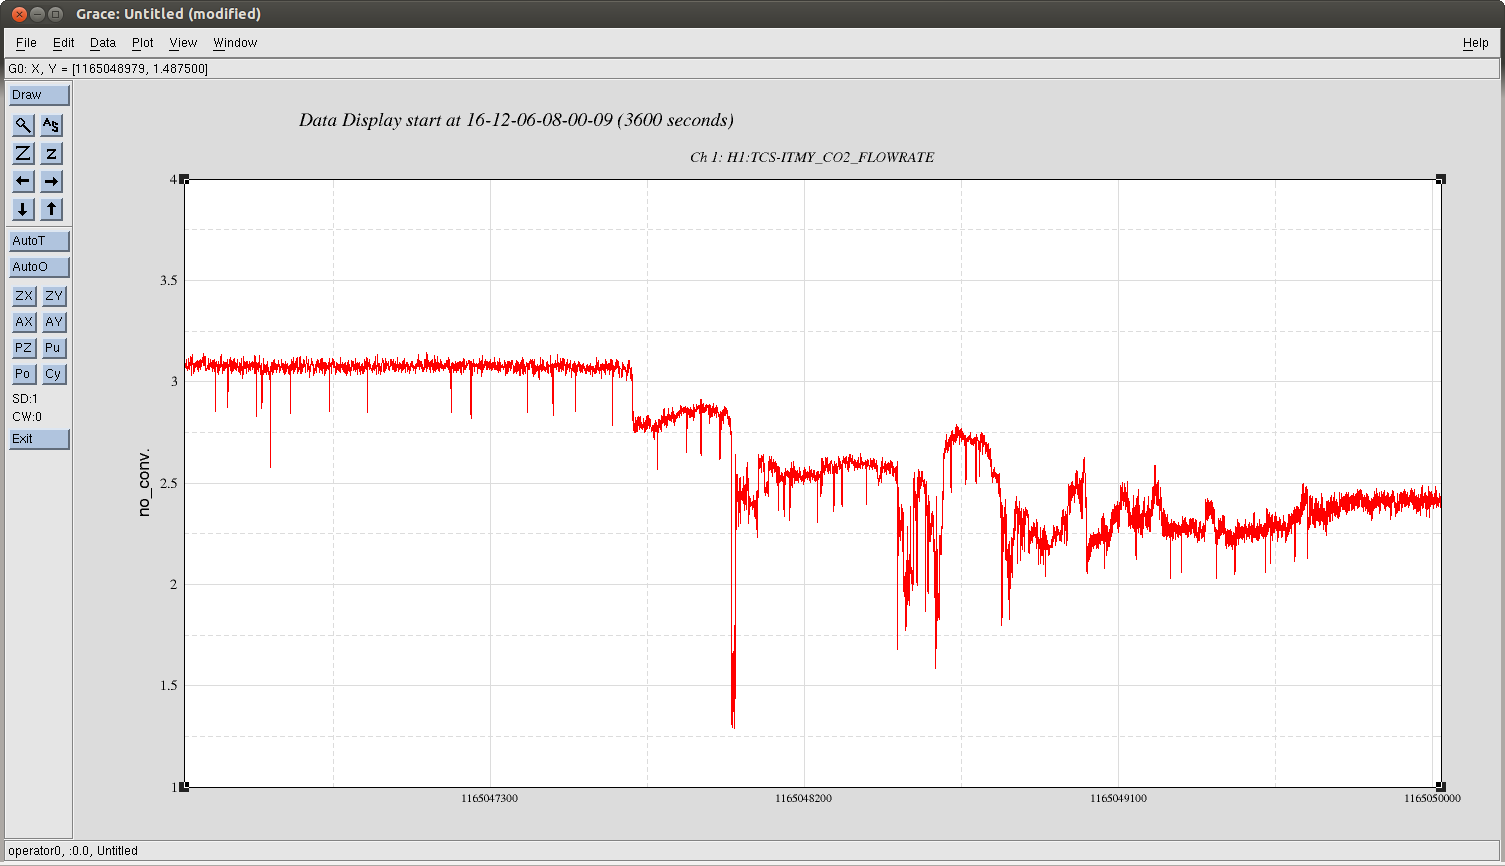
Seems to have stablized itself now, back at 3.0Gpm
Eh, this actually is kinda the usual "thing" going on with this sensor of late... It drops low for a while ~30-60 mins and then recovers eventually. The work permit we have open is to fix next Tuesday.
I was wondering if this was coming from the CO2 controller chassis, D1200745. I had a look to see if there were accompanying glitches on the CO2Y laser temperature channel which might indicate a common cause. Whilst there are some glitches that show up simultaneously on both channels, there are many that are not simultaneous. It is far from obvious that there is a common cause for the flow rate variations.
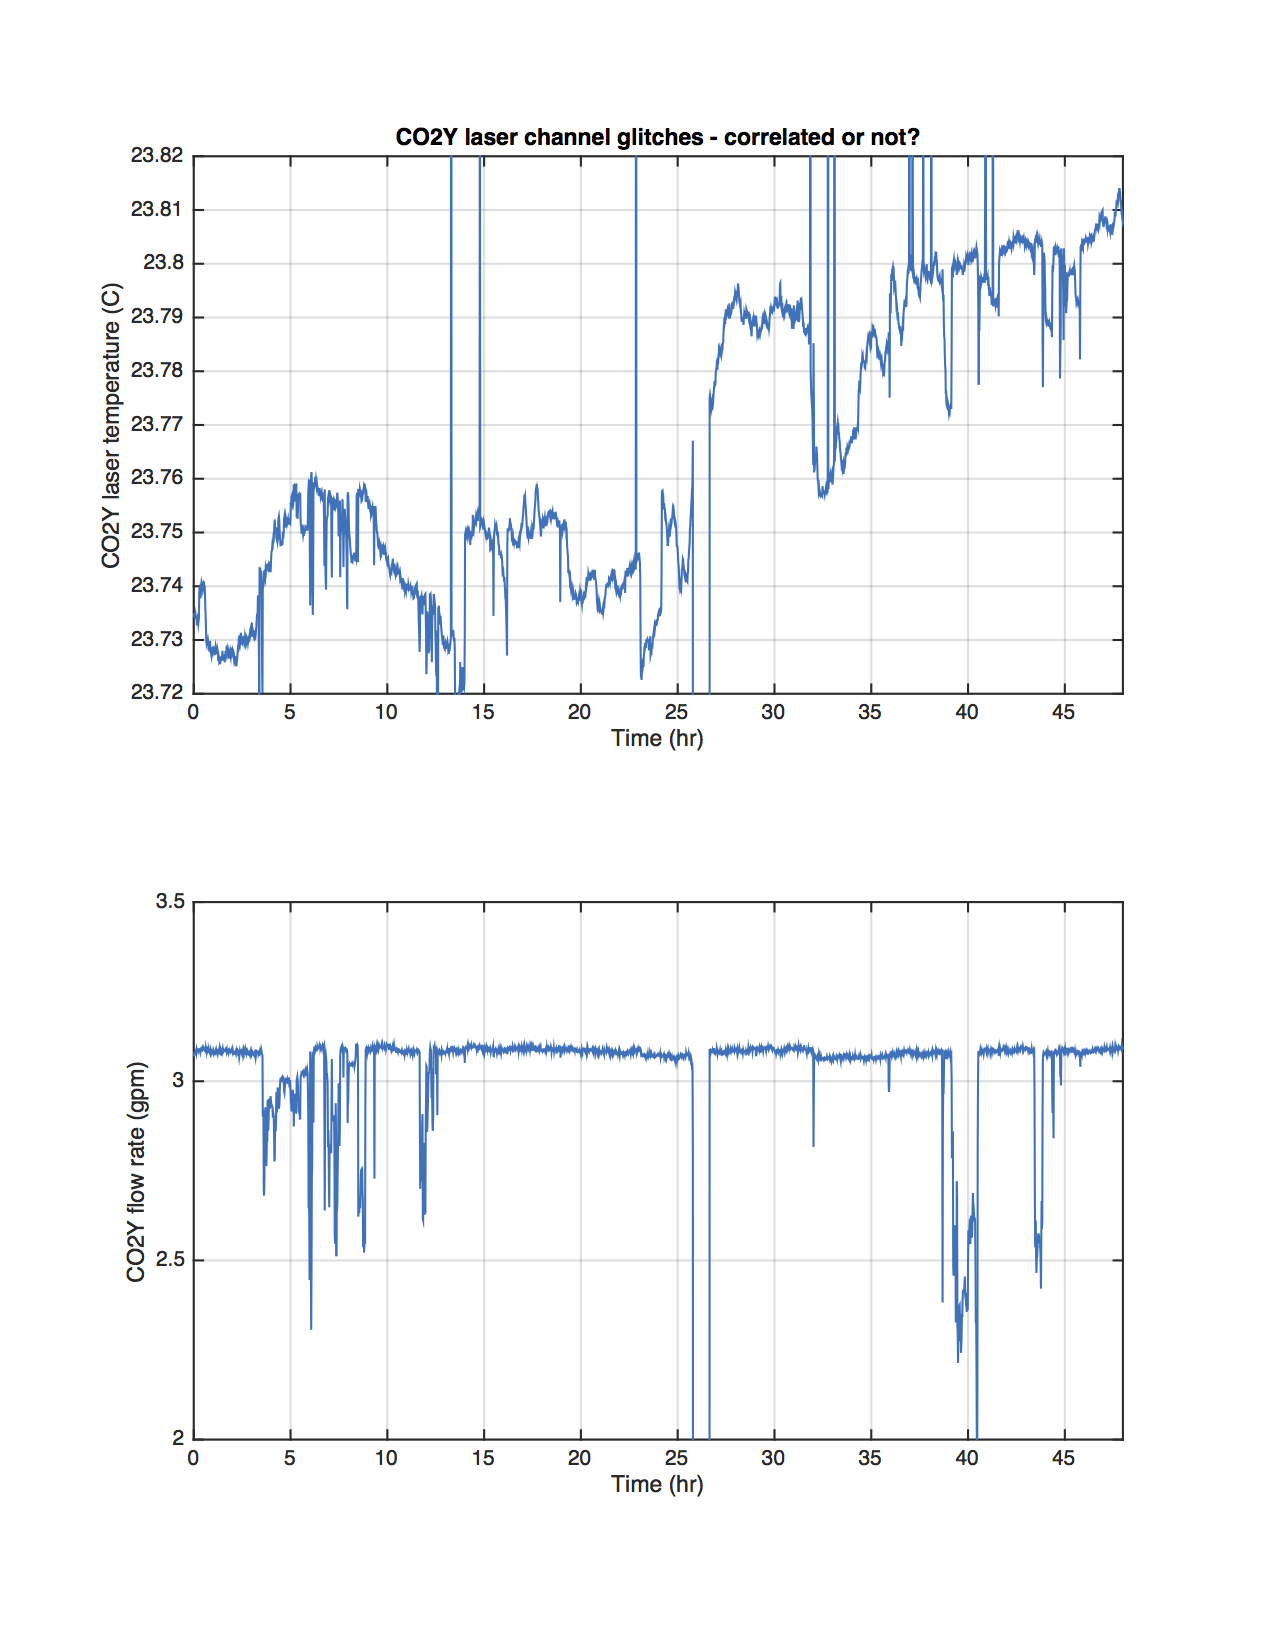
% check to see if the CO2Y laser flow meter is broken or if there is a
% problem with electronics instead. Compare to CO2Y laser temperature
t0 = 1165166030 - 72*3600;
t1 = t0 + 2*24*3600;
chan = {'H1:TCS-ITMY_CO2_LASERTEMPERATURE.mean,m-trend', ...
'H1:TCS-ITMY_CO2_FLOWRATE.mean,m-trend'};
[data, t, info] = get_data(t0,t1,chan,[]);
subplot(2,1,1)
plot((1:size(data,1))/60, data(:, 1)); grid on
axis([0 48 23.72 23.82])
xlabel('Time (hr)')
ylabel('CO2Y laser temperature (C)')
title('CO2Y laser channel glitches - correlated or not?')
subplot(2,1,2)
plot((1:size(data,1))/60, data(:, 2)); grid on
axis([0 48 2 3.5])
xlabel('Time (hr)')
ylabel('CO2Y flow rate (gpm)')
orient tall
print('-dpdf', 'CO2Y_flow_rate_errors.pdf')
