craig.cahillane@LIGO.ORG - posted 19:31, Wednesday 14 December 2016 (32582)
LHO O2/ER10 Calibration Parameter Uncertainty
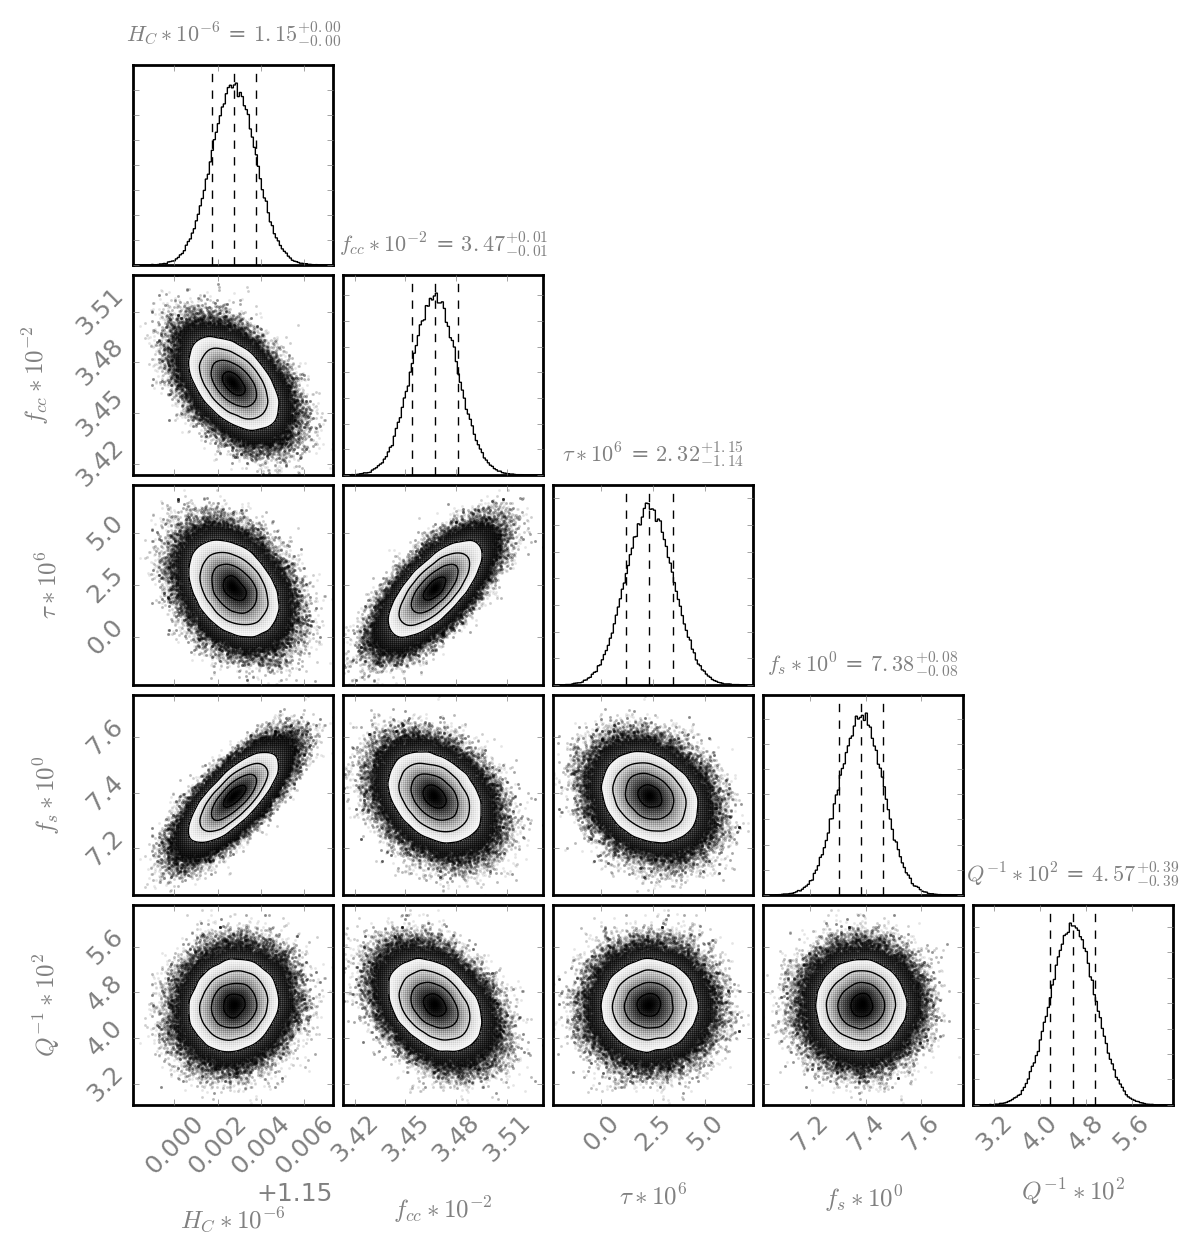
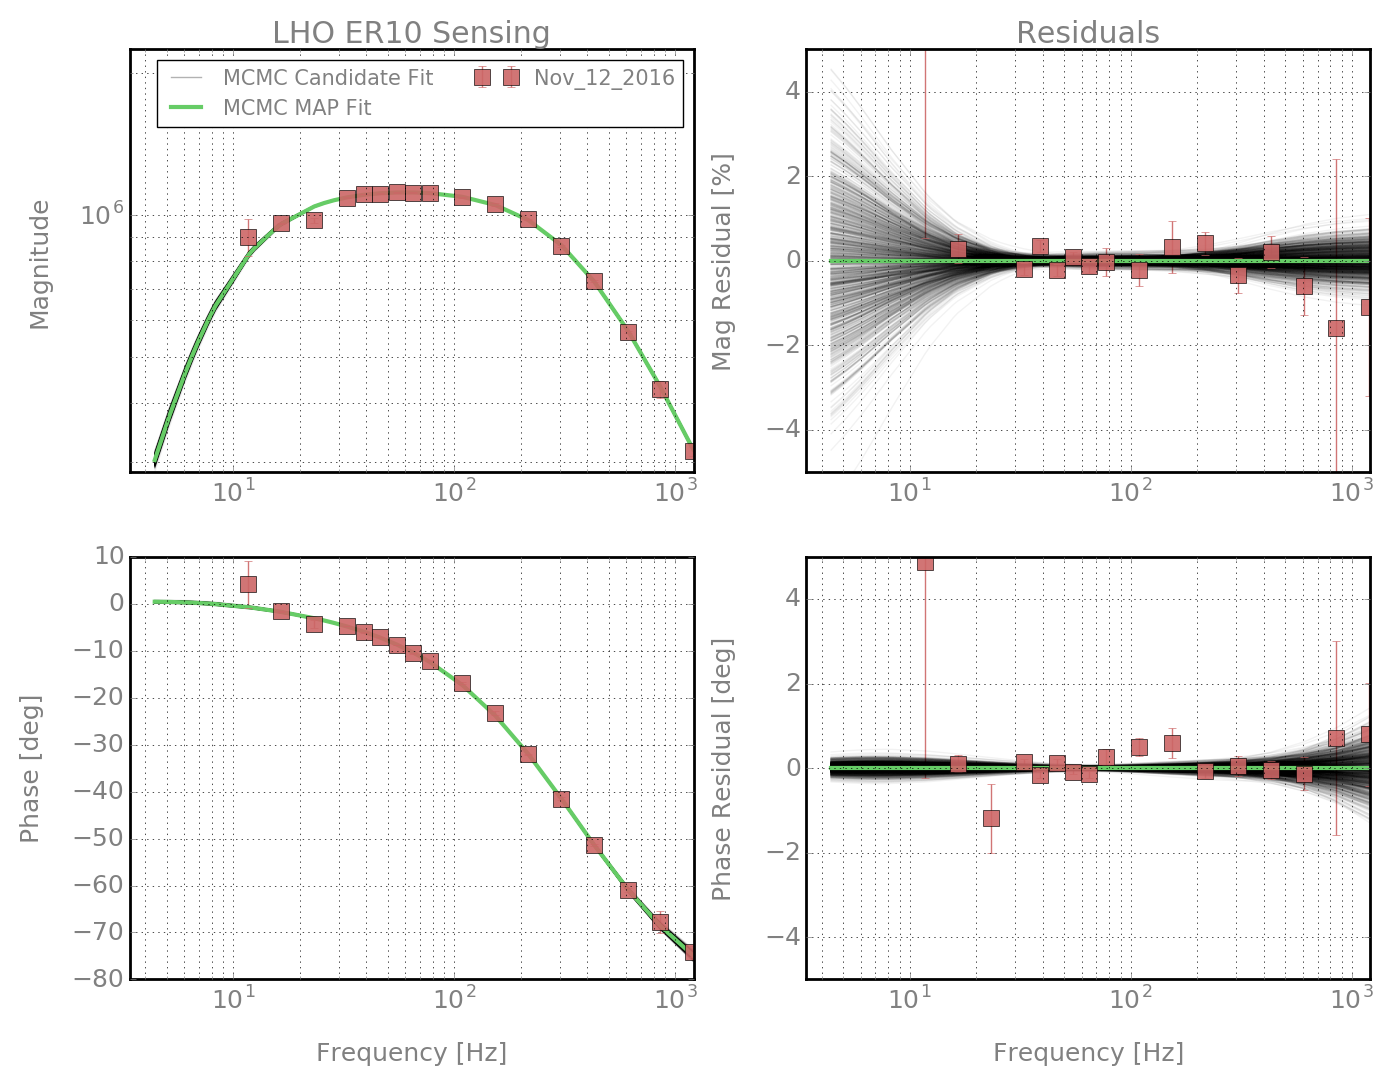
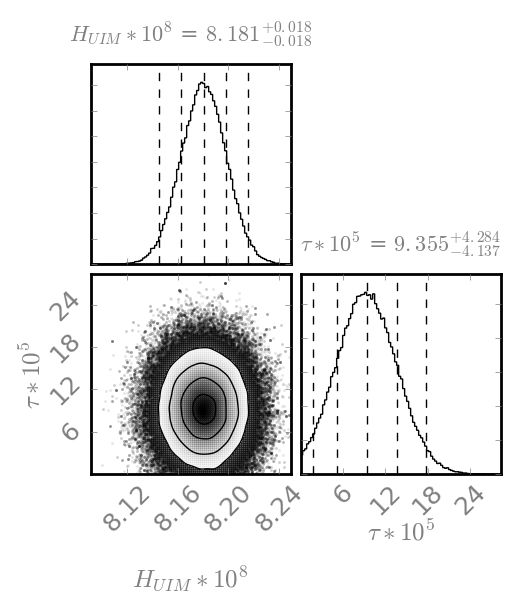
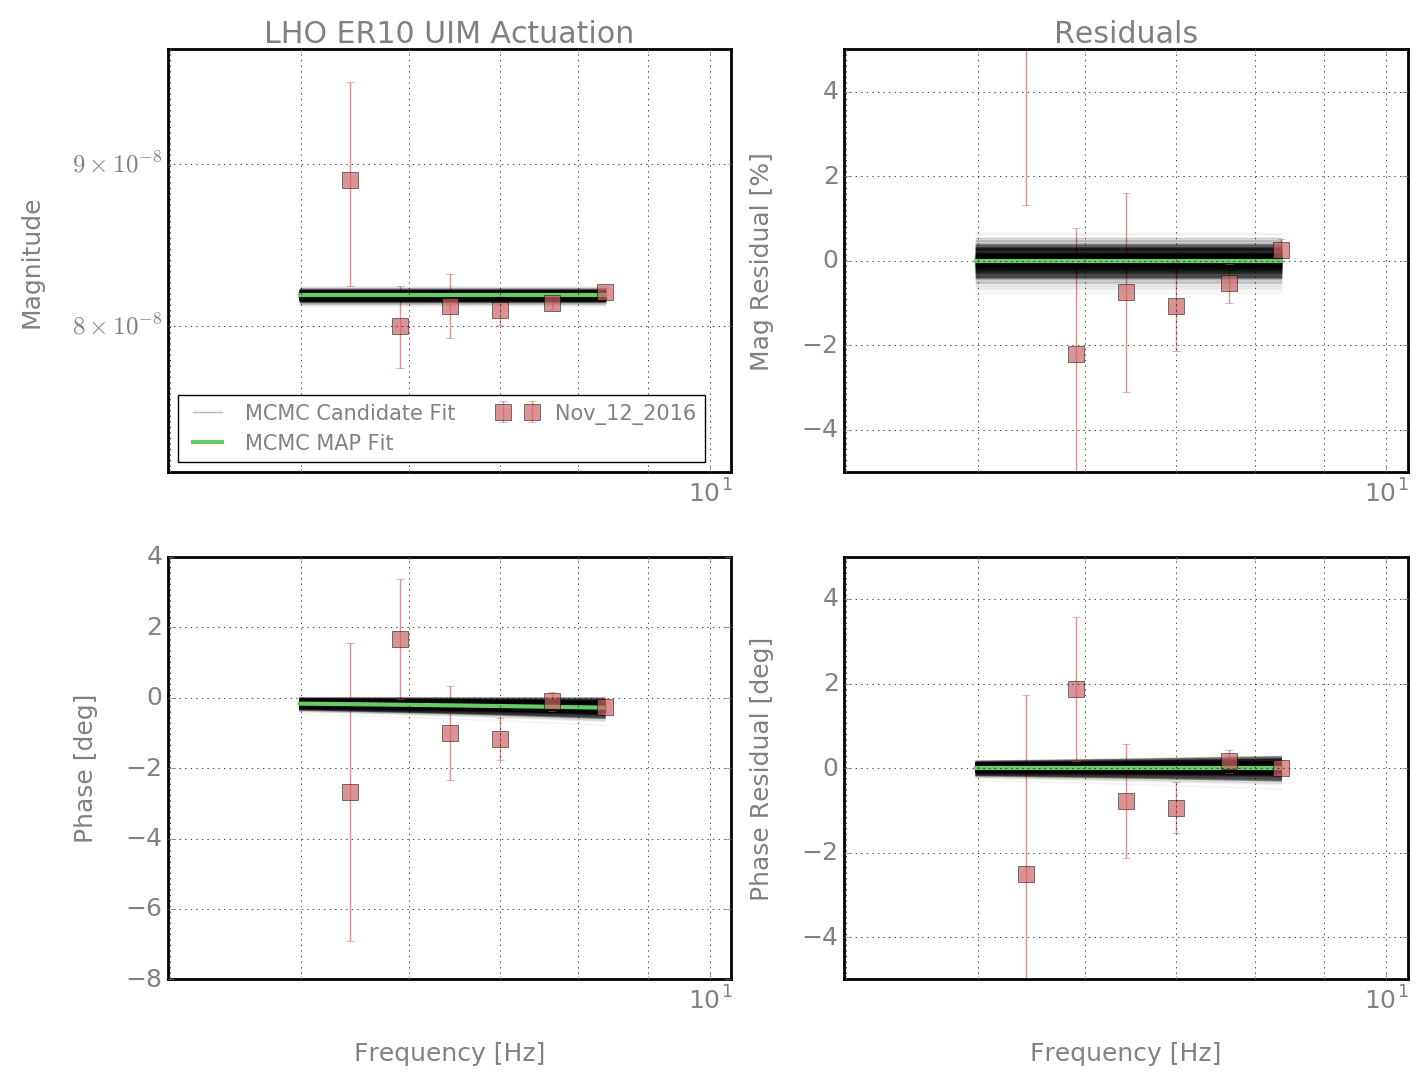
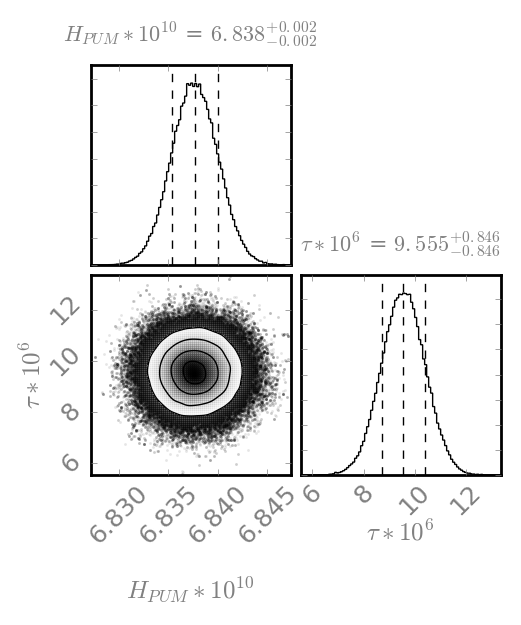
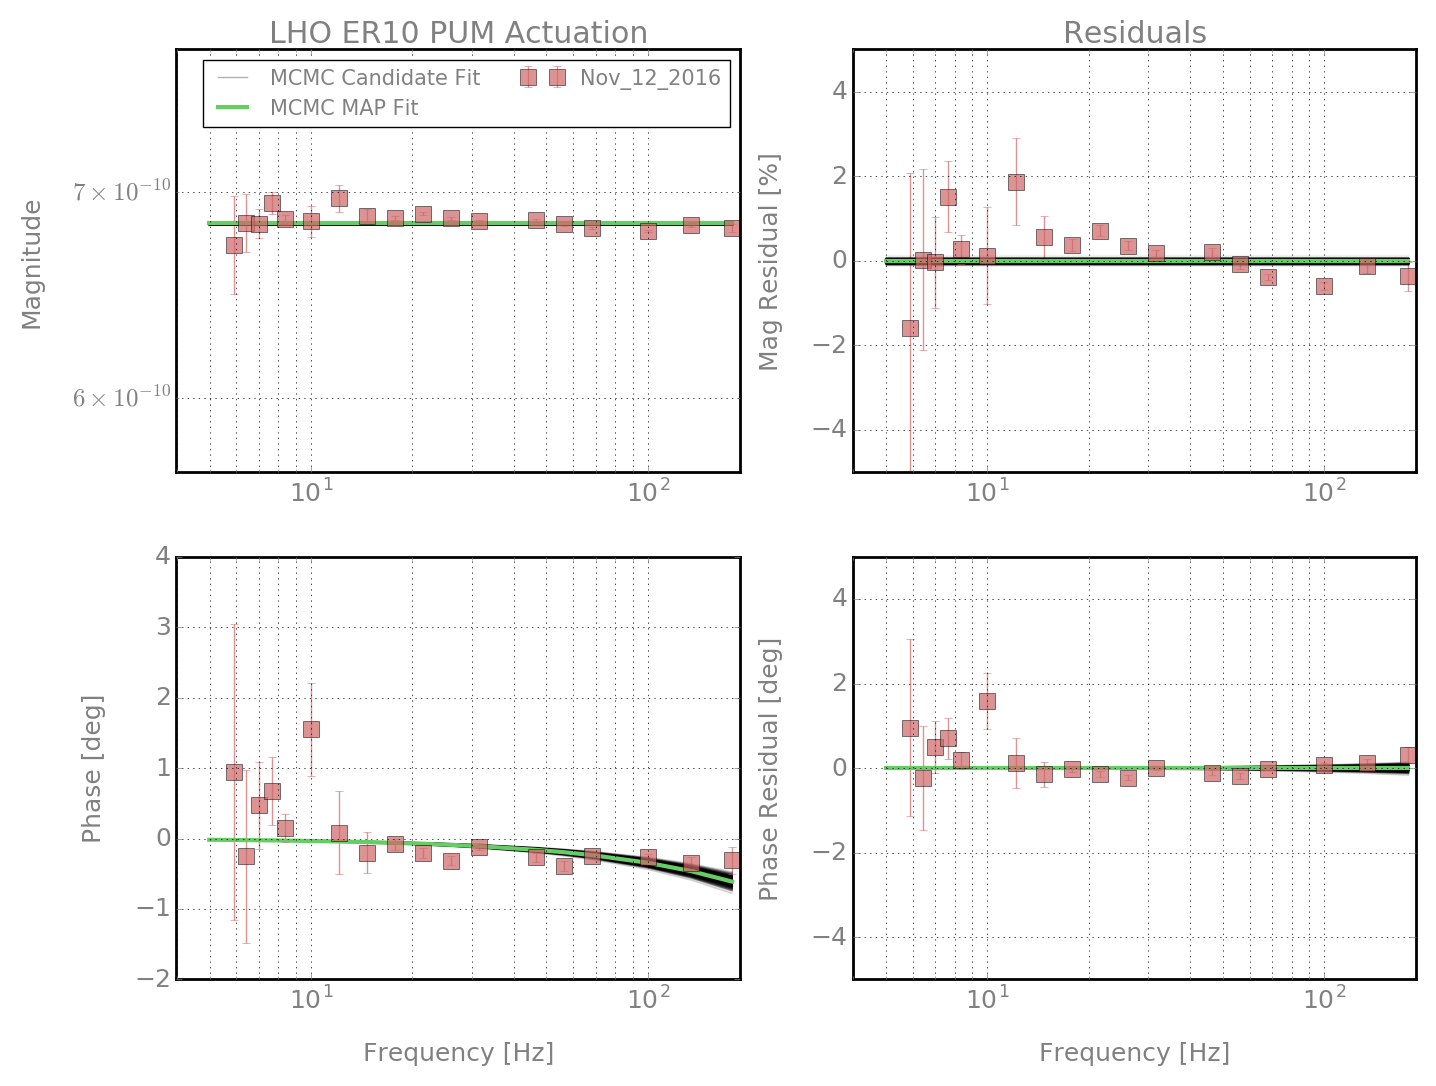
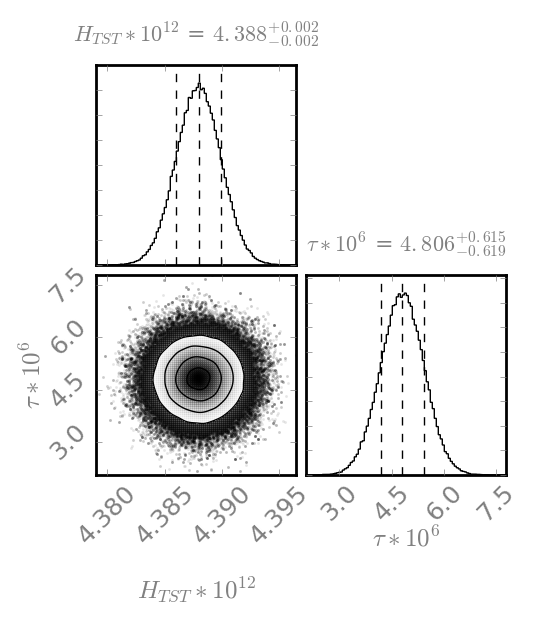
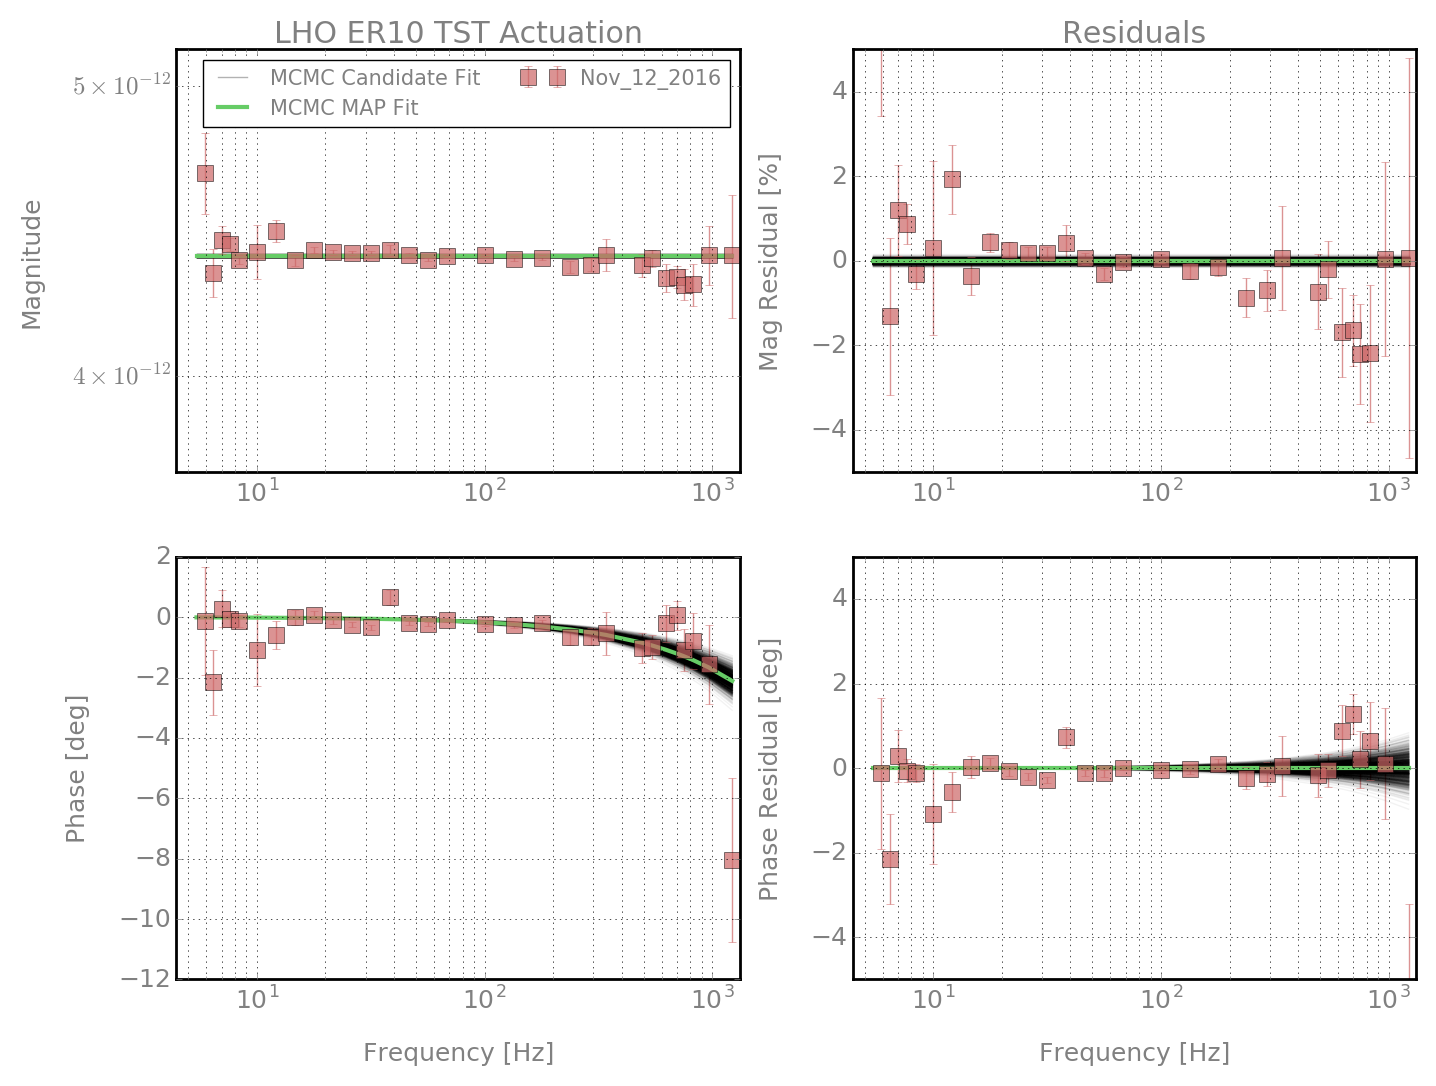
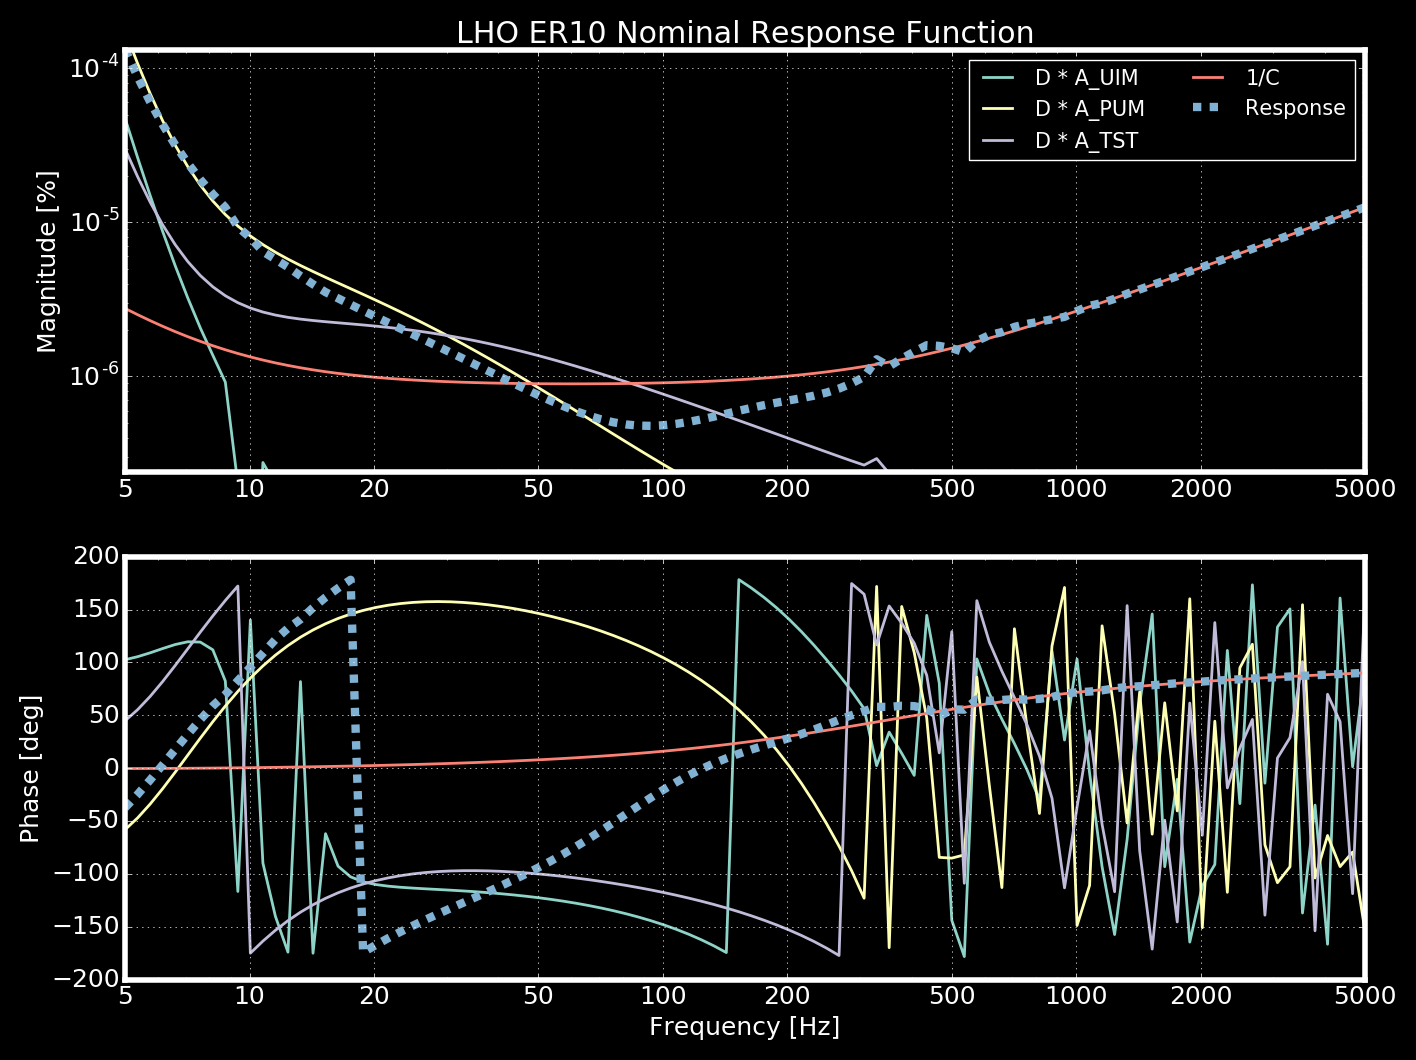
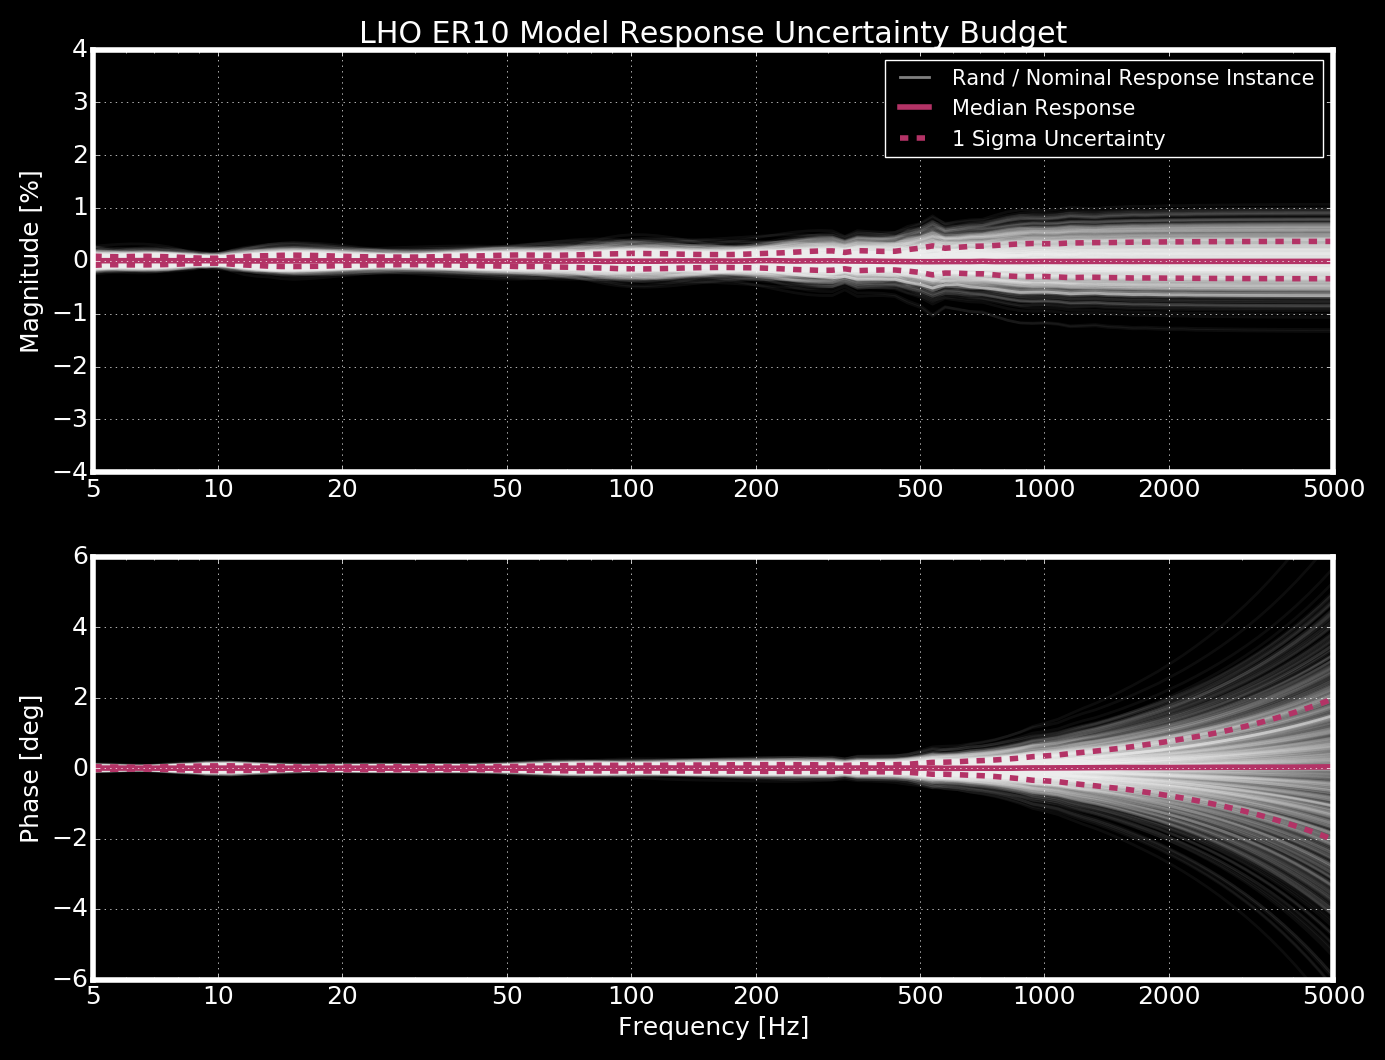
C. Cahillane Reported are the 1-sigma (68%) uncertainties in the calibration parameters, and the plots of these parameter's impact on the sensing, actuation, and response function uncertainties. These are the uncertainties due entirely to MCMC fits of the calibration parameters given the November 12 reference measurements. This does not take into account unmodeled changes in the calibration, i.e. systematic errors. Those are characterized by the Gaussian Process method and will be reported later in the total uncertainty + systematic error budget. Plot 1 shows the LHO sensing function parameters and cornerplots. Parameter 68% and 95% confidence intervals are posted below:= = = = = = = = == Median ===== - 68% CI == + 68% CI == - 95% CI == + 95% CI Optical gain = +1.1527e+06 -0.088 % +0.088 % -0.174 % +0.174 % [cnts/m] Cavity pole = +3.4674e+02 -0.390 % +0.389 % -0.766 % +0.777 % [Hz] Time delay = +2.3216e-06 -49.15 % +49.54 % -96.2 % +97.4 % [usec] Spring frequency = +7.3837e+00 -1.101 % +1.078 % -2.150 % +2.123 % [Hz] Spring Inverse Q = +4.5749e-02 -8.57 % +8.62 % -16.9 % +17.0 %Plot 2 shows the sensing function Nov 12 measurement and its model fit given the MAP parameters. Plot 3 is the UIM actuation parameters cornerplots. Parameter confidence intervals:= = = = = = = = Median = = = - 68% CI = + 68% CI = - 95% CI = + 95% CI Gain UIM = +8.1807e-08 -0.220 % +0.218 % -0.434 % +0.431 % [N/ct] Time delay = +9.3546e-05 -44.226 % +45.798 % -81.585 % +90.190 % [s]Plot 4 is the UIM actuation Nov 12 measurement and model fit given MAP parameters. Plot 5 is the PUM actuation parameters cornerplots. Parameter confidence intervals:= = = = = = = = Median = = = - 68% CI = + 68% CI = - 95% CI = + 95% CI Gain PUM = +6.8377e-10 -0.034 % +0.034 % -0.067 % +0.068 % [N/ct] Time delay = +9.5548e-06 -8.855 % +8.849 % -17.395 % +17.405 % [s]Plot 6 is the PUM actuation Nov 12 measurement and model fit given MAP parameters. Plot 7 is the TST actuation parameters cornerplots. Parameter confidence intervals:= = = = = = = = Median = = = - 68% CI = + 68% CI = - 95% CI = + 95% CI Gain TST = +4.3880e-12 -0.044 % +0.044 % -0.087 % +0.087 % [N/ct] Time delay = +4.8062e-06 -12.882 % +12.788 % -25.492 % +25.184 % [s]Plot 8 is the TST actuation Nov 12 measurement and model fit given MAP parameters. Plot 9 is the response functionR(f) = 1/C + D*Aplotted with its components. This shows what dominates where. Plot 10 is the relative response function uncertainty due entirely to the MCMC results. It is < 0.5% and < 2 degrees everywhere between 5 and 5000 Hz. This is not the total uncertainty budget, just those due to the uncertainty in calibration parameters. This is interesting because it tells us a couple of things about calibration parameters. (1) They are extremely well-determined, and (2) marginalizing over just calibration parameters may not be enough to capture the total uncertainty budget. Stay tuned What remains to be done: (1) Take out time-dependence from the measurements. (2) Run Gaussian Process on all measurements with time-dependence removed. (3) Compile total uncertainty budget including systematic error. For a similar budget at LLO, see LLO aLOG 30440
Images attached to this report