jeffrey.kissel@LIGO.ORG - posted 10:11, Thursday 28 June 2012 - last comment - 11:31, Thursday 28 June 2012(3290)
H2 SUS I/ETMY TOP Stage TF Data Mining in the interest of Excess Motion
J. Kissel, M. Evans

Forgive me while I catch you up to where we are.

Here's some data collected over the course of these SUS's lifetimes thus far. An a priori thanks goes to J. Garcia for taking most of this data!

I collect it all in one place, with the data shown in the mindset of the discussion of why there's so much excess motion in Pitch (during ambient times). I'll show more plots later that show that it's actually Longitudinal that's going nuts, but ... we'll get there.

Remember that both ETMY and ITMY have the same exact filters with the same exact gains.


For now: check out the attached. We will find out that (1) is more useful than (2).
------------
(1) I show a collection of data that is representative of the current situtation, comparing damping loops ON vs. OFF (see allquads_120628_H2SUS_DampingComp_ALLM0_ZOOMED_TFs.pdf). From this plot, we immediately notice the following:

- L is basically undamped for both SUS, especially its low frequency modes (where the dominant RMS motion lies)
- P is totally squashed (over-damped), especially the higher frequency modes
- T, R, V, and Y could maybe use a little more juice, but otherwise look OK -- but even in these DOFs, the lowest frequency modes are poorly damped

These particular filters were designed for the LASTI QUAD, with the gains copied and pasted without really looking at anything more than the ring down time, and (they haven't [changed/been tuned] since Brett's QUAD at LASTI  4 years ago, and therefore what gains were in place in March are still in place now).

(2) Then, just because cross-coupling came up in conversation, I show the "detail" plots for each of the damped data sets. In particular, take a look at the cross-coupling plots (pgs 7-19) to get a direct measurement of the cross coupling between various degrees of freedom. Note that I've added the Y to L / L to Y plot (pg 13), which is not normally shown because it's not a physically expected cross-coupling. Why? Because we were at one point confused as to whether the excess motion was in Pitch or Yaw. I think, because of the spectra shown yesterday, now we're reasonably convinced that the excess motion during quiescent times is Pitch.

It's admittedly quite difficult to discern and information from these plots, because they're in all sorts of different units... but you can eye-ball it, and see that what cross-coupling does exist is reasonably well below the "diagonal" terms of the transfer function. On the to-do list: make these plots more readable by [converting them into/using] the conversion from rad to m (either modeled or measured).

------------

I'll post a separate log with what I think is going on, with better data to prove it, but I'll say here just in case people are impatient:

- L is totally undamped, both in L and P. The tons of excess motion seen in P at 0.43 and 1.0 Hz are L modes, that, because of fundamental cross coupling are showing up a lot in P. As of yet, we only have a good measure of the test mass P, since we don't have any cavities to measure the L.
- Because we're overdamping P so much, when those who saw only pitch increased the P gain, the loop went unstable, so we couldn't solve the problem directly.
- From the looks of the open loop gain plots (which will be shown in a separate log, where I'll spell out the problem and solution in greater detail) my proposed "quick fix" solution:
    Decrease the P gain by 3.
    Increase the L gain by 10.
See if that works / helps.


OK. I wanna show the open loop plots, so lemme get this up and out, so I can start working on that aLOG.
Non-image files attached to this report

Comments related to this report
Increased H2:SUS-ETMY_M0_DAMP_L_GAIN by 10 (originally -1, now -10).
Decreased P gain by 3 (originaly -0.1, now -0.033).
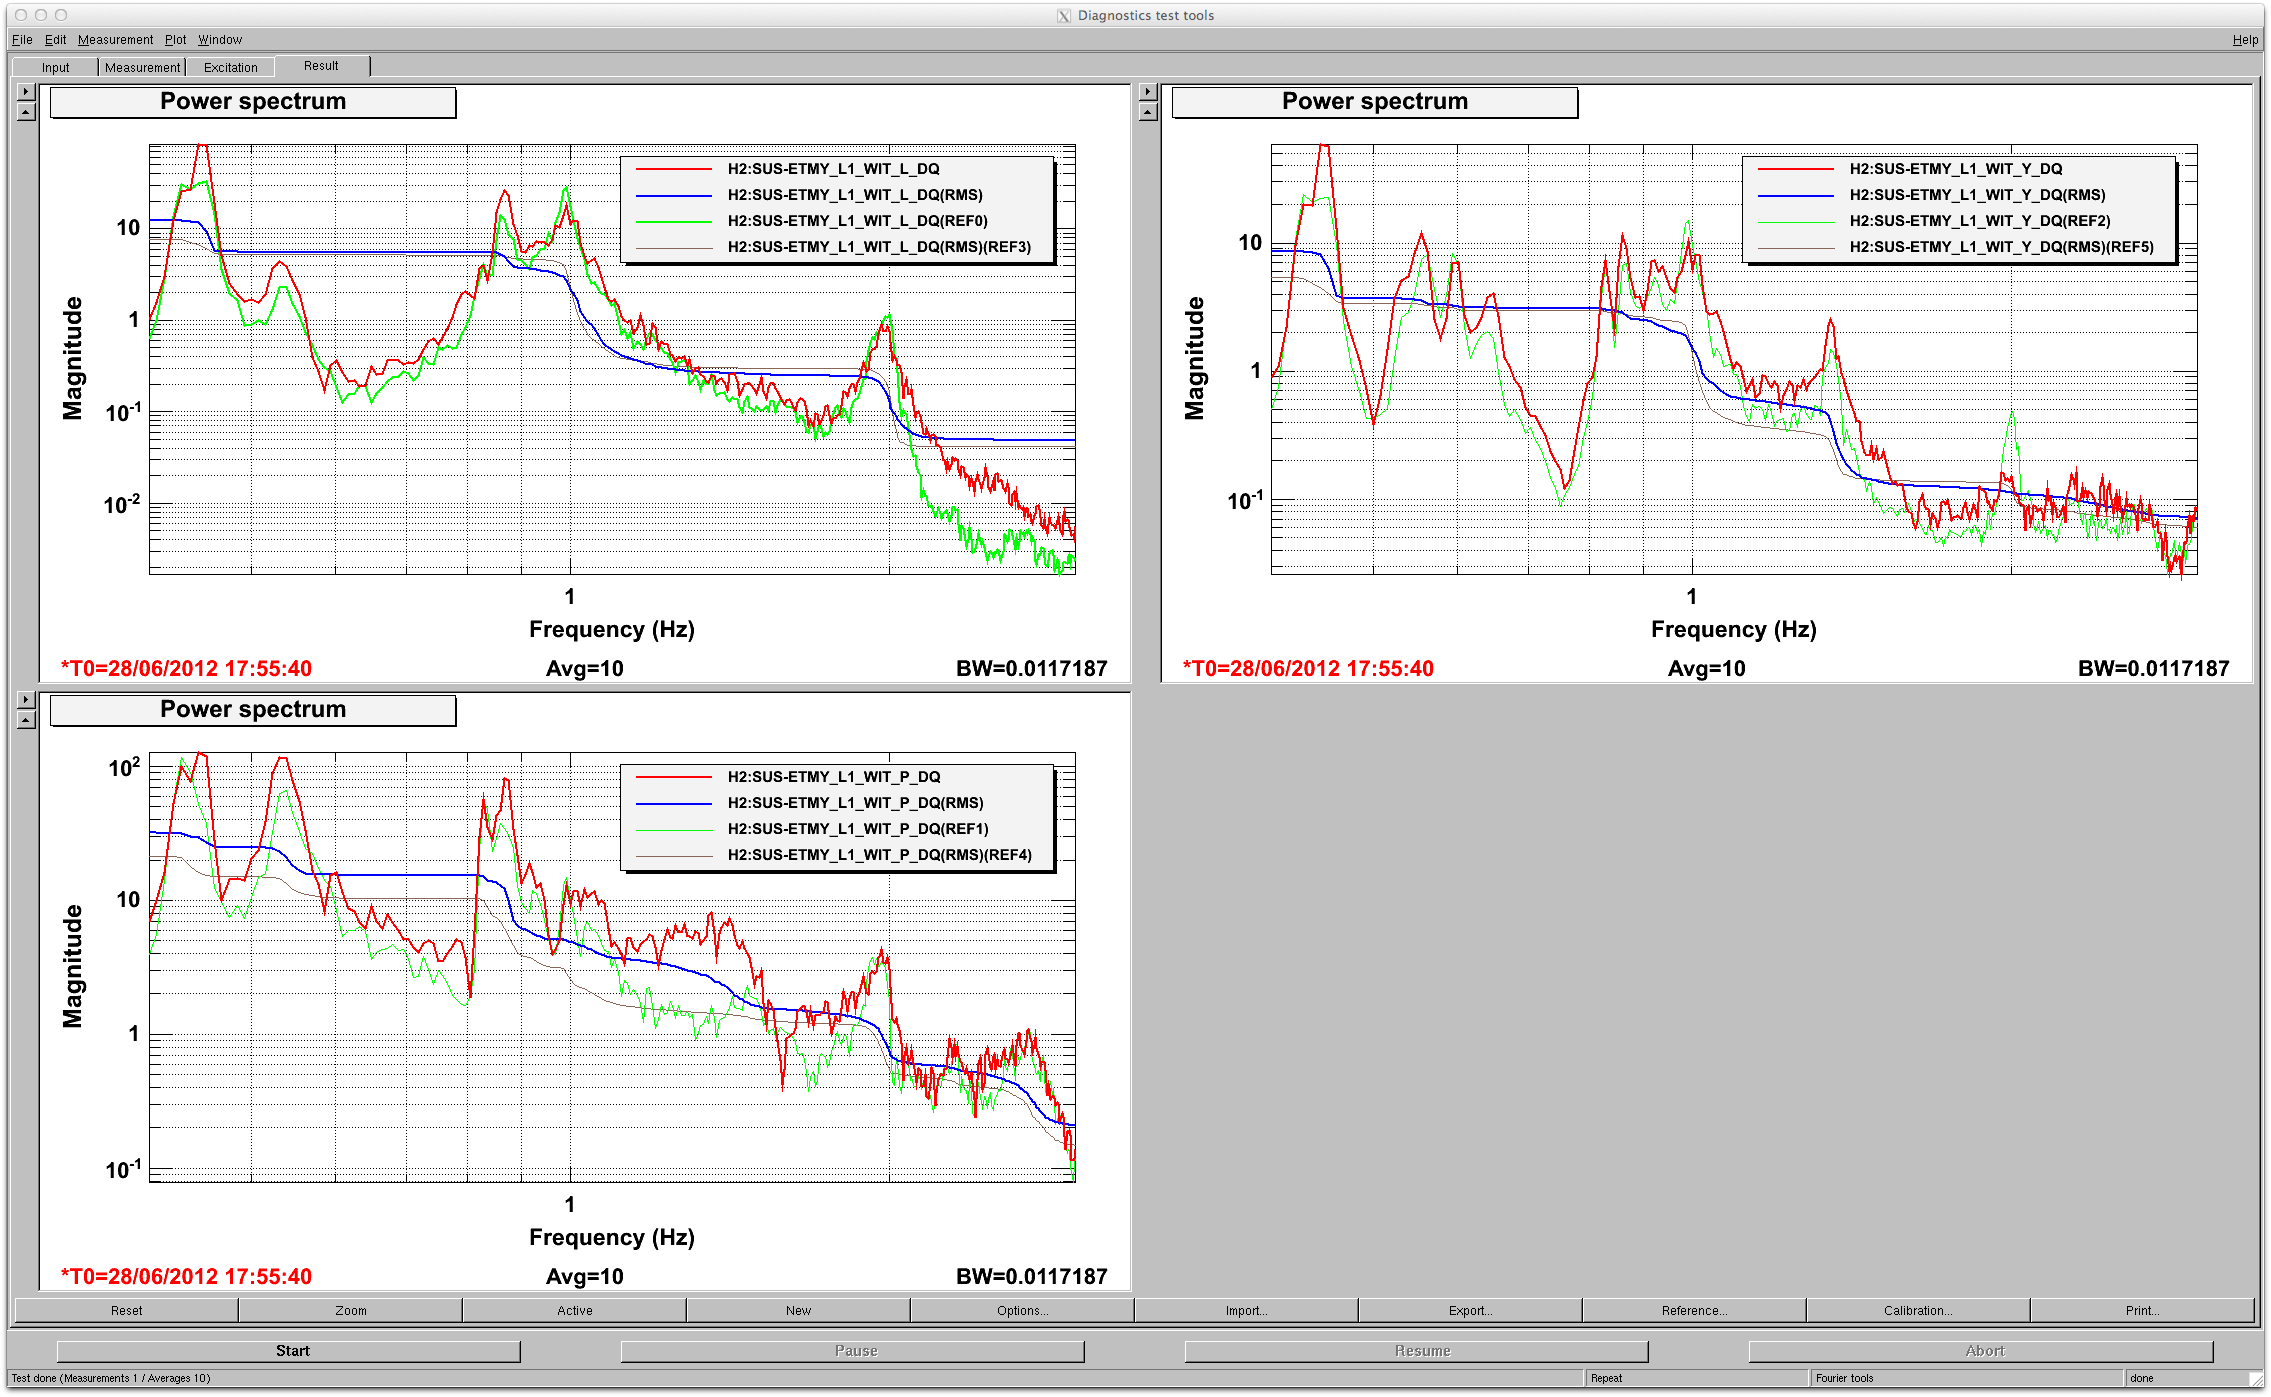
Attached is the plot of L1 (not M0, for no apparent reason other than I felt like it) OSEM signals. Current traces (red/blue) are after the change, references are before.
In general, after the change it looks worse, though this is not an entirely fair comparison as the current data was taken whey people (Elli, Jax, Keita, Gerardo and MikeR) were around and doing stuff but that might not be the case for the references.
Images attached to this comment