aaron.viets@LIGO.ORG - posted 14:43, Wednesday 04 January 2017 - last comment - 18:05, Wednesday 11 January 2017(32965)
DCS filters for LHO data for early O2 A (2016)
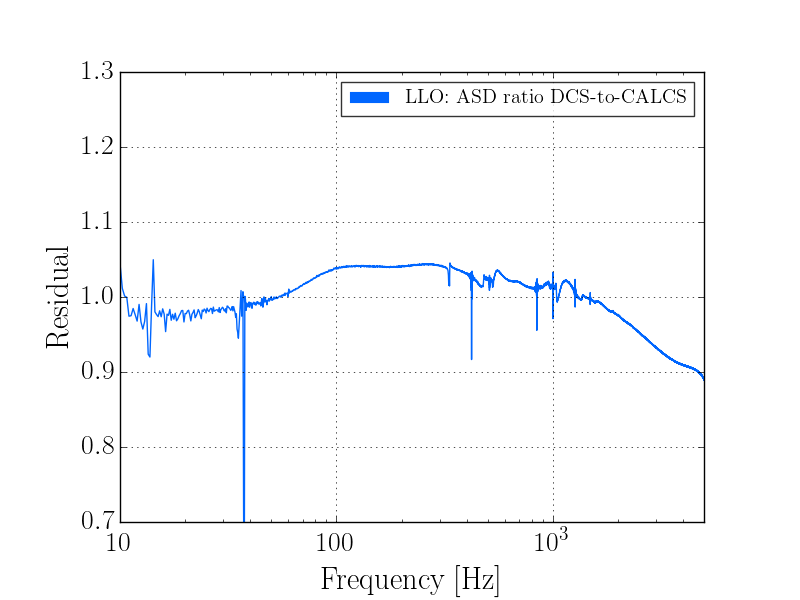
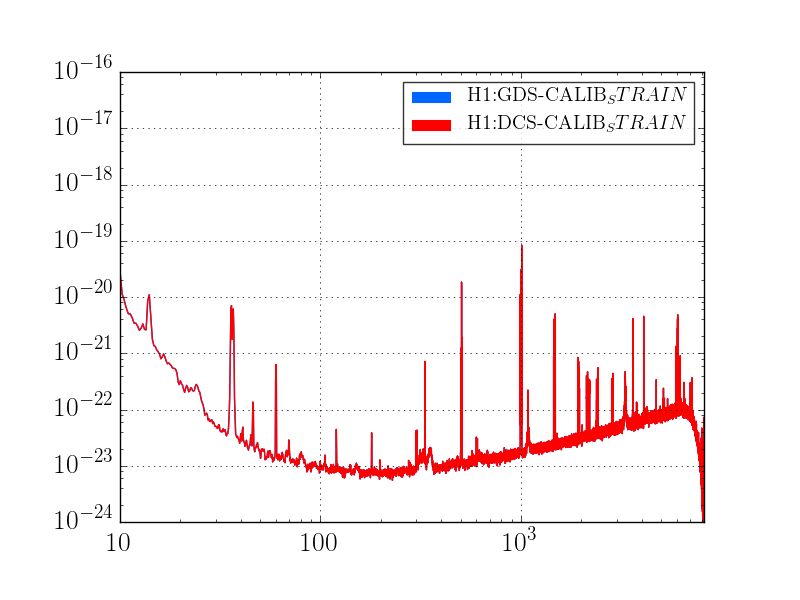
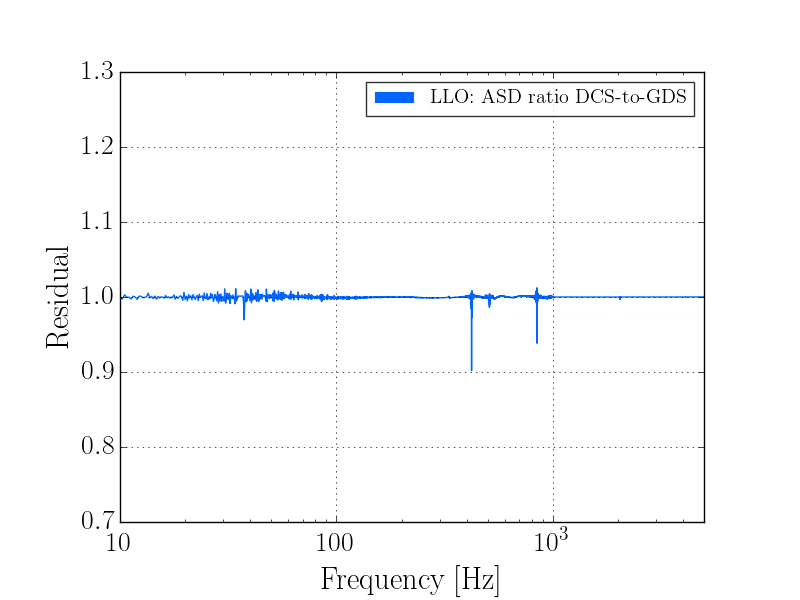
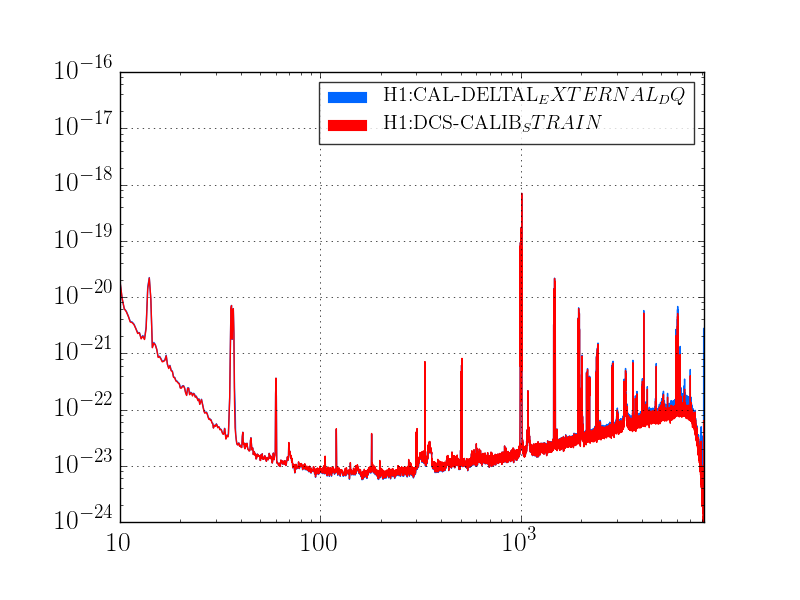
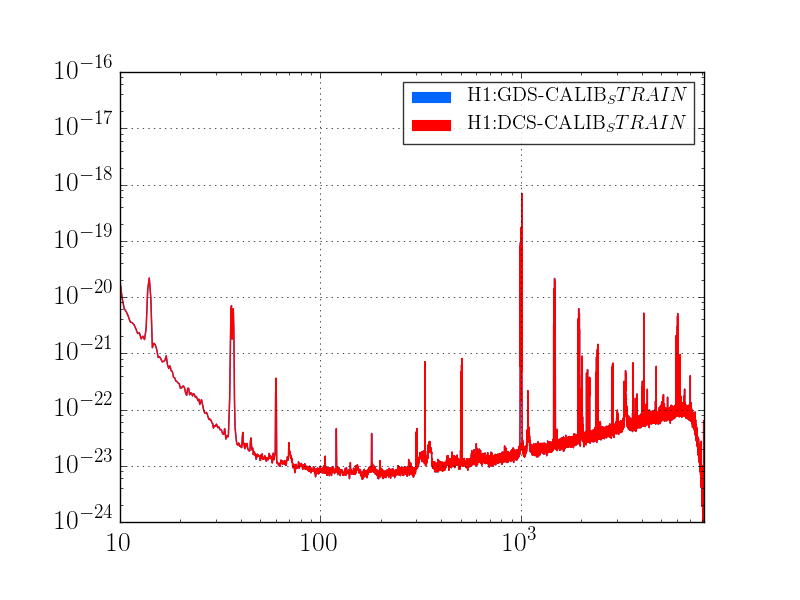
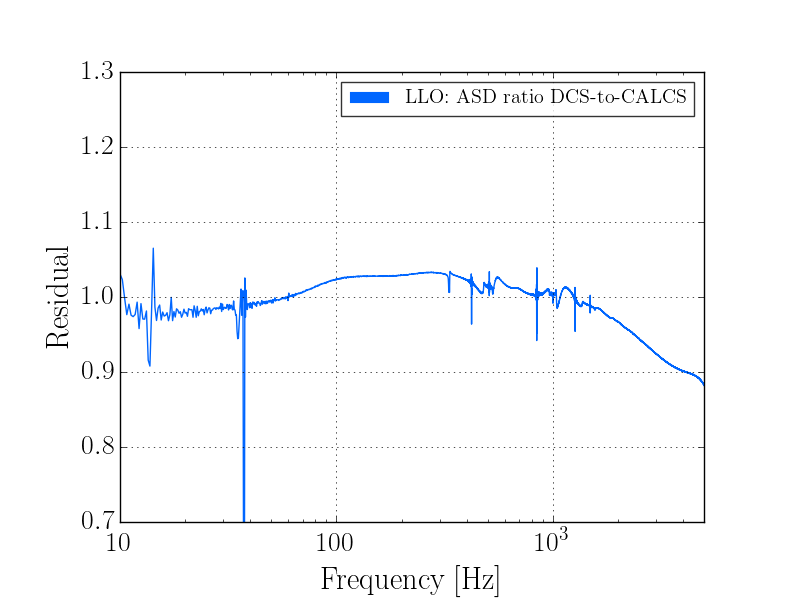
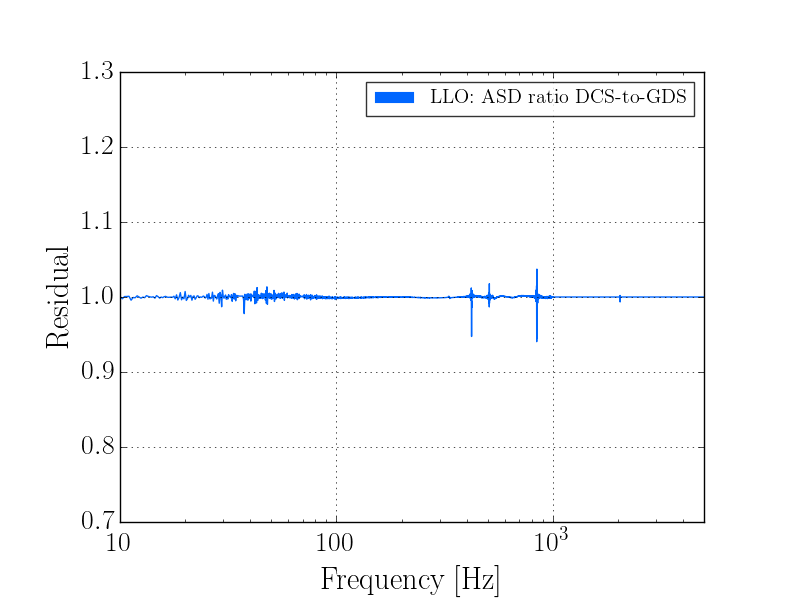
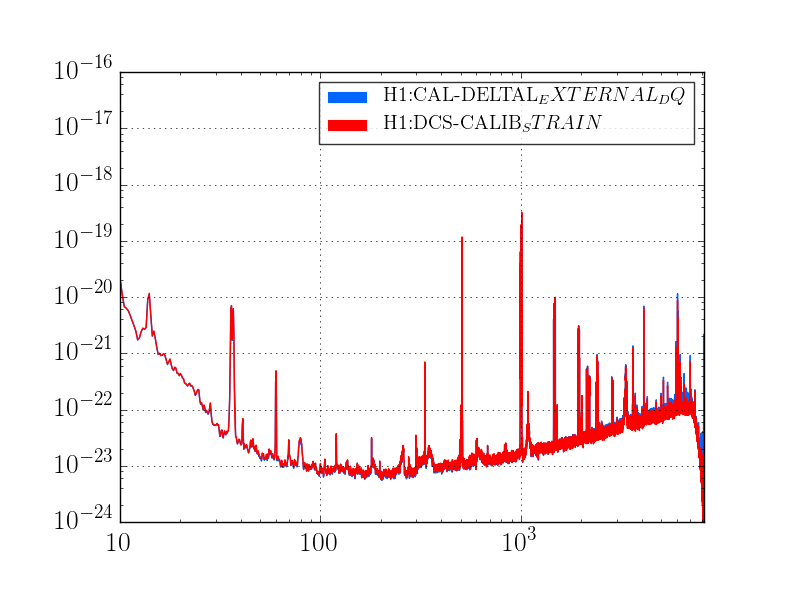
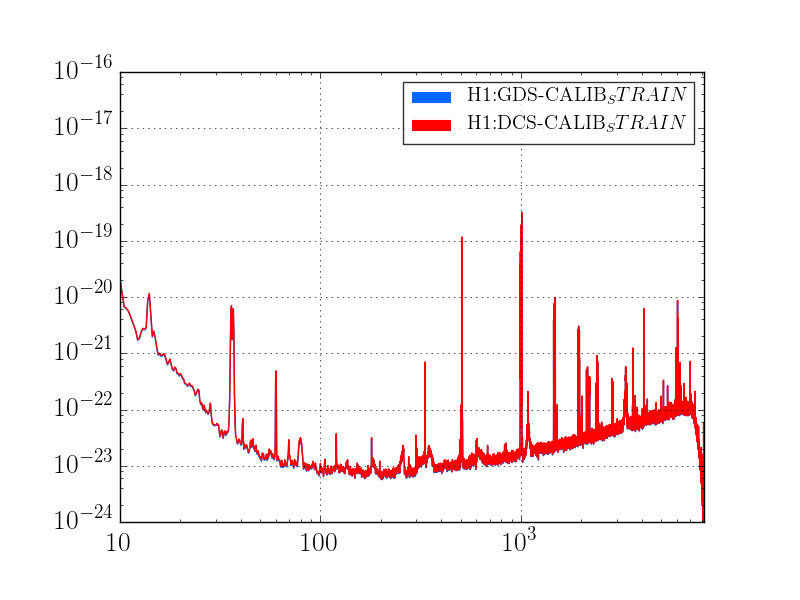
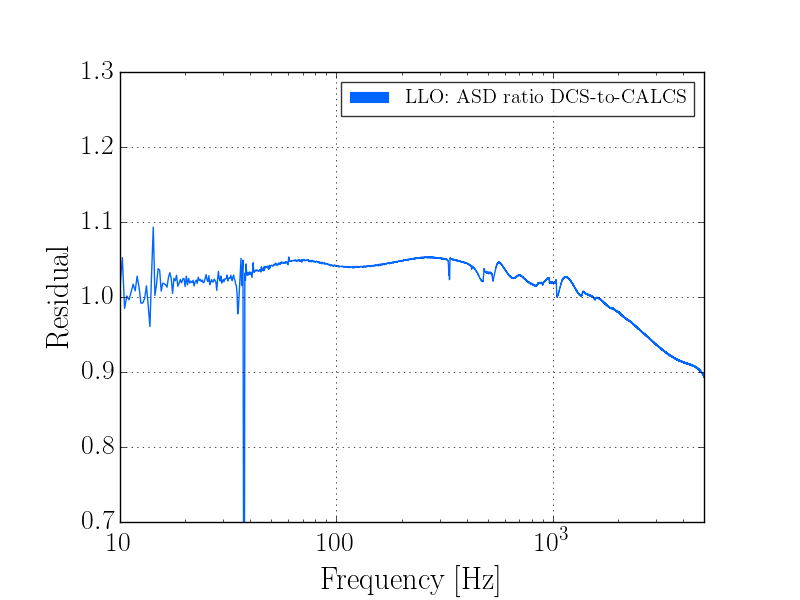
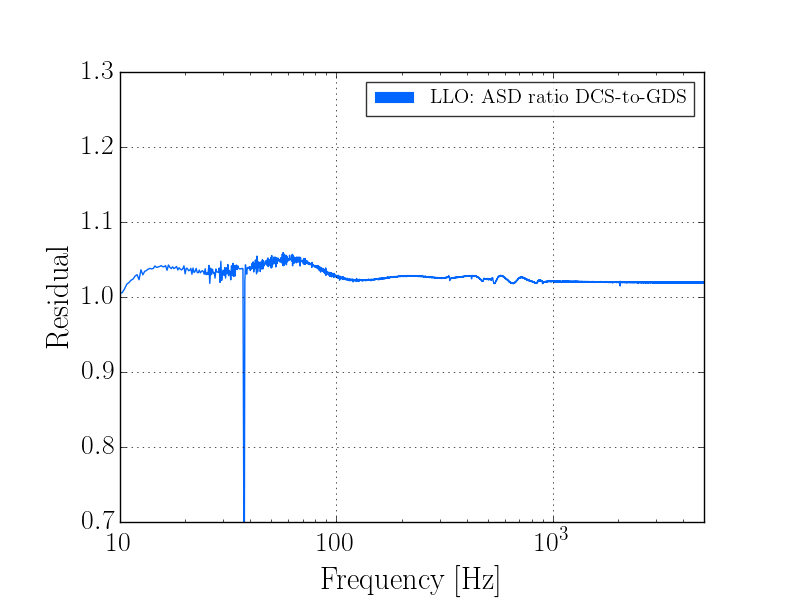
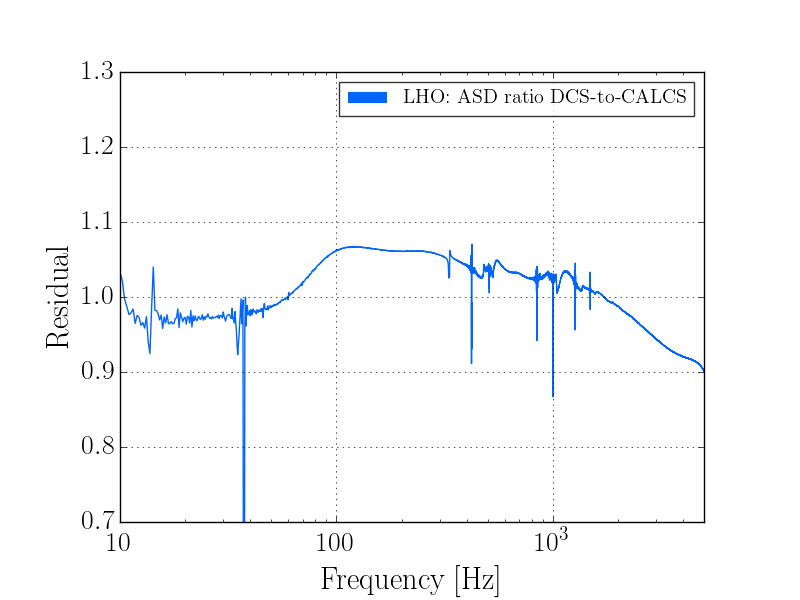
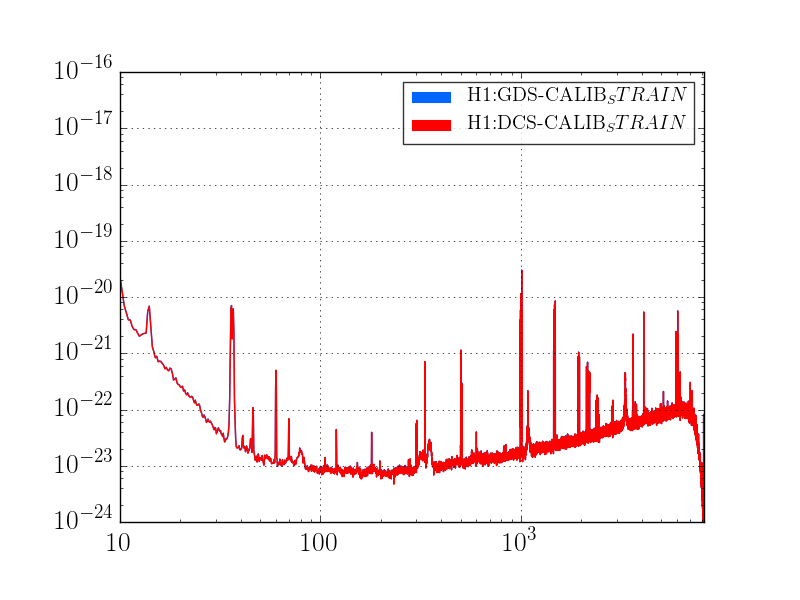
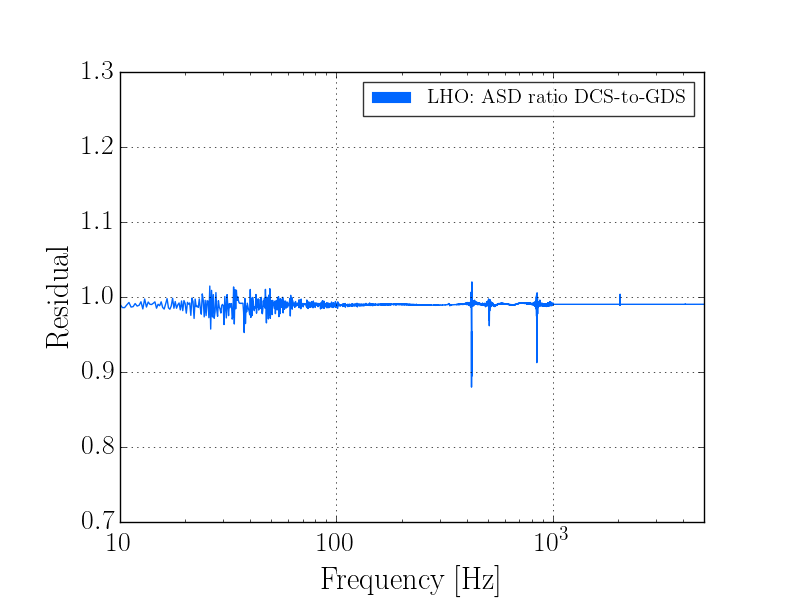
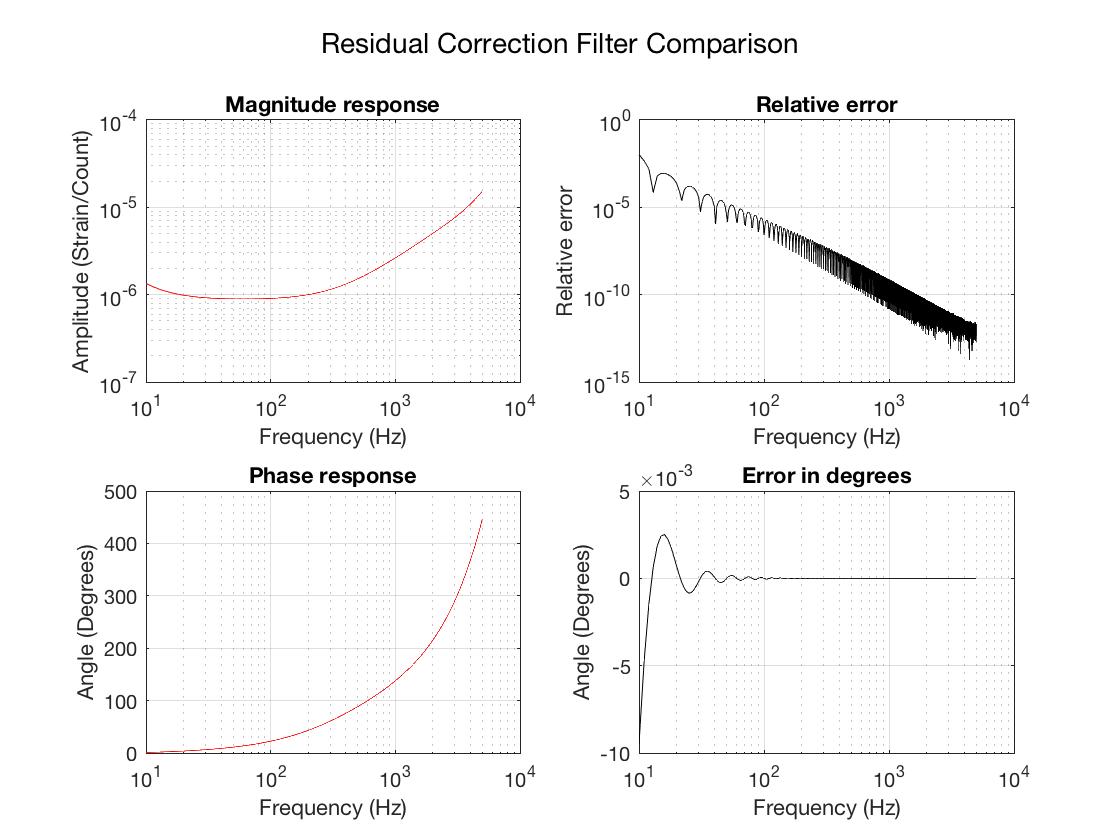
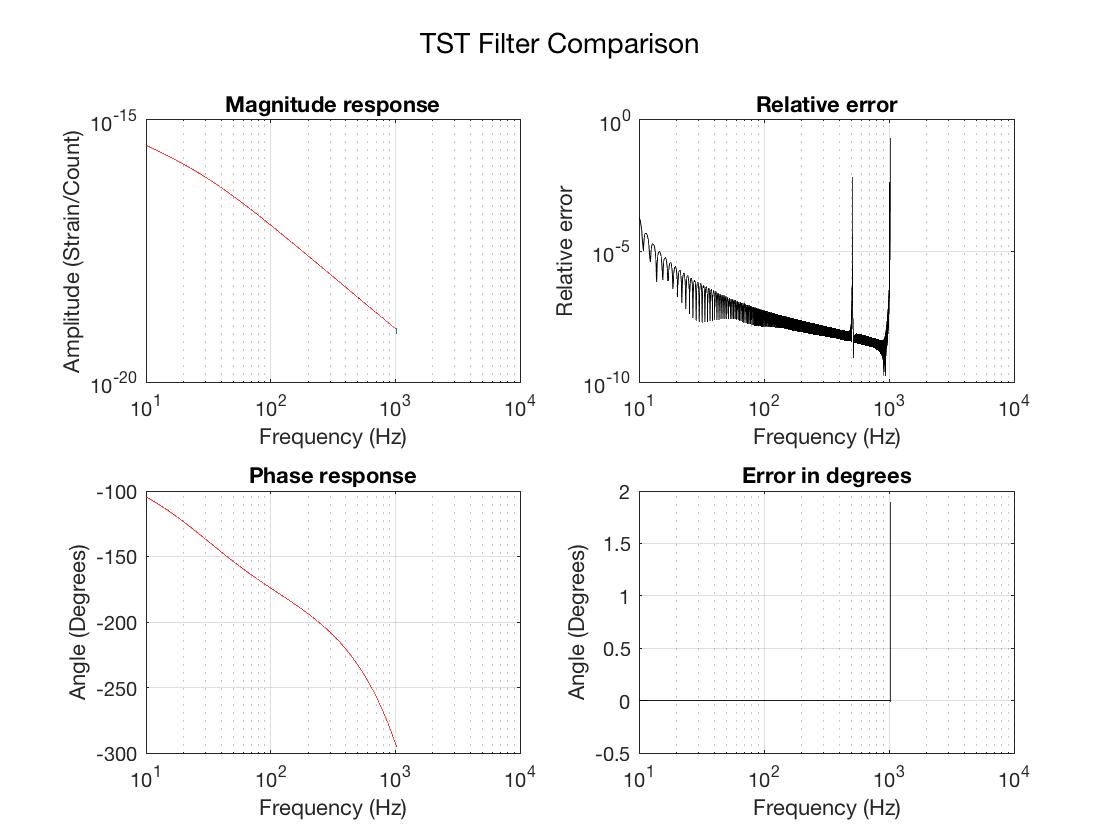
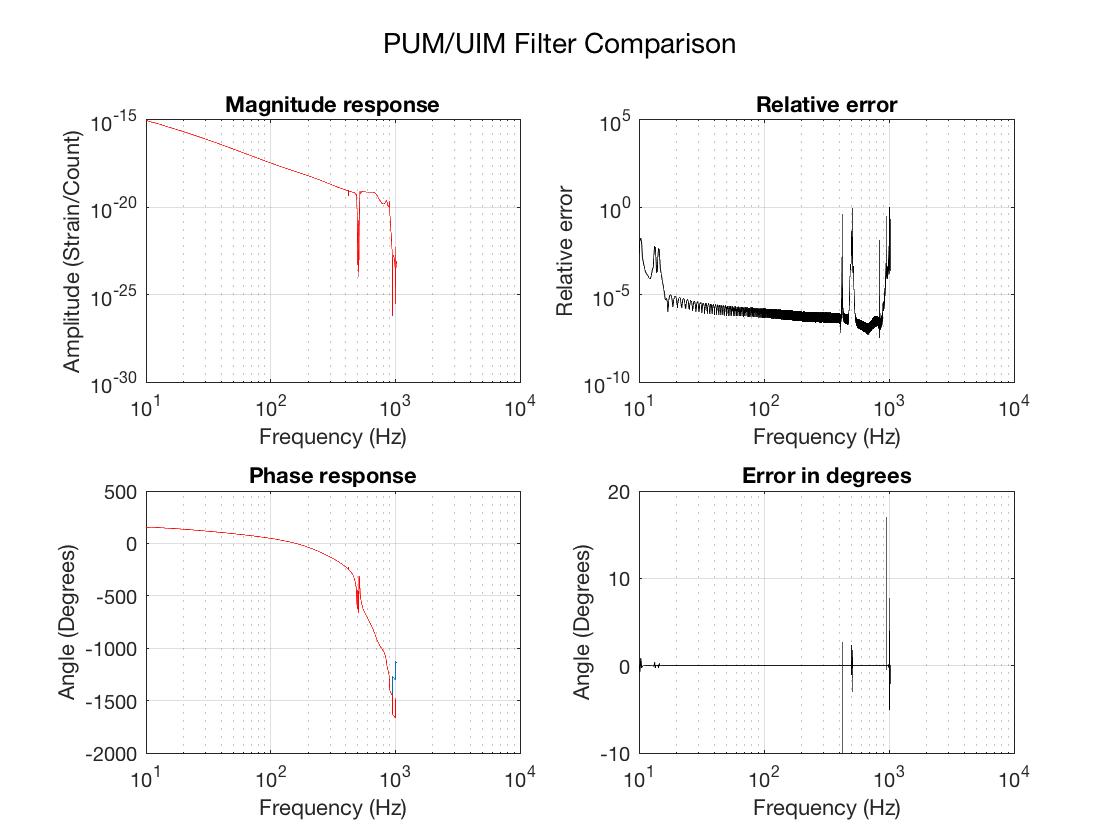
I have produced filters for offline calibration of Hanford data from the beginning of O2 A until the end of 2016. The filters can be found in the calibration SVN at this location:
/ligo/svncommon/CalSVN/aligocalibration/trunk/Runs/O2/GDSFilters/H1DCS_1163173888.npz

For information on the calibration model, see
https://alog.ligo-wa.caltech.edu/aLOG/index.php?callRep=31693
https://alog.ligo-wa.caltech.edu/aLOG/index.php?callRep=32329
https://alog.ligo-wa.caltech.edu/aLOG/index.php?callRep=32907

For suggested command line options to use when calibrating this data, see:
https://wiki.ligo.org/Calibration/GDSCalibrationConfigurationsO2

The filters were produced using this Matlab script in SVN revision 4050:
ligo/svncommon/CalSVN/aligocalibration/trunk/Runs/O2/H1/Scripts/TDfilters/H1_run_td_filters_1163173888.m

The parameters files used (all in revision 4050) were:
ligo/svncommon/CalSVN/aligocalibration/trunk/Runs/O2/Common/params/IFOindepParams.conf
ligo/svncommon/CalSVN/aligocalibration/trunk/Runs/ER10/H1/params/H1params.conf
ligo/svncommon/CalSVN/aligocalibration/trunk/Runs/ER10/H1/params/2016-11-12/H1params_2016-11-12.conf
ligo/svncommon/CalSVN/aligocalibration/trunk/Runs/O2/H1/params/H1_TDparams_1163173888.conf
ligo/svncommon/CalSVN/aligocalibration/trunk/Runs/ER10/H1/Scripts/CAL_EPICS/D20161122_H1_CAL_EPICS_VALUES.m

Several plots are attached. The first four (png files) are spectrum comparisons between CALCS, GDS, and DCS. Kappas were applied in both GDS and DCS plots with a coherence uncertainty threshold of 0.4%. Time domain vs. frequency domain comparison plots of the filters are also attached. Lastly, brief time series of the kappas and coherences are attached, for comparison with CALCS.
Images attached to this report

Non-image files attached to this report

Comments related to this report
More plots from beginning of O2 (Nov 30) to show that these filters still have the right model and EPICS.
Images attached to this comment
Non-image files attached to this comment
Same set of plots one more time, this time in early ER10 (Nov 16). Note that kappas were not applied in the GDS pipeline this time, leading to a notable difference in the spectra.
Images attached to this comment
Non-image files attached to this comment
These filters have been updated to account for corrections made to the DARM loop parameters since the AA/AI filter bug fixes. For information on the model changes, see:
https://alog.ligo-wa.caltech.edu/aLOG/index.php?callRep=33153

The updated filters were produced using all the same files (updated versions) in SVN revision #4133. The only exception is that the EPICS file and the parameters file to produce it were:
/ligo/svncommon/CalSVN/aligocalibration/trunk/Runs/ER10/H1/Scripts/CAL_EPICS/DCS20161112_H1_CAL_EPICS_VALUES.m
/ligo/svncommon/CalSVN/aligocalibration/trunk/Runs/ER10/H1/Scripts/CAL_EPICS/callineParams_20161118.m

Note from the plots the slight discrepancy between GDS and DCS, presumably due to the corrections to the model. Also note that DCS and CALCS do not agree on the kappas. This is likely not cause for concern, as the model used to compute them was different. The EPICS and pcal correction factors were produced using the same parameter files as the filters, so they should be correct.
Images attached to this comment

Non-image files attached to this comment