J. Kissel, S. Dwyer, E. Goetz, K. Venkateswara

We're lamenting last night's severe decay in range, and the gross long term trend toward zero since the restart after the break. Our most said theory (which doesn't make it the best or the right theory) is temperature adversely affecting the global alignment system's operating point, which has steered the IFO into a place with much worse scattering coupling. As such the anthropogenic noise (3-10, 10-30 Hz BLRMS of ground motion) is now adversely affecting the IFO much more than in the past.

We'd like DetChar's help to confirm:
- We've lost our fellow whom has run BruCo for us. Does detchar in general know how to run BruCo, or does Gabriele need to teach new people again? We suggest that no coherence with any particular channel would confirm the non-linear process of scattering.
- We see summary page spectrograms showing excess noise, but they're too long of a time scale to tell if the features are scattering arches.

Note that Bubba had started plowing at the X-End this morning, so data from ~17:00 UTC will show elevated 3-10 and 10-30 Hz BLRMS seismic noise there. So we understand that ground motion is much higher then, and because of the greater sensitivity to it (again, claiming the alignment operating point increases scattered light coupling theory) -- the problem is overnight when there appears to be no elevation in seismic noise, but the range is still terrible.

Any other ideas are welcome.

--------
Also because Bubba was going down to the X-end, we turned off sensor correction at 16:52 UTC (LHO aLOG 33221). This looks to coincide with the 1080 Hz glitching getting worse on the summary pages. This is consistent with the OMC length noise increase investigations we've done over the past few days (LHO aLOG 33104 and LHO aLOG 33037).
Andy ran Bruco on this already: https://ldas-jobs.ligo.caltech.edu/~lundgren/aDQ/bruco/H1_1168346418_OMC_DCPD/
Josh, TJ, Jess, Alex
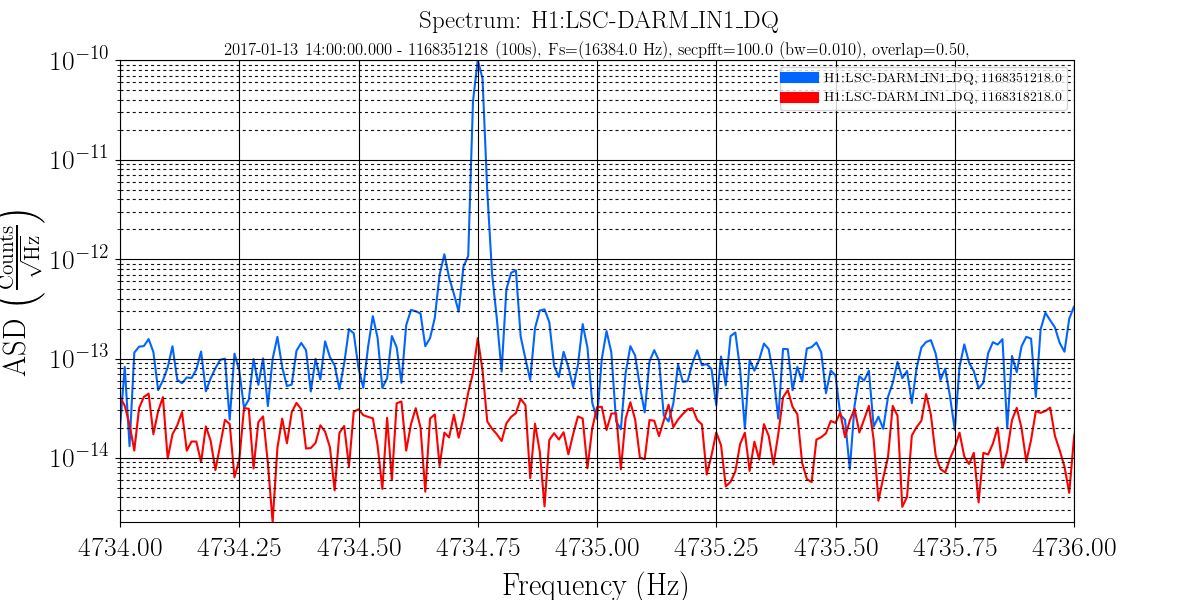
This looks like PI ringing up. In the spectrogram posted above there is a line at 4734.75Hz that grows around the time of the noise. Here are some plots:
Fig 1: the line at 4734.75
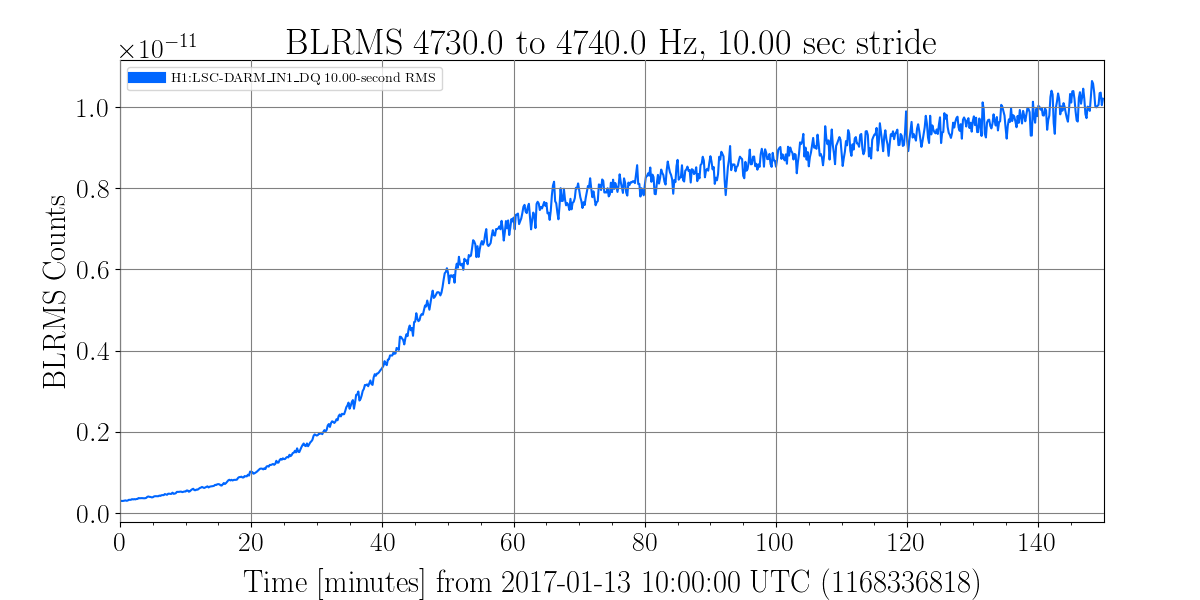
Fig2: a BLRMS of this line vs time it grows alot.
Fig3: 8.8 hours of the line growing from onset of noise to really ratty time.
We will work harder to tie this to the noise. We've started looking back at earlier pages and seeing this line rising around times that noise rises but have work to do to tie them together.
There are three things that we can try to improve or investigate the drop in range as Patrick relocks.
- We will stop to damp the violin mode harmoinc that Josh noted above (30281 for solution to this problem in the past, note that notching this in the DARM loop before damping it was important). Jim W and Patrick are currently working on this.
- Based on the BRUCO that Laura linked above it looks like we have higher coherence with things related to SRCL/MICH/PRCL coherence than in the past, so we can try some quick injections to check that our feedforward is still well tuned.
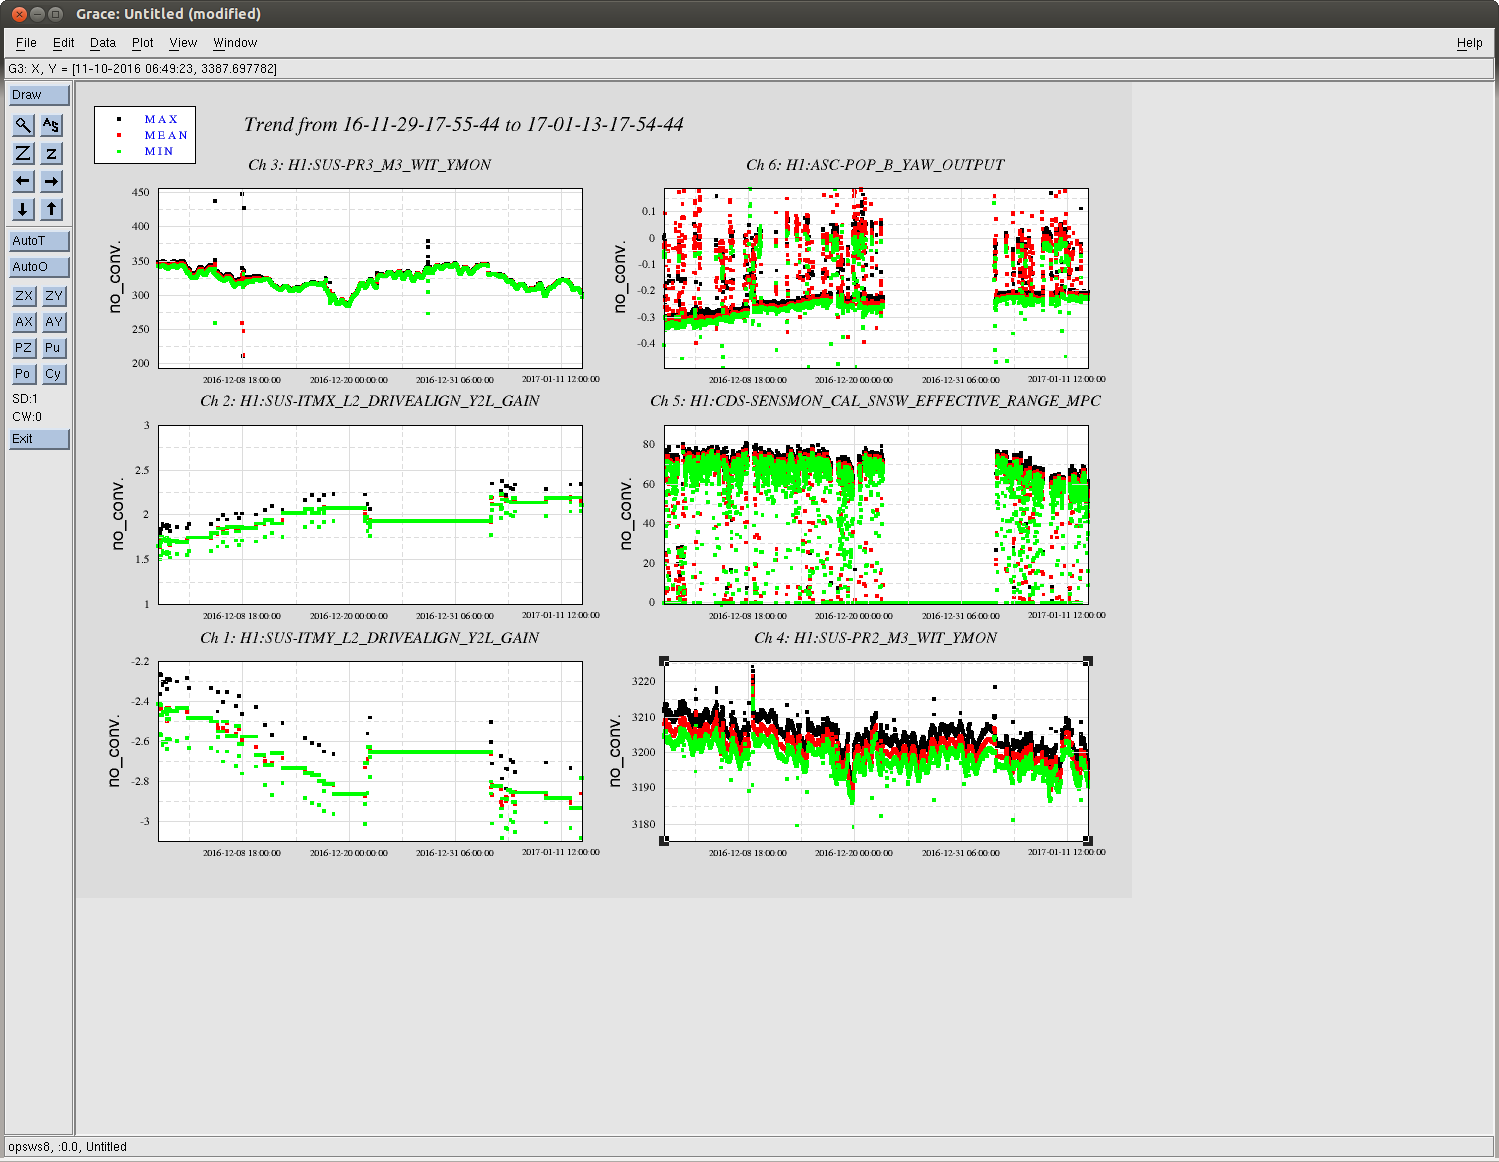
- We also have several reasons to think that we have slowly drifted away from the center of the optics on both ITMs in the horizontal direction (screenshot attached of the a2l gains which indicate the spot position on the optic, PR3 and PR2 yaw witness sensors, POPB yaw which is our out of loop QPD in the PRC, and the range over the last 45 days.) We can adjust this using the PR3 spot move script to see if things get any better.
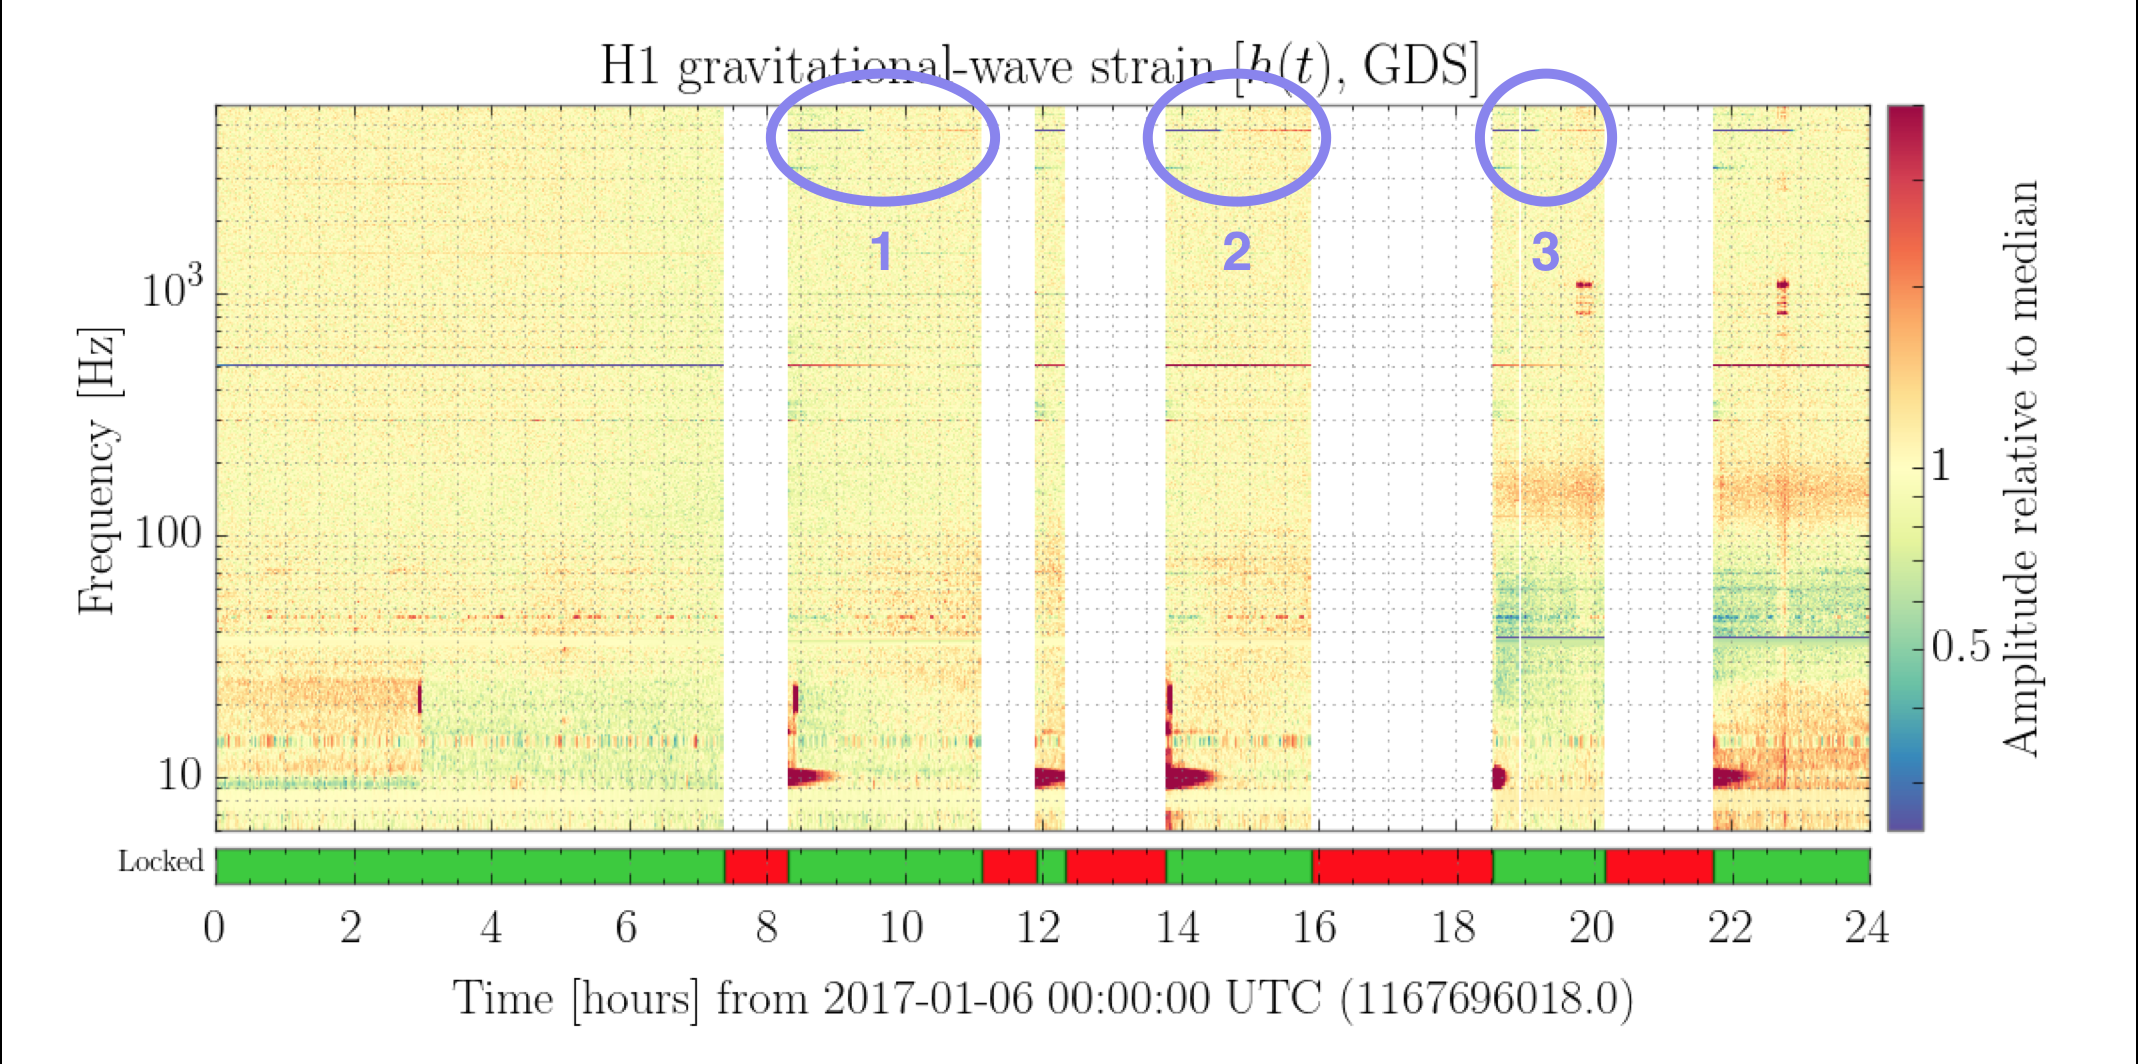
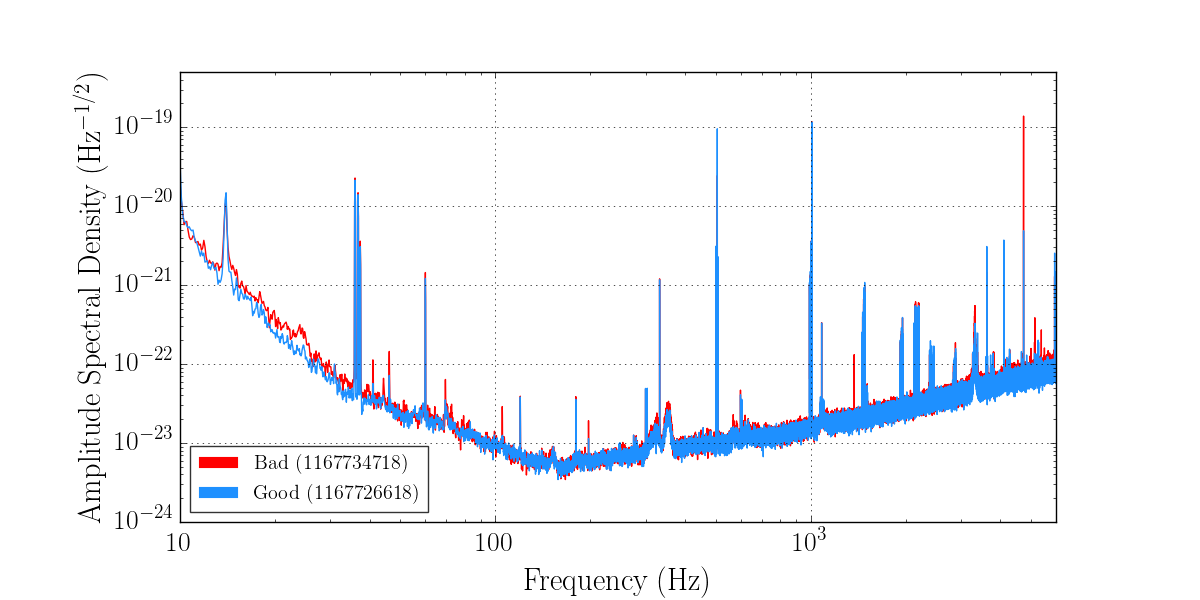
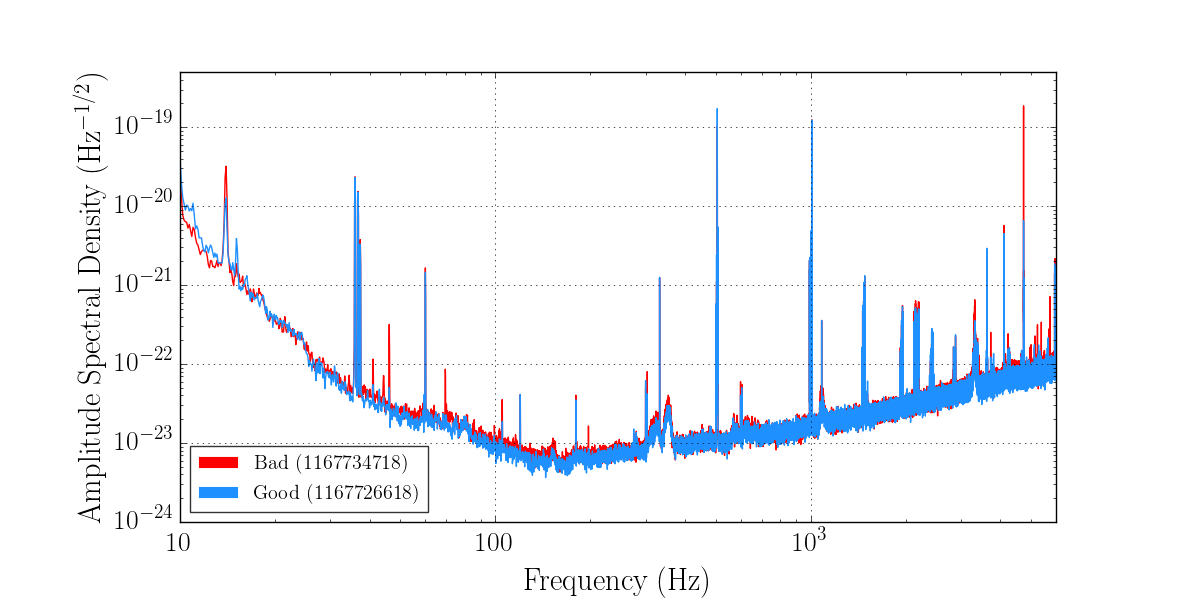
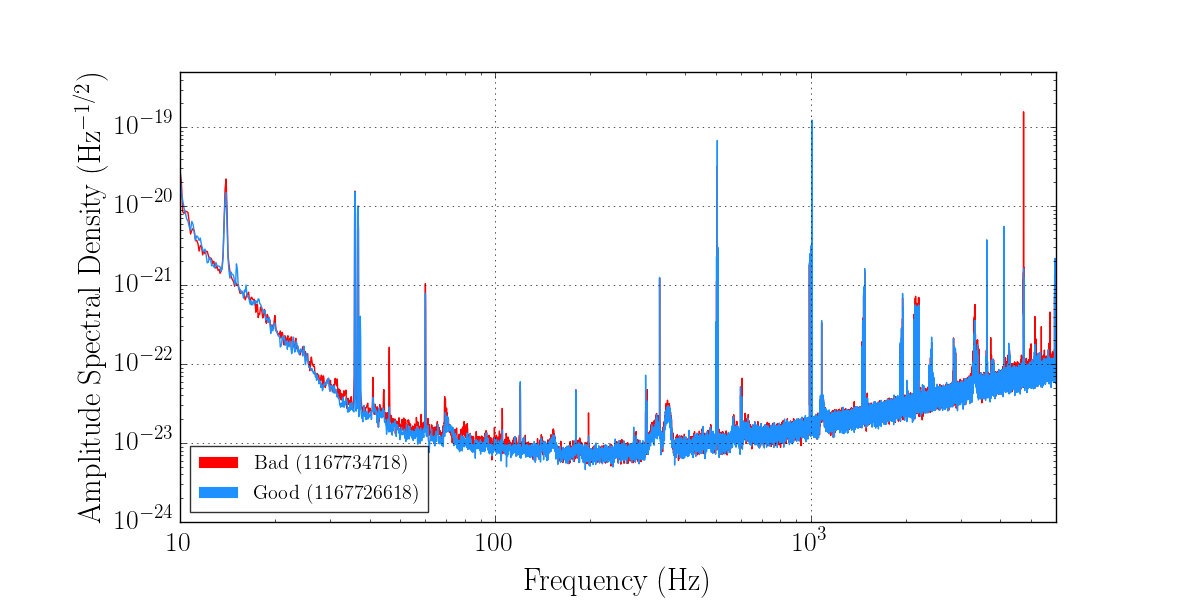
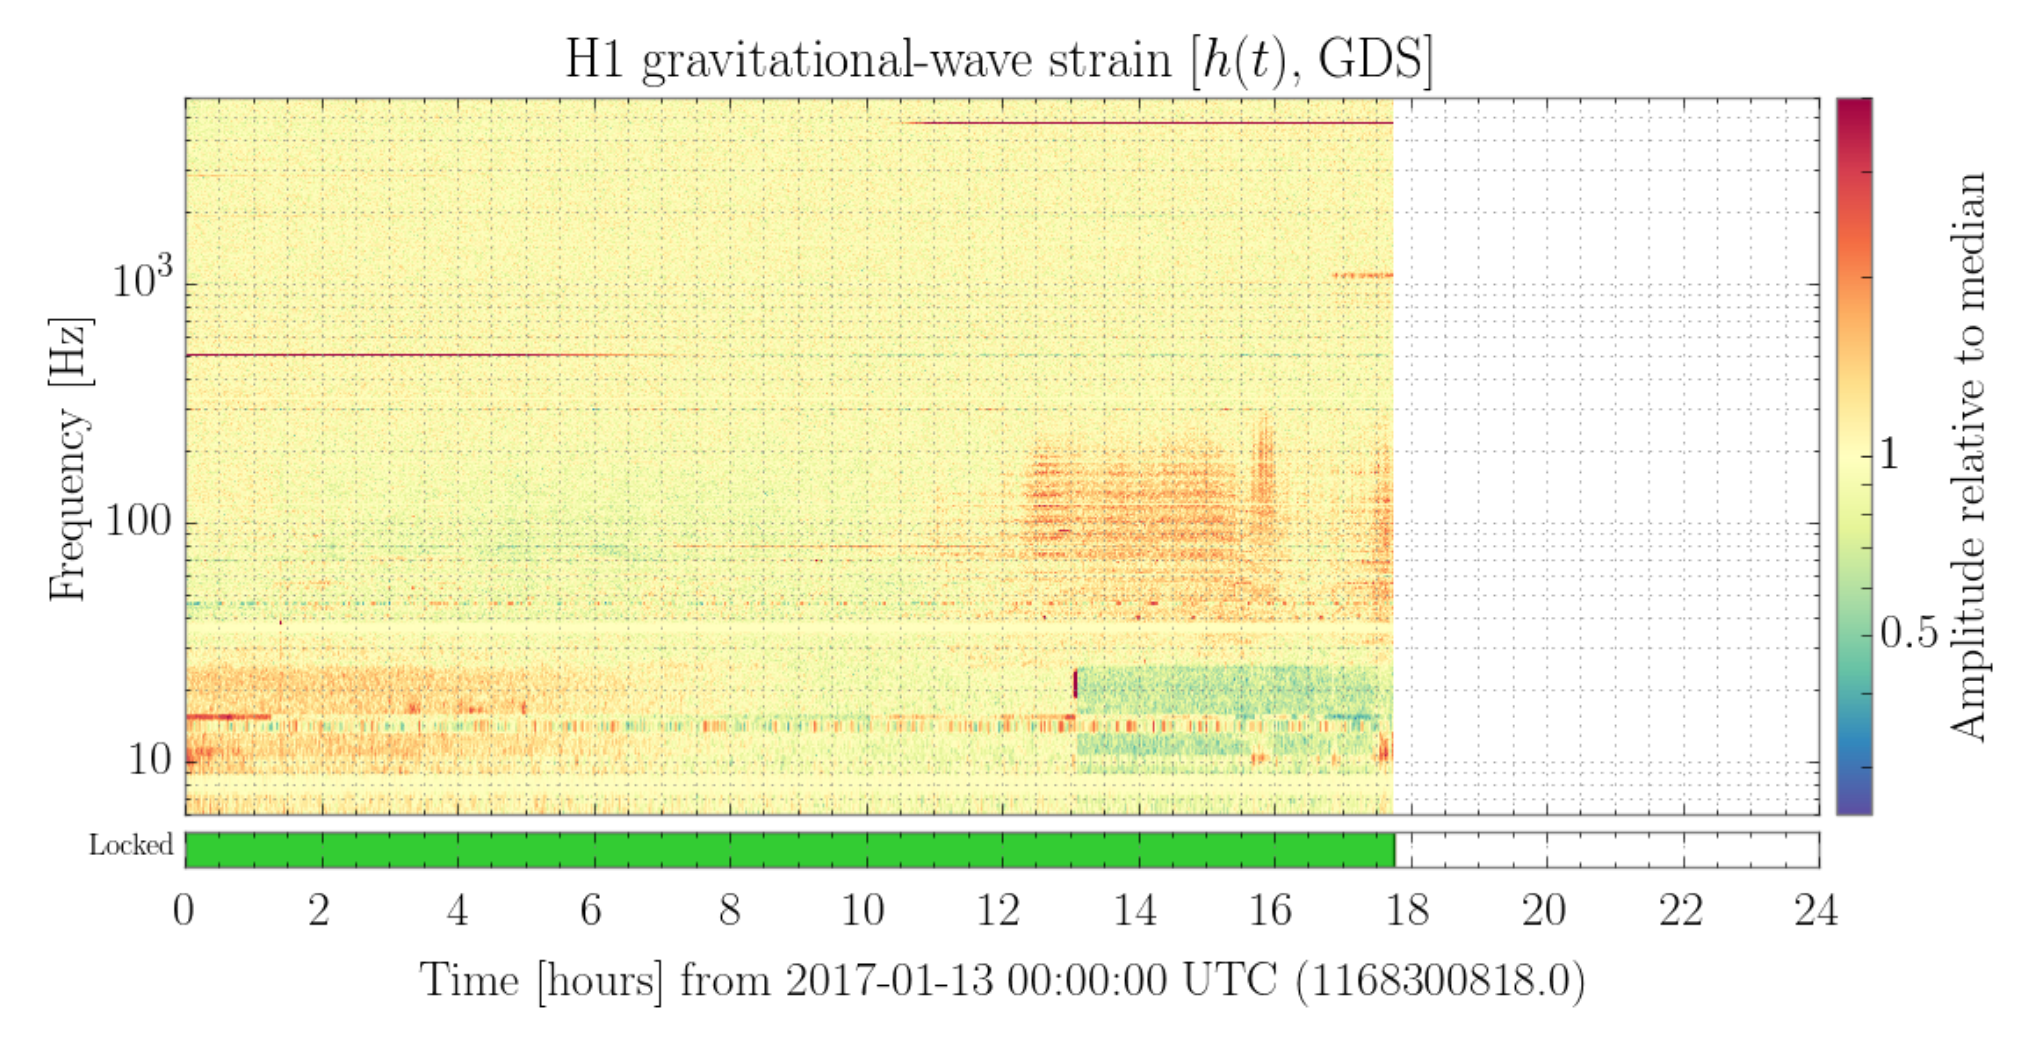
Josh Smith, Jess, TJ and I have investigated a bit and found that there is a line around 4700 Hz (Fig. 1) that rings up around the same time as a scratchy forest of lines in mid-range frequencies, right in the bucket. At Josh's suggestion I took a comparative look at the beginnings and ends of three lock stretches on Jan 6 where this pattern rings up (the circled regions in Fig. 1). The last three figures show 10-second averaged spectra of 100 seconds of data gathered at the start and end of these lock stretches (GPS times given in the plots). "Good" periods, where there is no 4.7 kHz line, are shown in blue; "bad" periods where the line shows up are plotted in red. You can clearly see the ASD of H1:GDS-CALIB_STRAIN is systematically worse between 70-500 Hz when the high-frequency line is rung up, compared to when it wasn't. (We also note this behavior on Friday, 13 Jan, and on a couple of other days back in december, all coincident with a wandering downward trend in BNS range.)