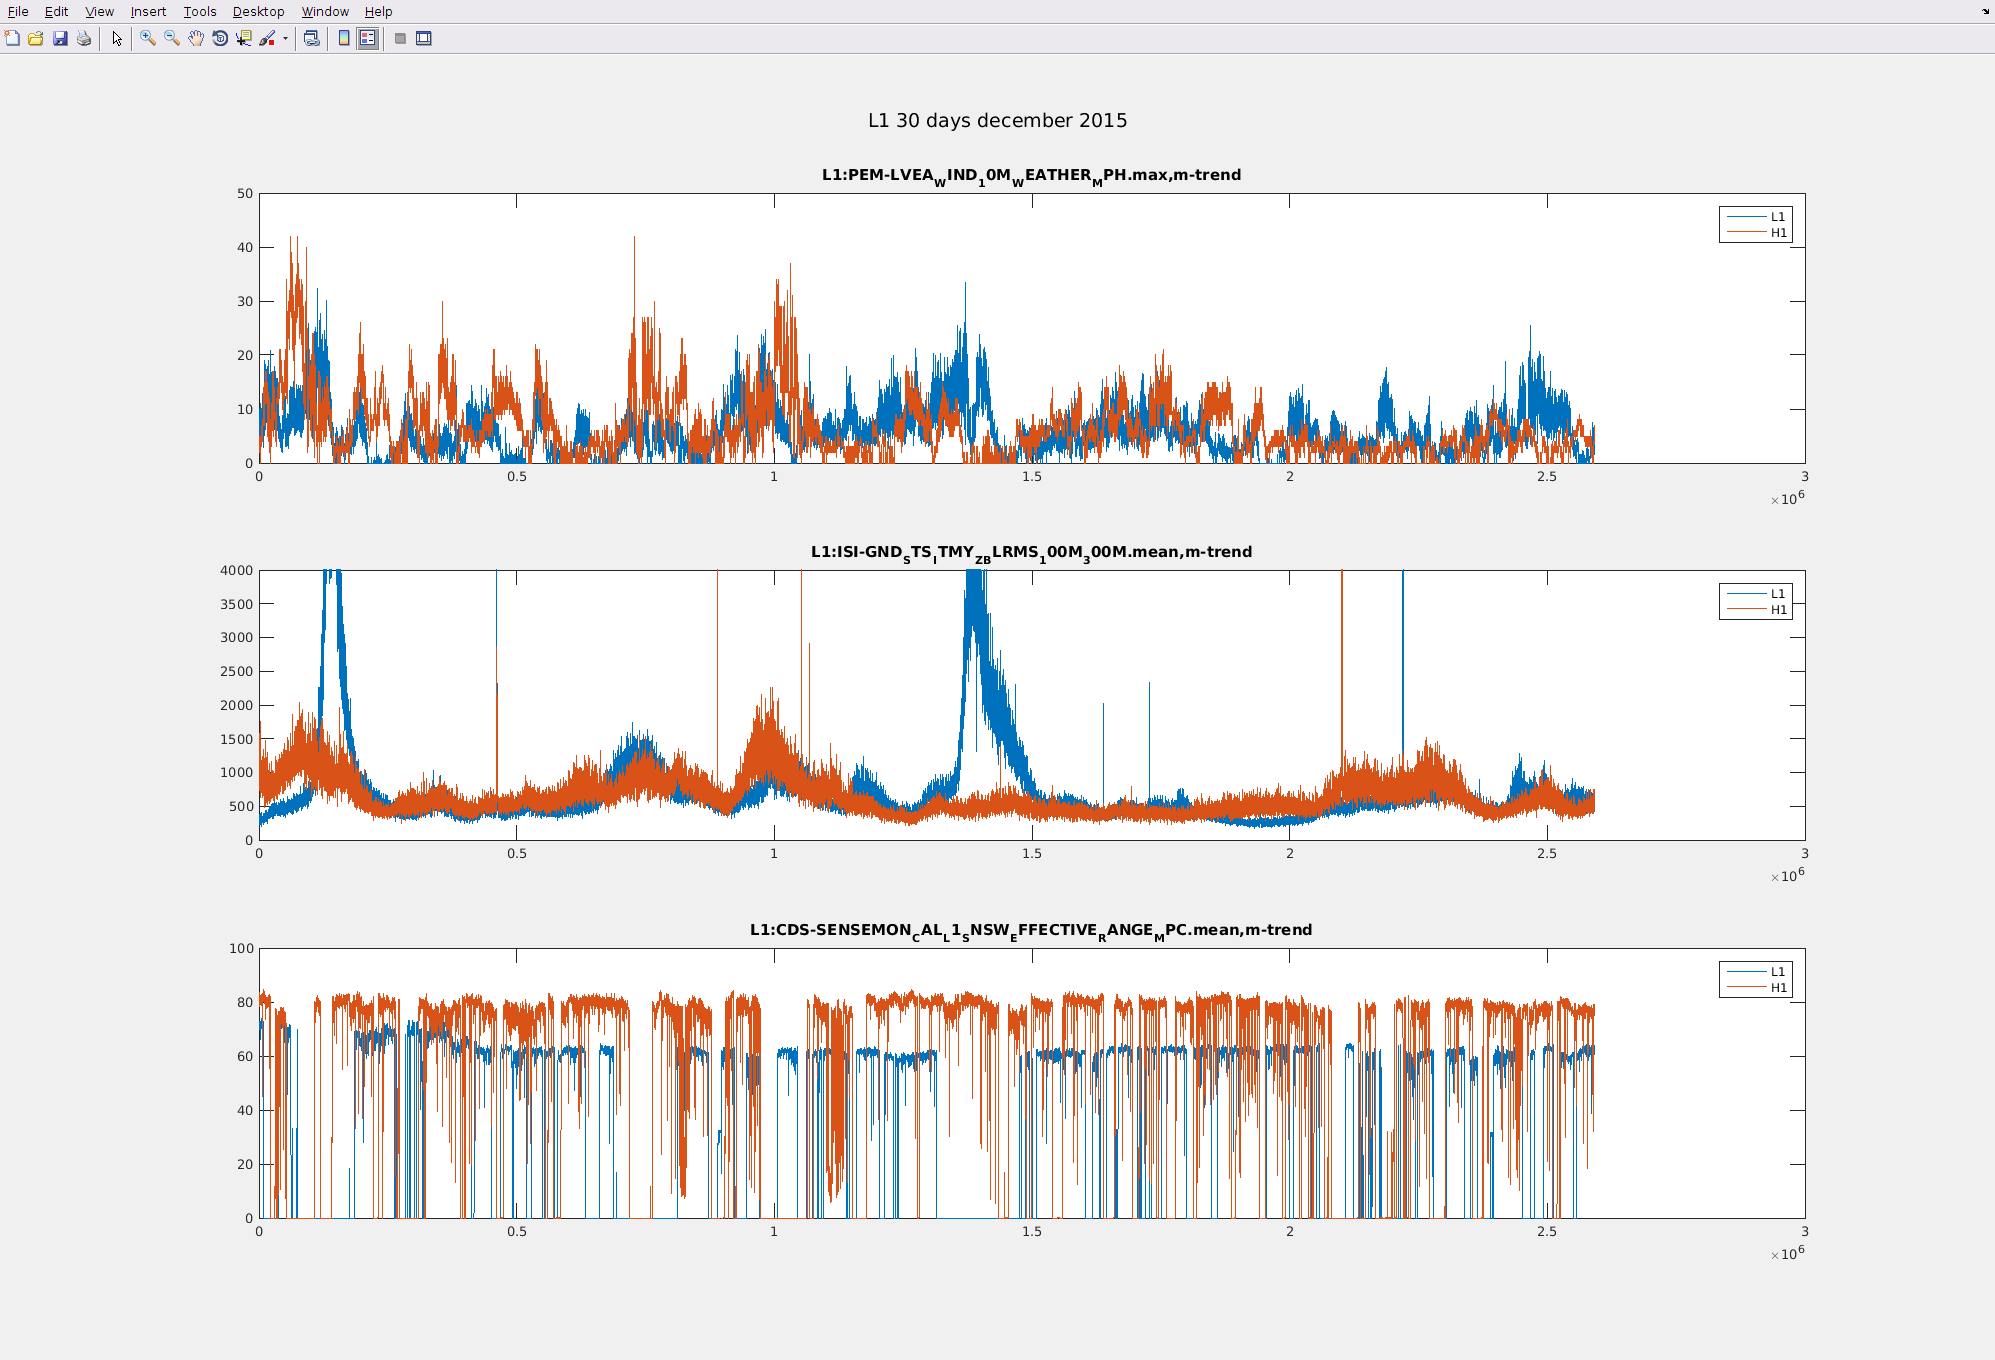
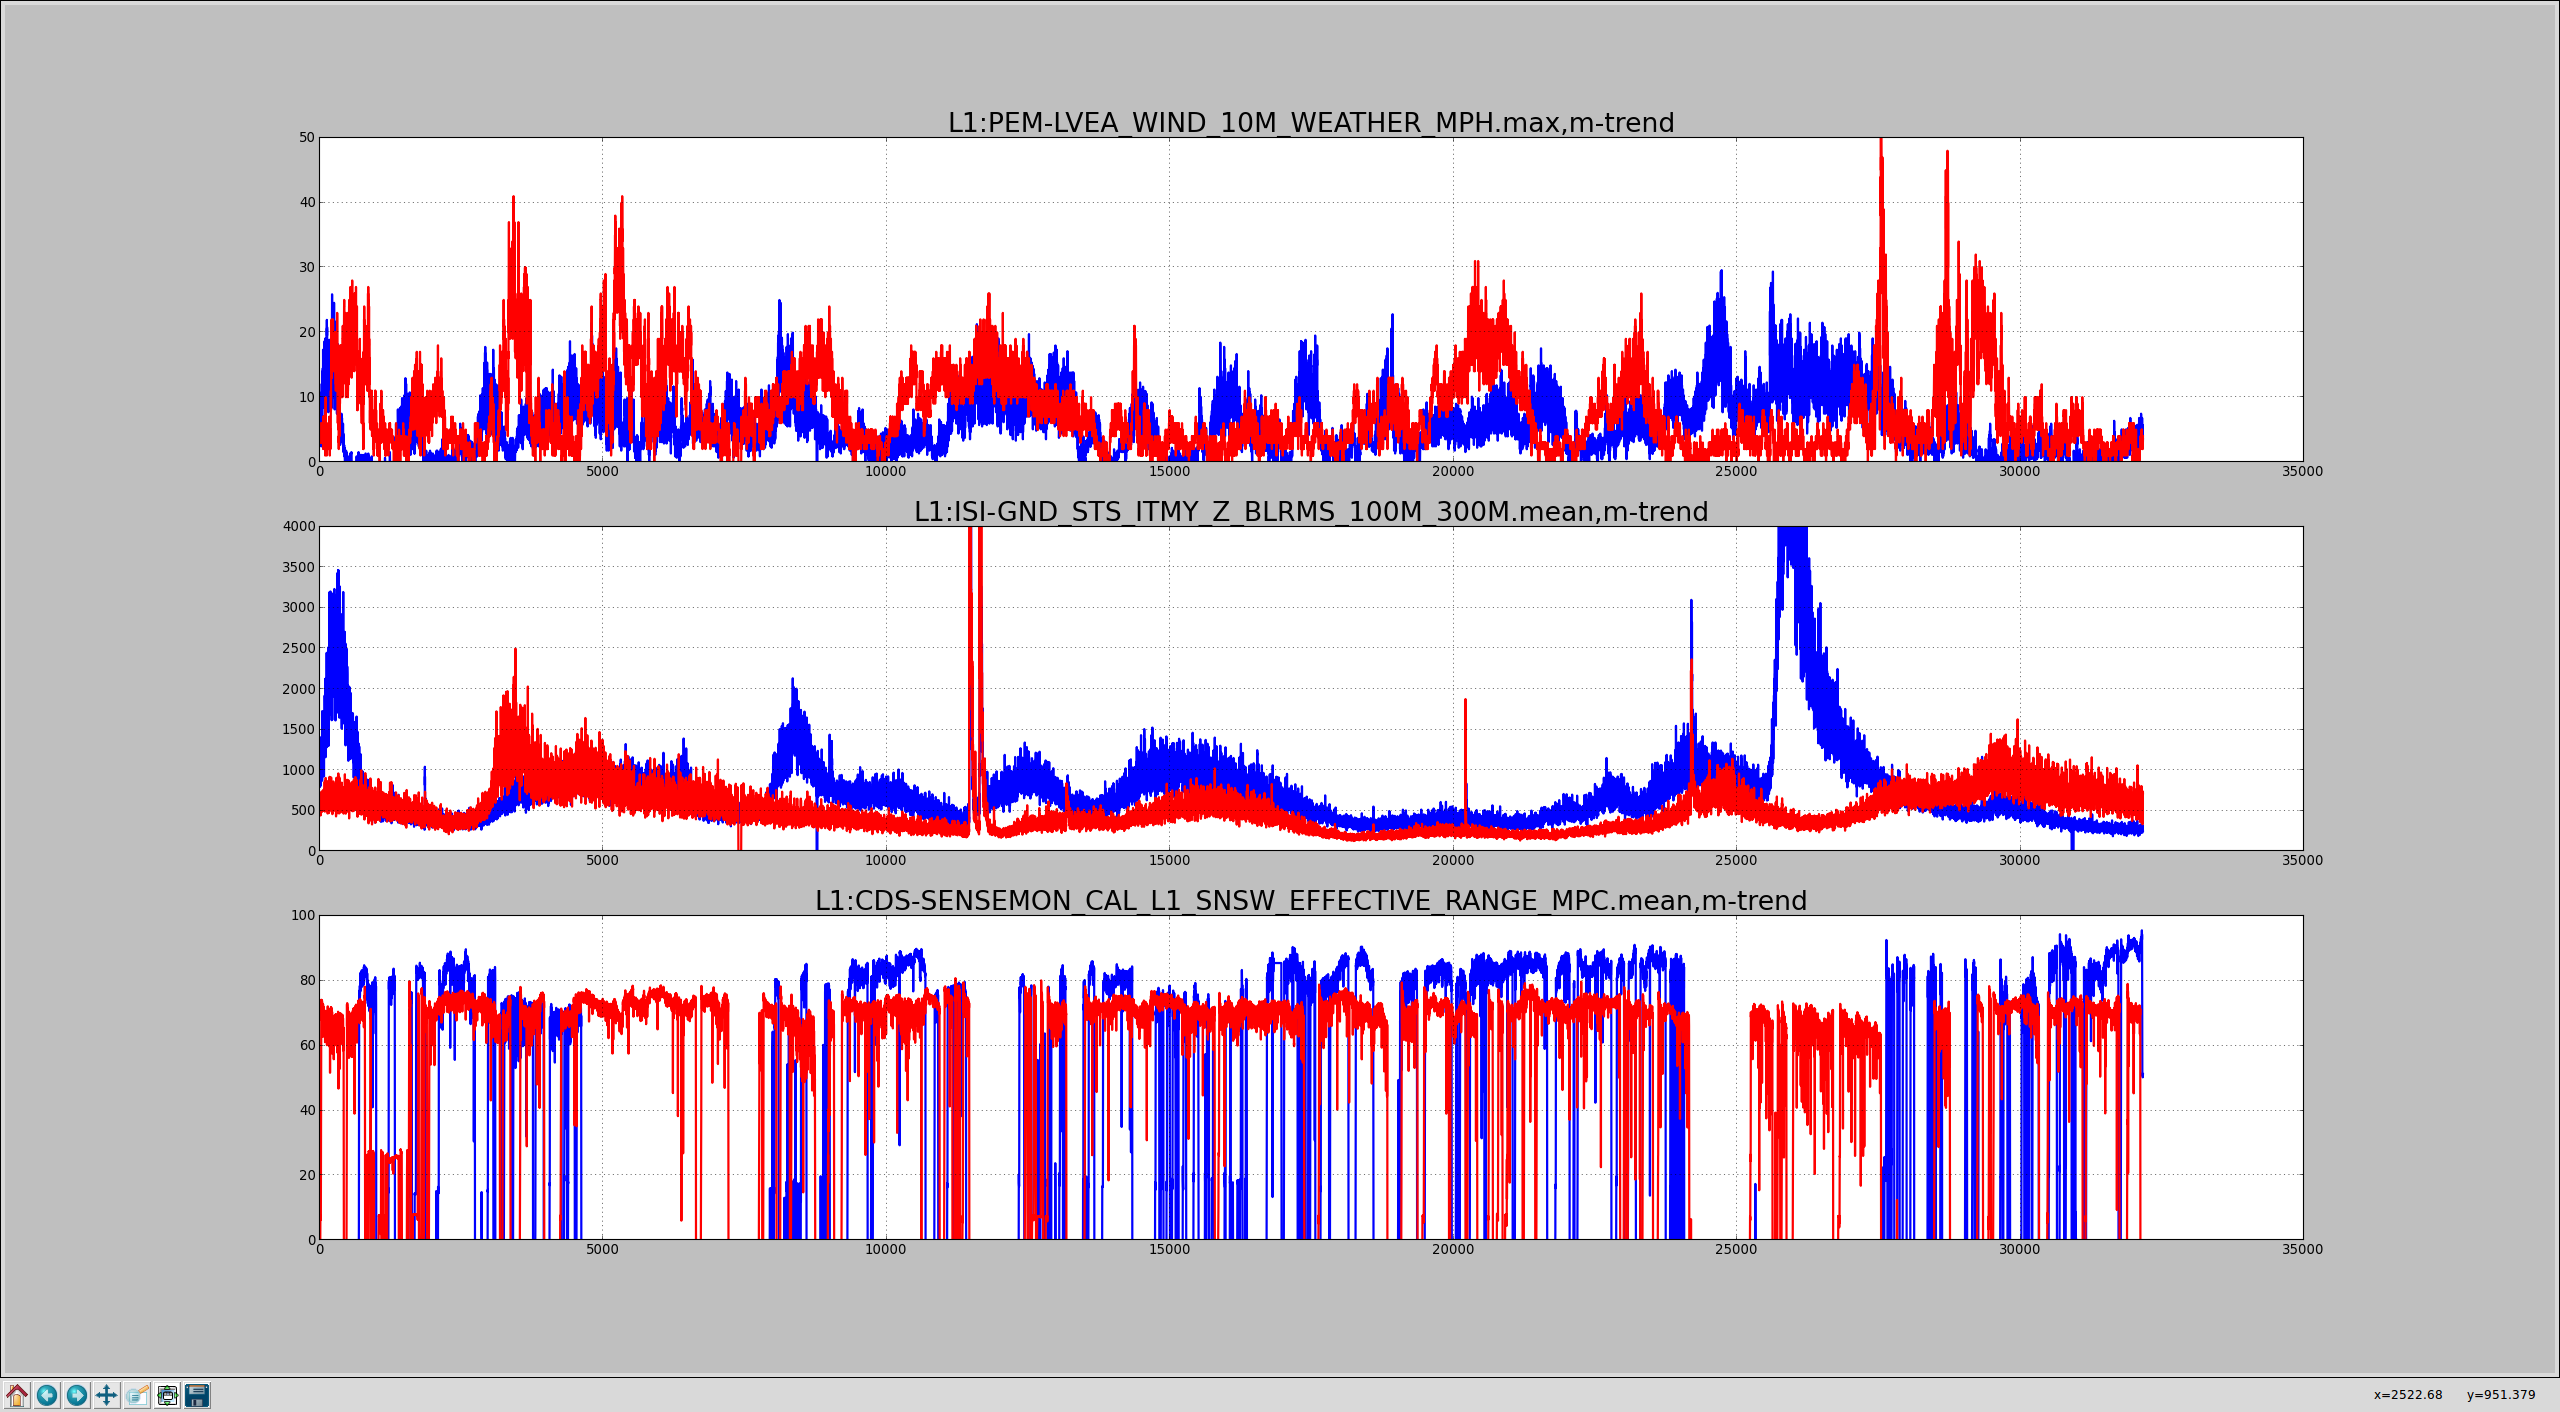
These plot are from a project I'm just starting on, but I thought they were interesting. Both plots show LLO (blue) & LHO (red) max wind speed minute trends (mph), micrseism (nm/s) band means and range (MPC) means, from top to bottom. First plot is 30 days during Nov/Dec during O1, second plot is for all of the Dec 2016 O2 data. X-axis is in supposed to be minutes, but I suspect something is screwed up there. First plot was made in matlab, second was done with python because the local nds python client will do gap handling, which is not available in GWdata. Stare at them long enough, you might be able to make some guesses about what kind of environment each IFO can tolerate. The other non-image files are the code I used to do the plots with.