edmond.merilh@LIGO.ORG - posted 13:28, Monday 23 January 2017 - last comment - 13:33, Monday 23 January 2017(33540)
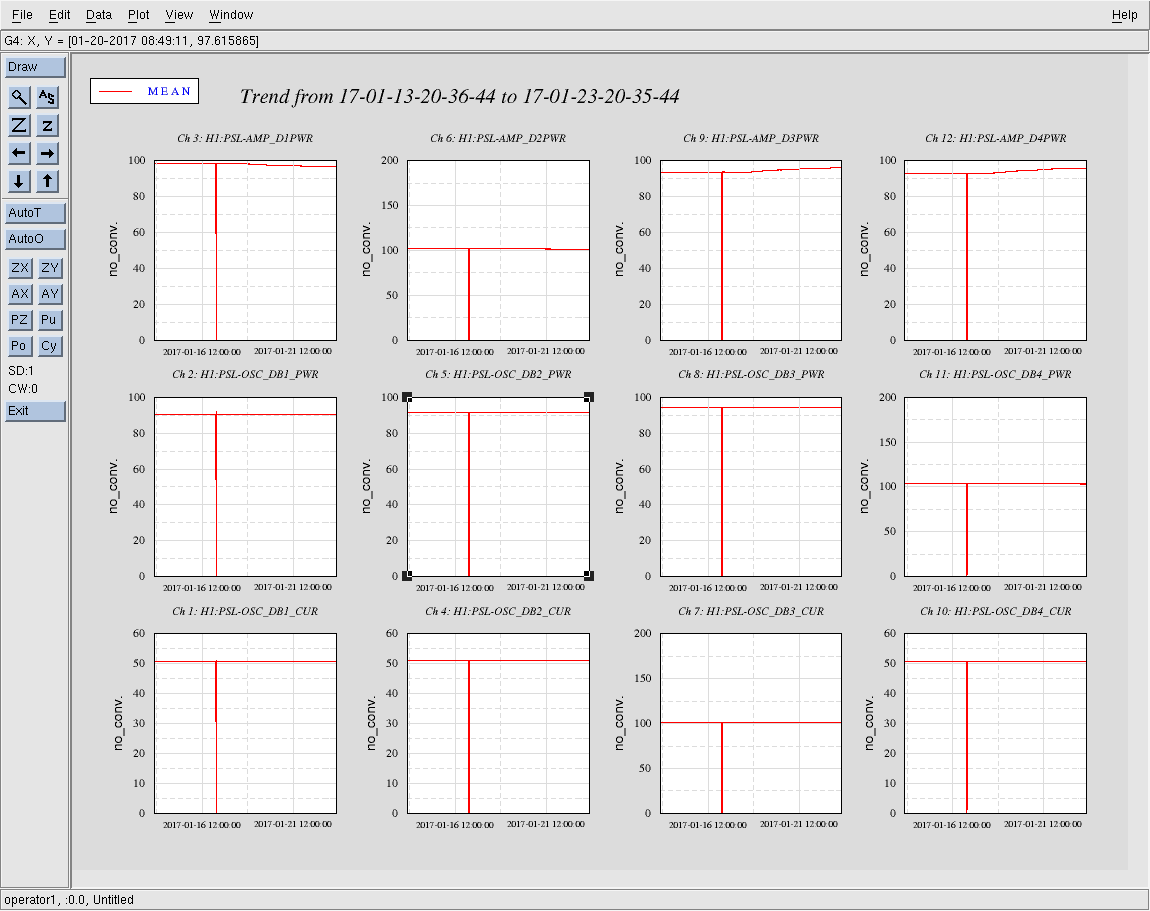
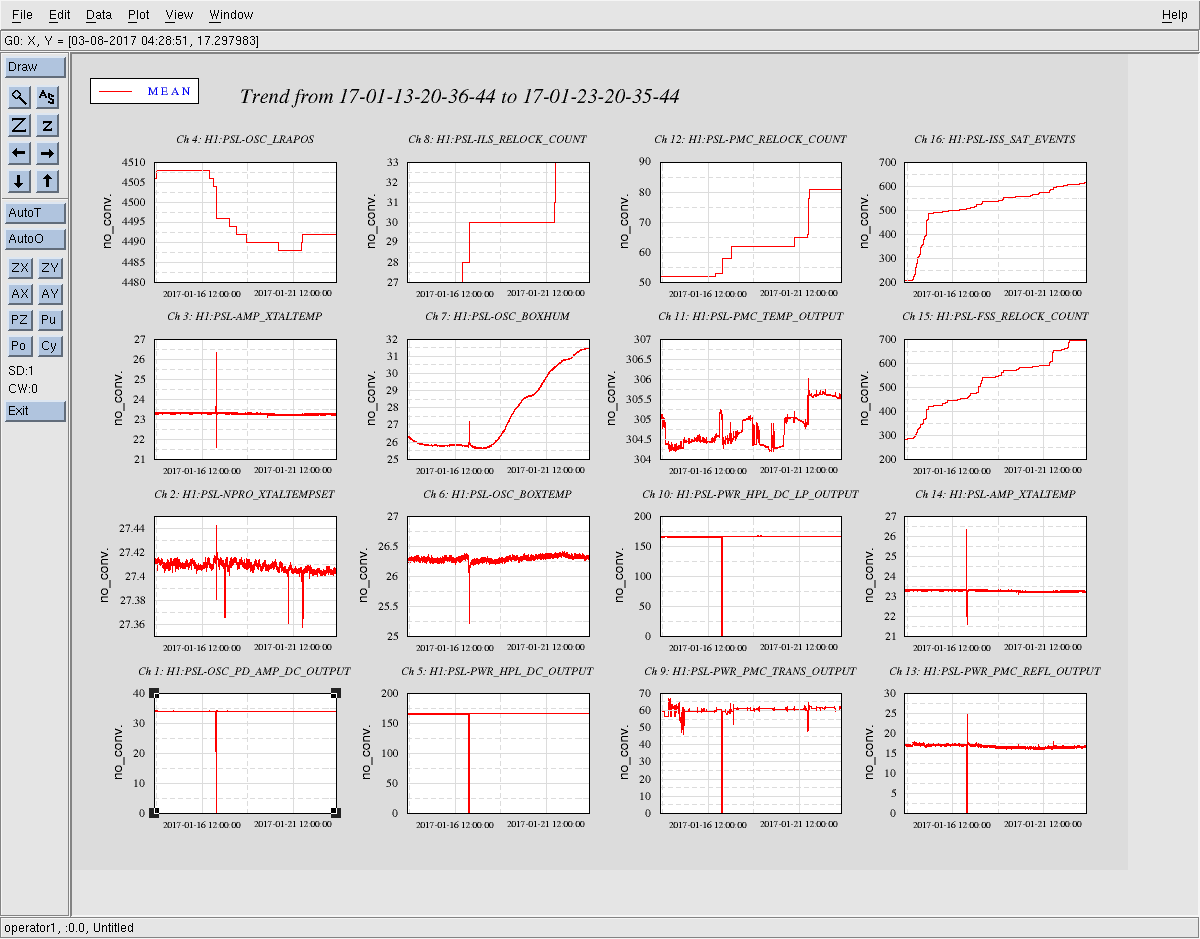
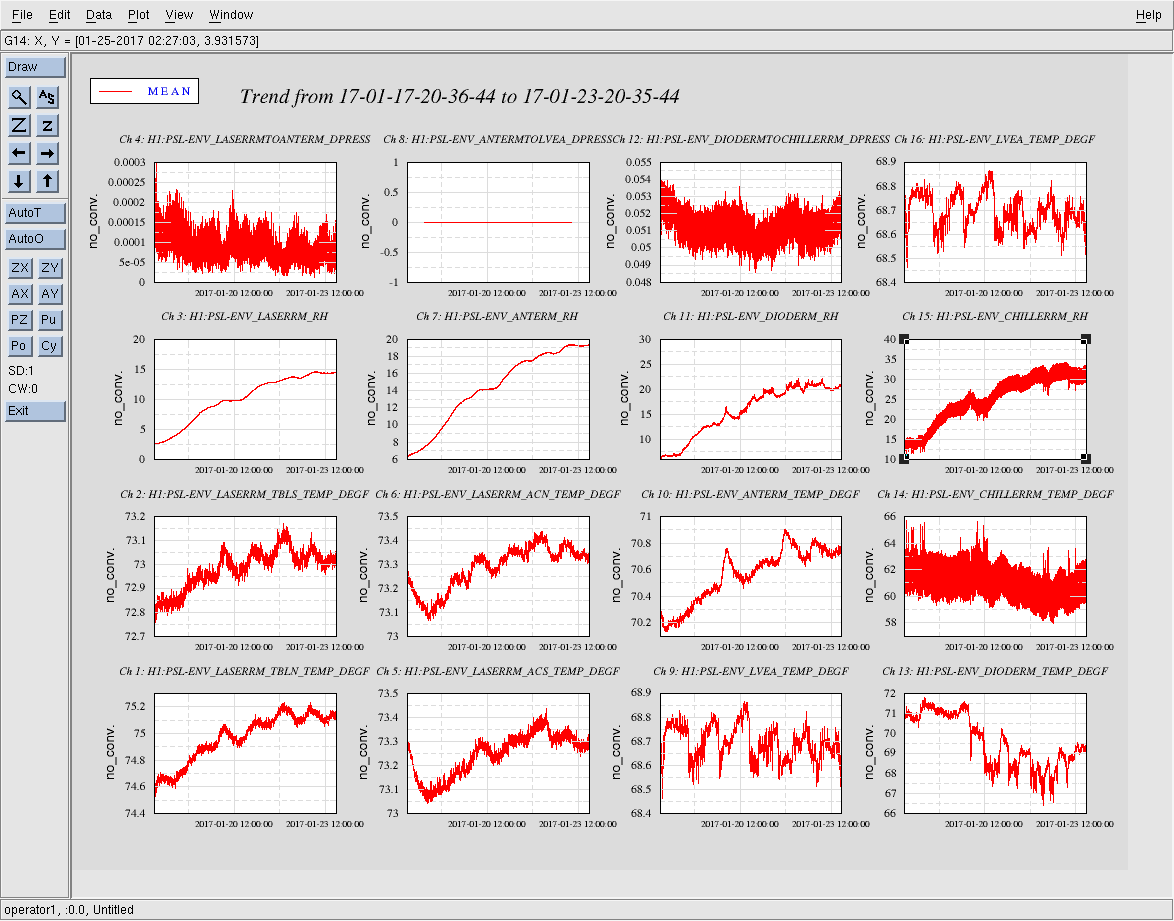
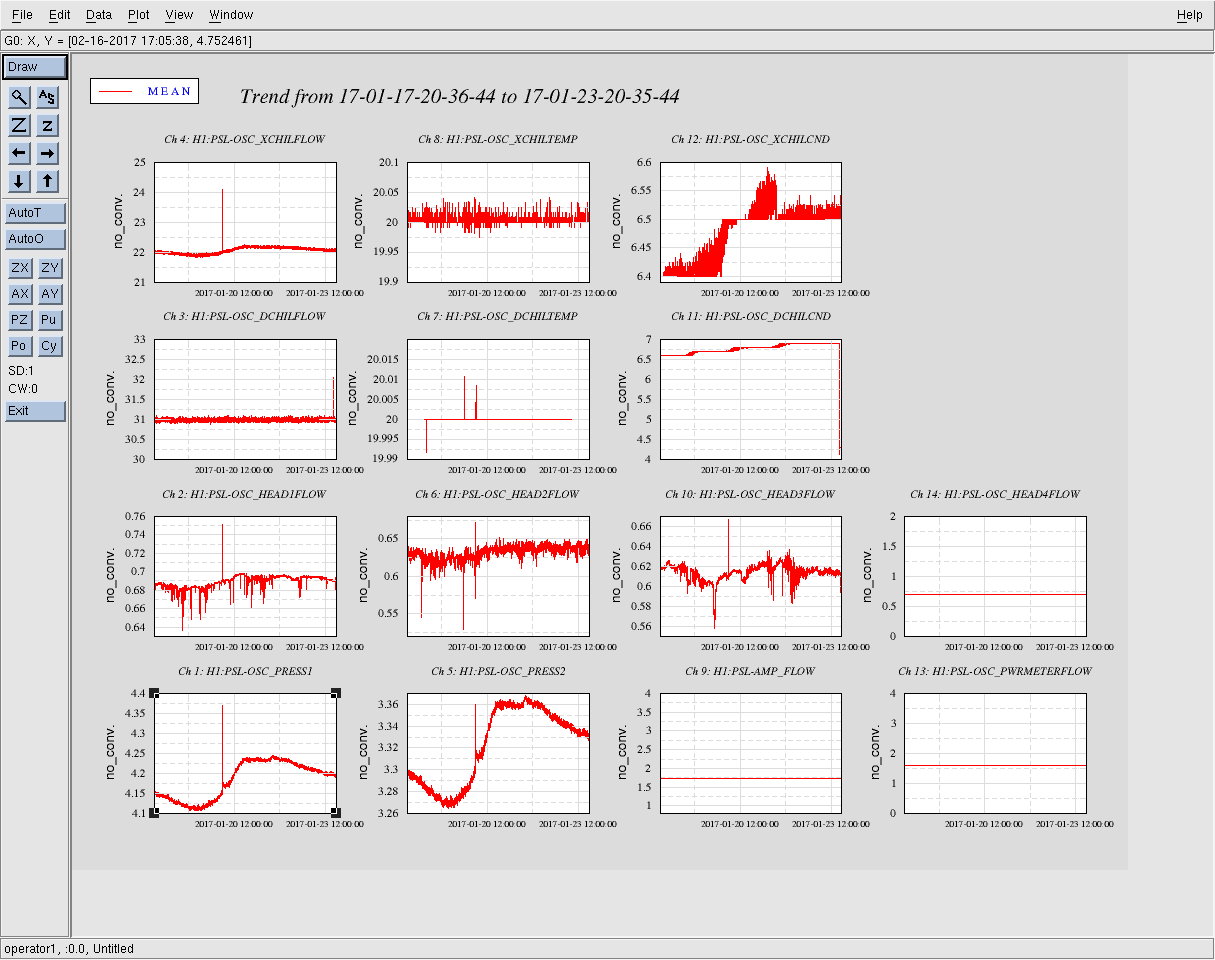
PSL Weekly 10 Day Trends - FAMIS #6132
All plots look to be in normal, nominal, ranges. There are obvious humidity increases that are consistent with the temperature changes/increases that have been happening in the LVEA. Also on the 1/20 Robert Schofield was measuring water flow noise and made a 9% increase in the flows which is apparent in the chiller pressure plots.
Images attached to this report
Comments related to this report
Agree with Ed's analysis, everything looks normal.