aaron.viets@LIGO.ORG - posted 13:43, Tuesday 31 January 2017 - last comment - 12:01, Wednesday 01 March 2017(33771)
DCS filters for LHO data starting at 1169326080
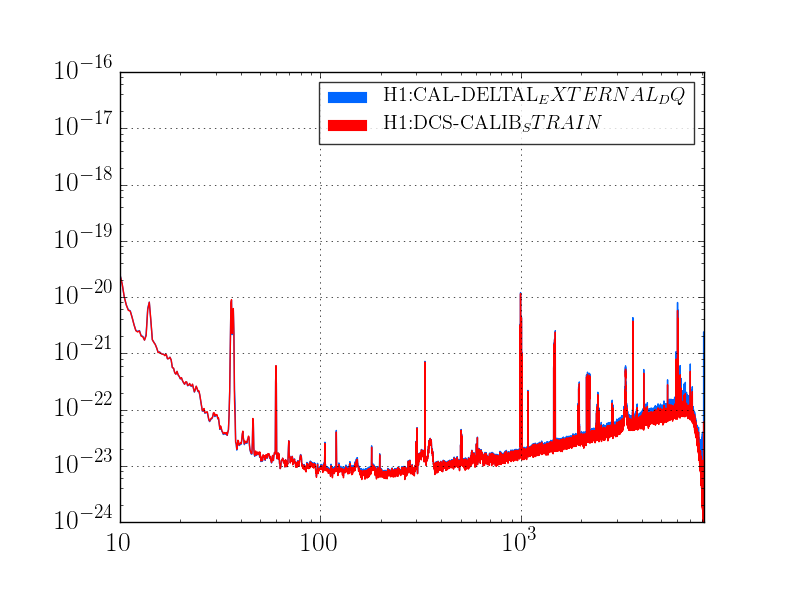
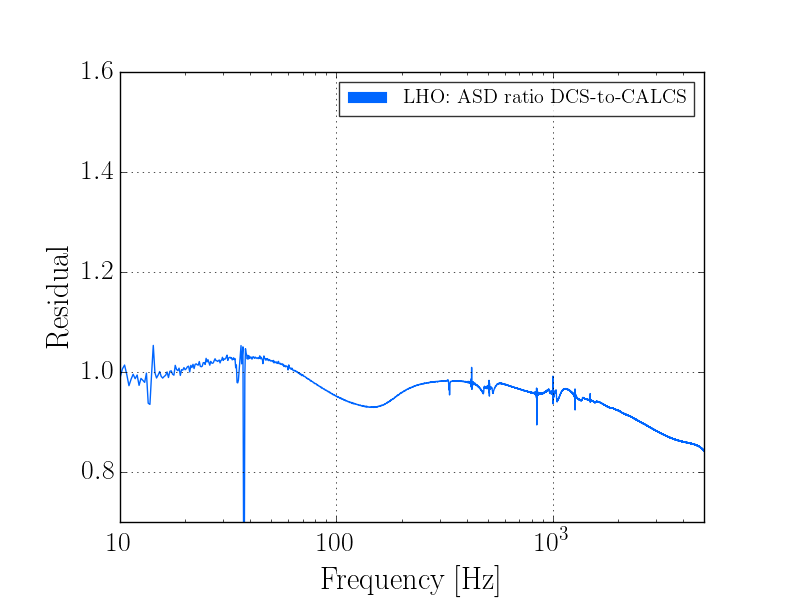
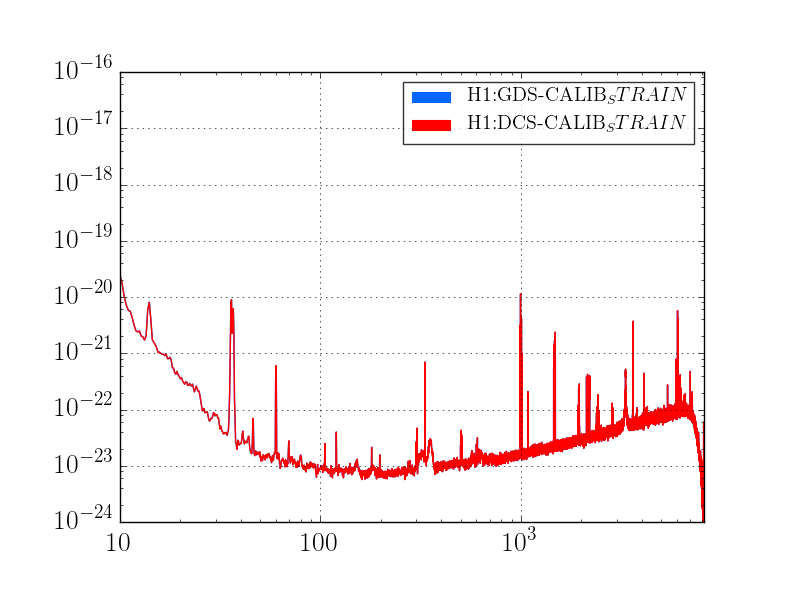
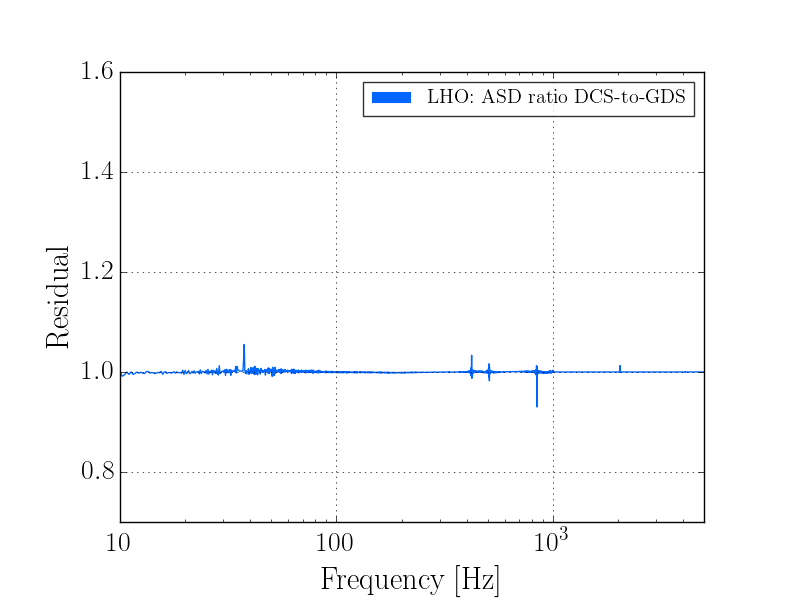
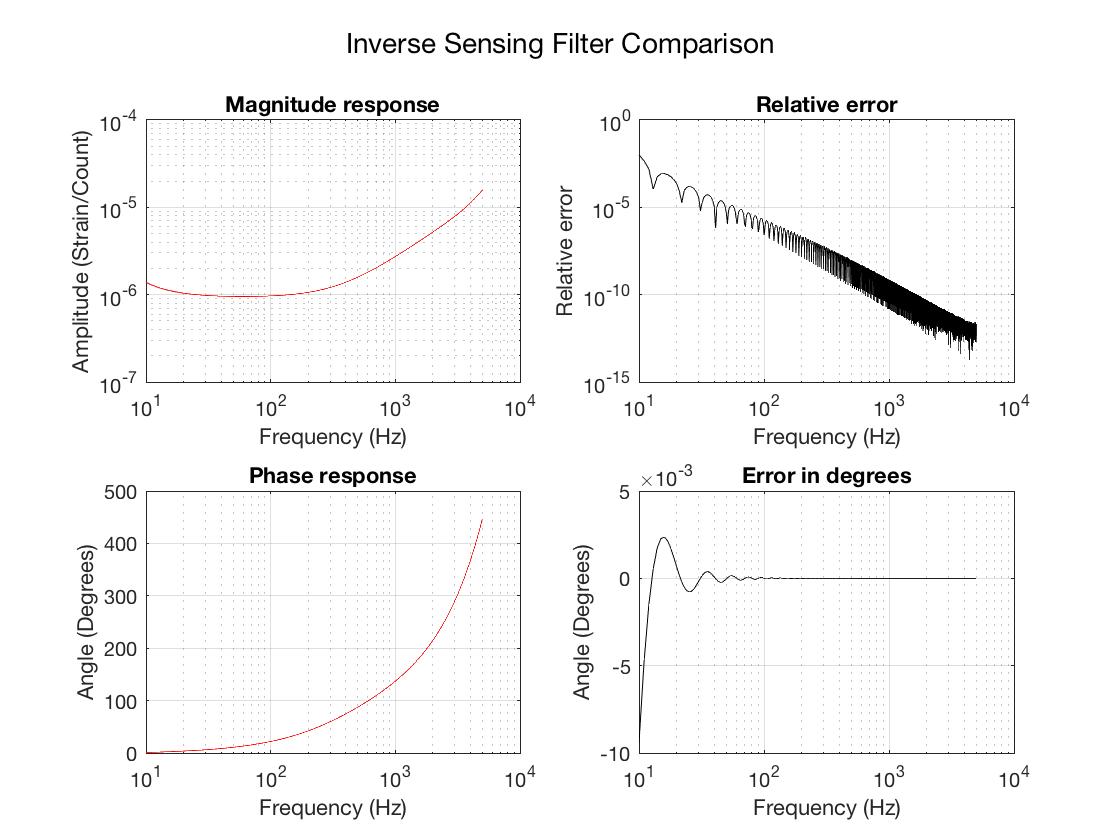
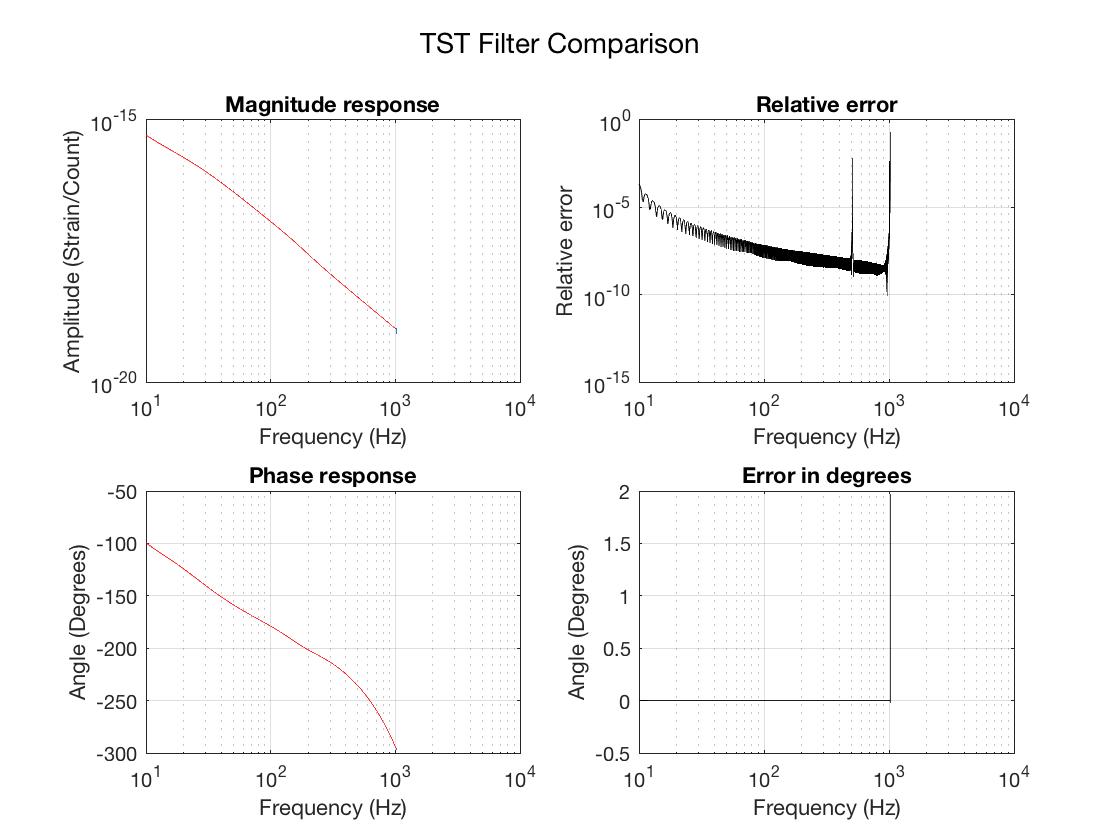
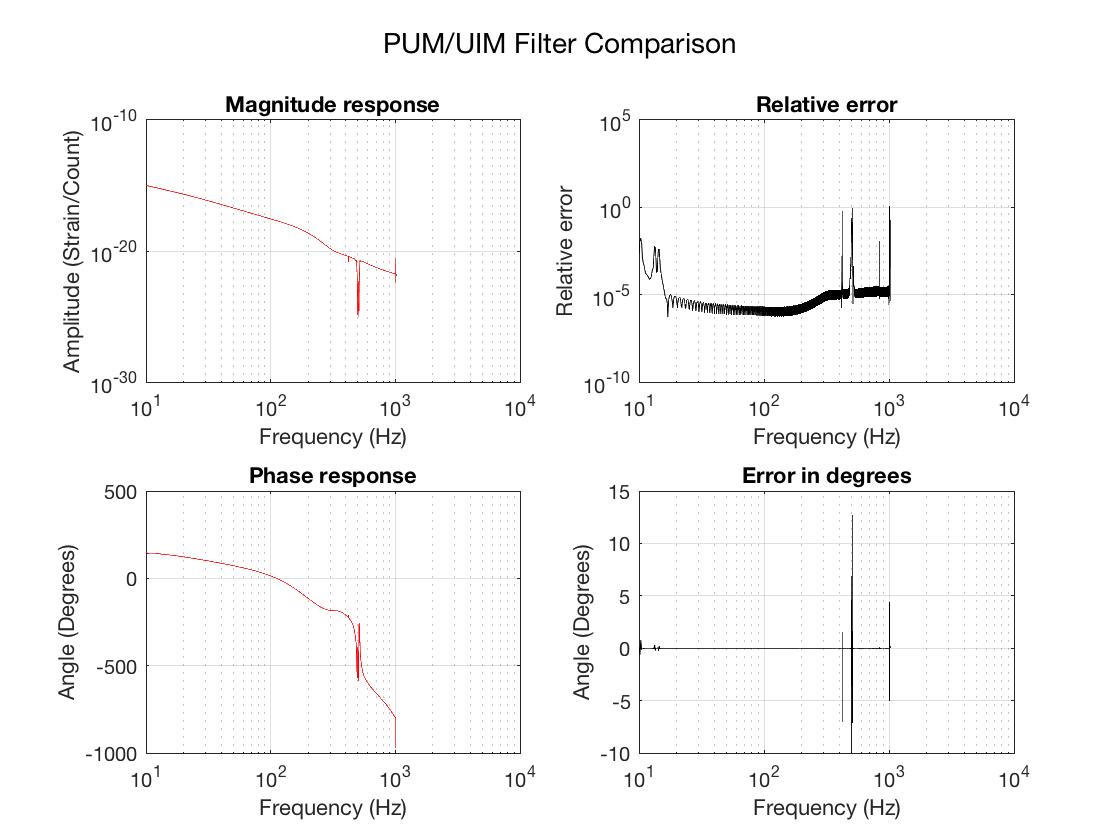
I have produced filters for offline calibration of Hanford data starting at GPS time 1169326080. The filters can be found in the calibration SVN at this location:
ligo/svncommon/CalSVN/aligocalibration/trunk/Runs/O2/GDSFilters/H1DCS_1169326080.npz

For information on the associated change in calibration, see:
https://alog.ligo-wa.caltech.edu/aLOG/index.php?callRep=33585

For suggested command line options to use when calibrating this data, see:
https://wiki.ligo.org/Calibration/GDSCalibrationConfigurationsO2

The filters were produced using this Matlab script in SVN revision 4251:
ligo/svncommon/CalSVN/aligocalibration/trunk/Runs/O2/H1/Scripts/TDfilters/H1_run_td_filters_1169326080.m

The parameters files used (all in revision 4251) were:
ligo/svncommon/CalSVN/aligocalibration/trunk/Runs/O2/H1/params/2017-01-24/modelparams_H1_2017-01-24.conf
ligo/svncommon/CalSVN/aligocalibration/trunk/Runs/O2/H1/params/2017-01-24/H1_TDparams_1169326080.conf
ligo/svncommon/CalSVN/aligocalibration/trunk/Runs/O2/H1/Scripts/CAL_EPICS/D20170124_H1_CAL_EPICS_VALUES.m

Several plots are attached. The first four (png files) are spectrum comparisons between CALCS, GDS, and DCS. GDS and DCS agree to the expected level. Kappas were applied in both the GDS plots and the DCS plots with a coherence uncertainty threshold of 0.4%.
Time domain vs. frequency domain comparison plots of the filters are also attached. Lastly, brief time series of the kappas and coherences are attached, for comparison with CALCS.
Images attached to this report
Non-image files attached to this report

Comments related to this report
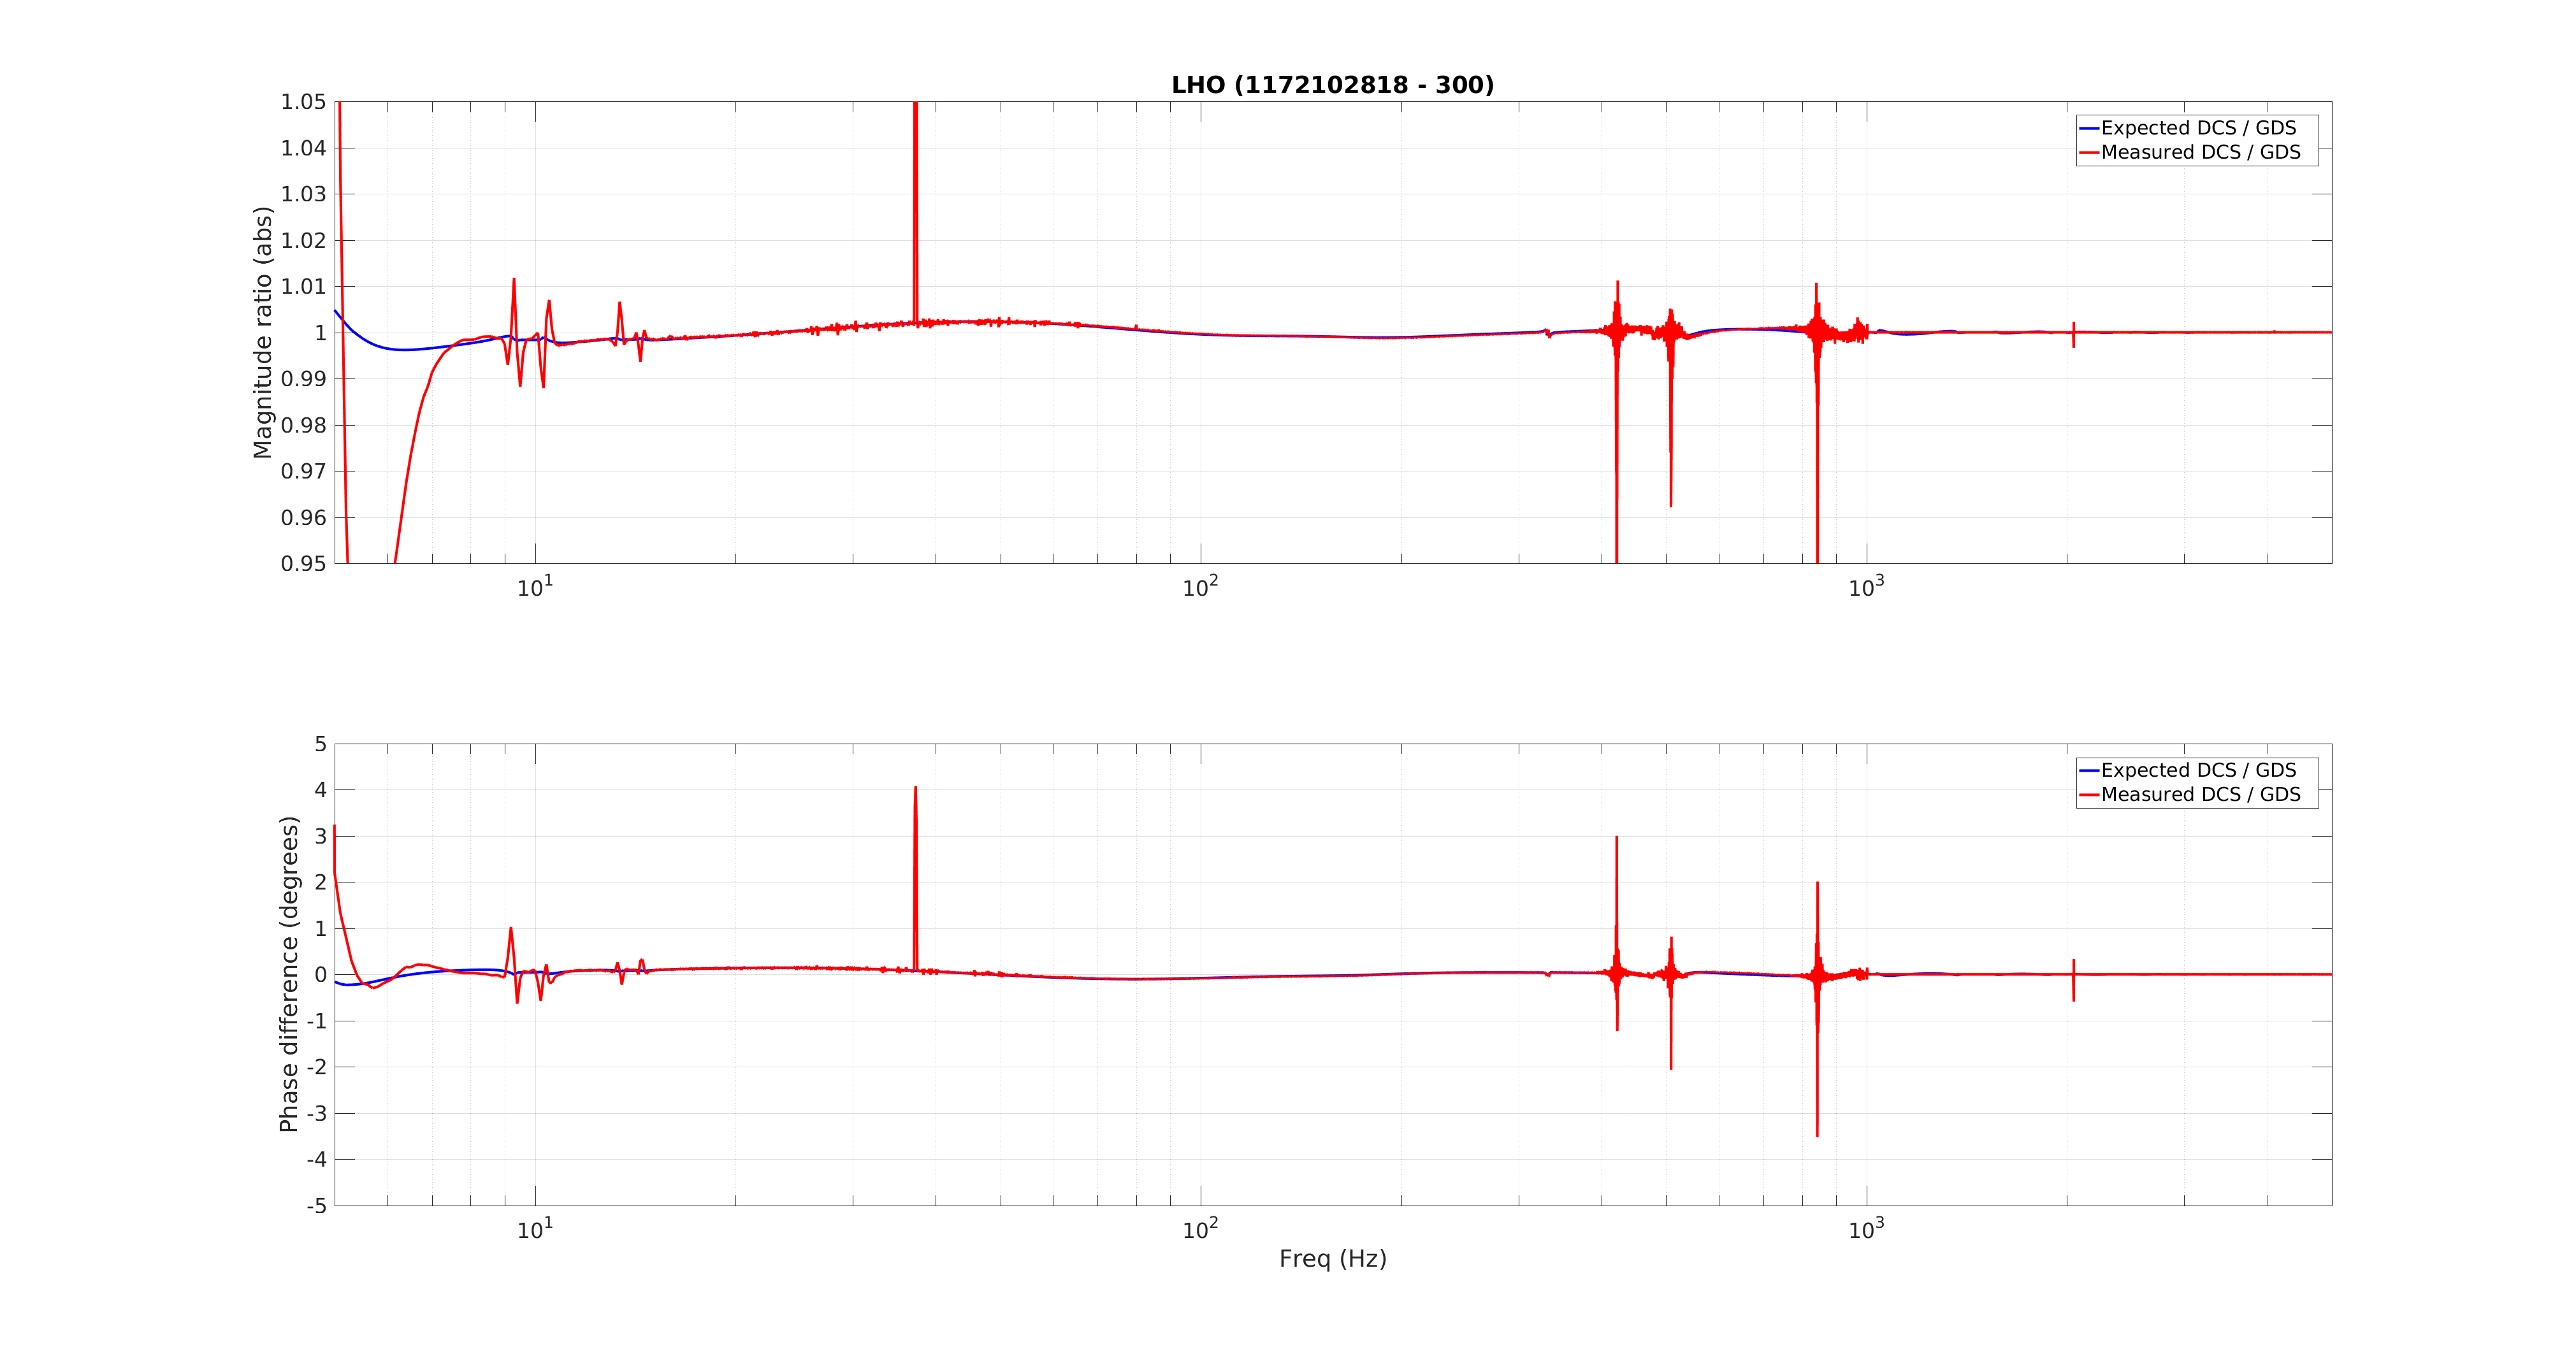
Here is a plot that compares the ratios of GDS and DCS (CO1) data (expected vs measured). Above ~8 Hz, the expected and measured ratios agree. Below ~8 Hz the we see difference. This comparison doesn't account for the FIR implementation of ~9 Hz high pass filter used in GDS and DCS data. If there is difference between how this implemented it could produce the difference we see here (need to be checked).  The code used to make this plot is added to svn,
/ligo/svncommon/CalSVN/aligocalibration/trunk/Runs/O2/H1/Scripts/CALCS_FE/CALCSvsDARMModel_20170124.m
This is just an updated version of the code Jeff used to make the CALCS and GDS comparison.
Images attached to this comment