cheryl.vorvick@LIGO.ORG - posted 03:27, Wednesday 01 February 2017 - last comment - 03:30, Wednesday 01 February 2017(33792)
IMs, a health check
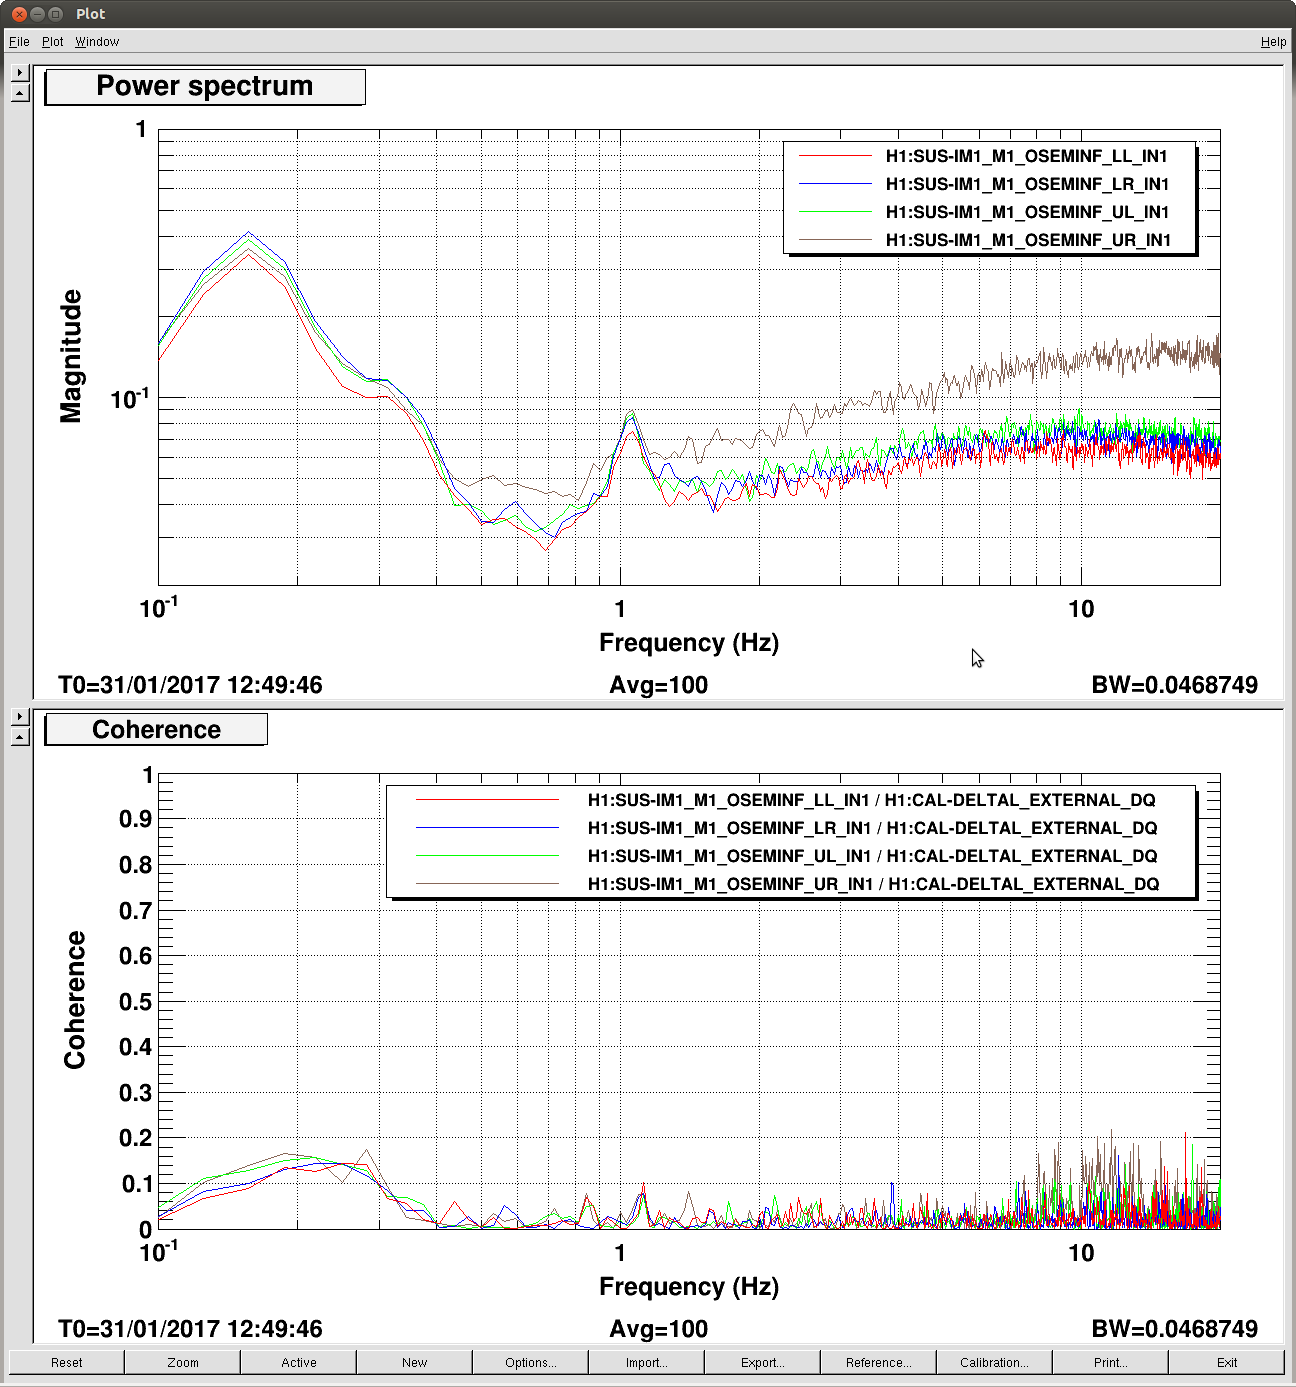
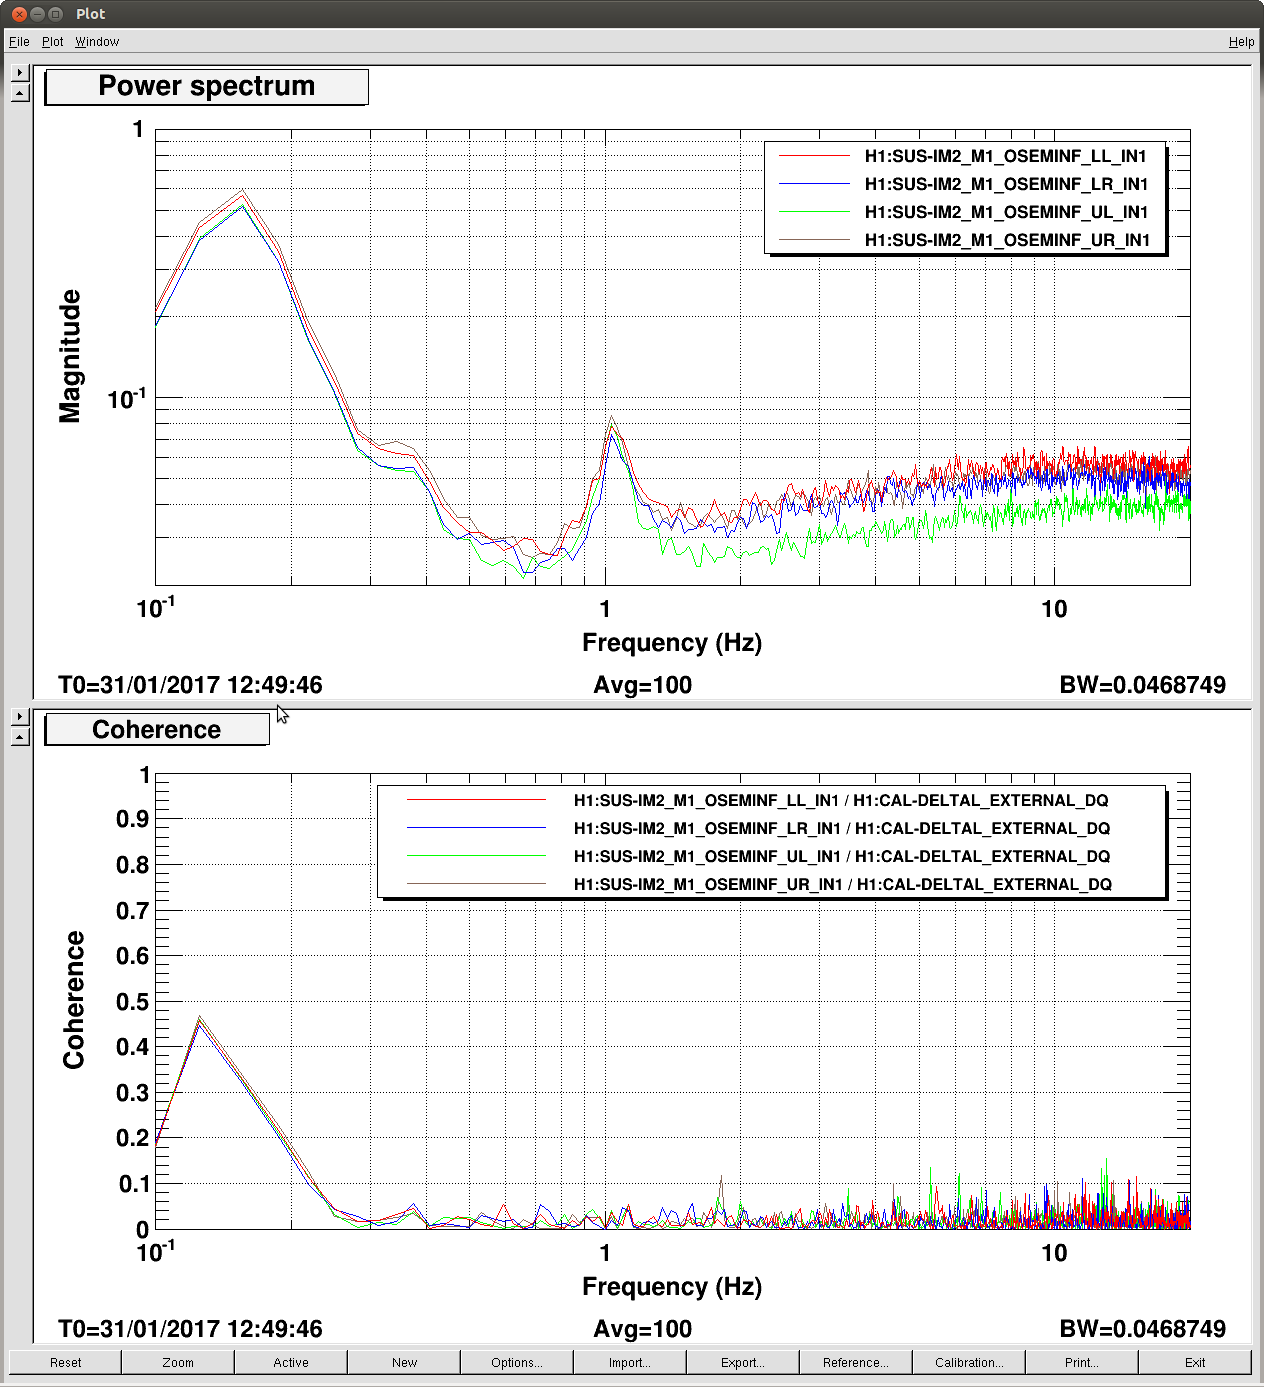
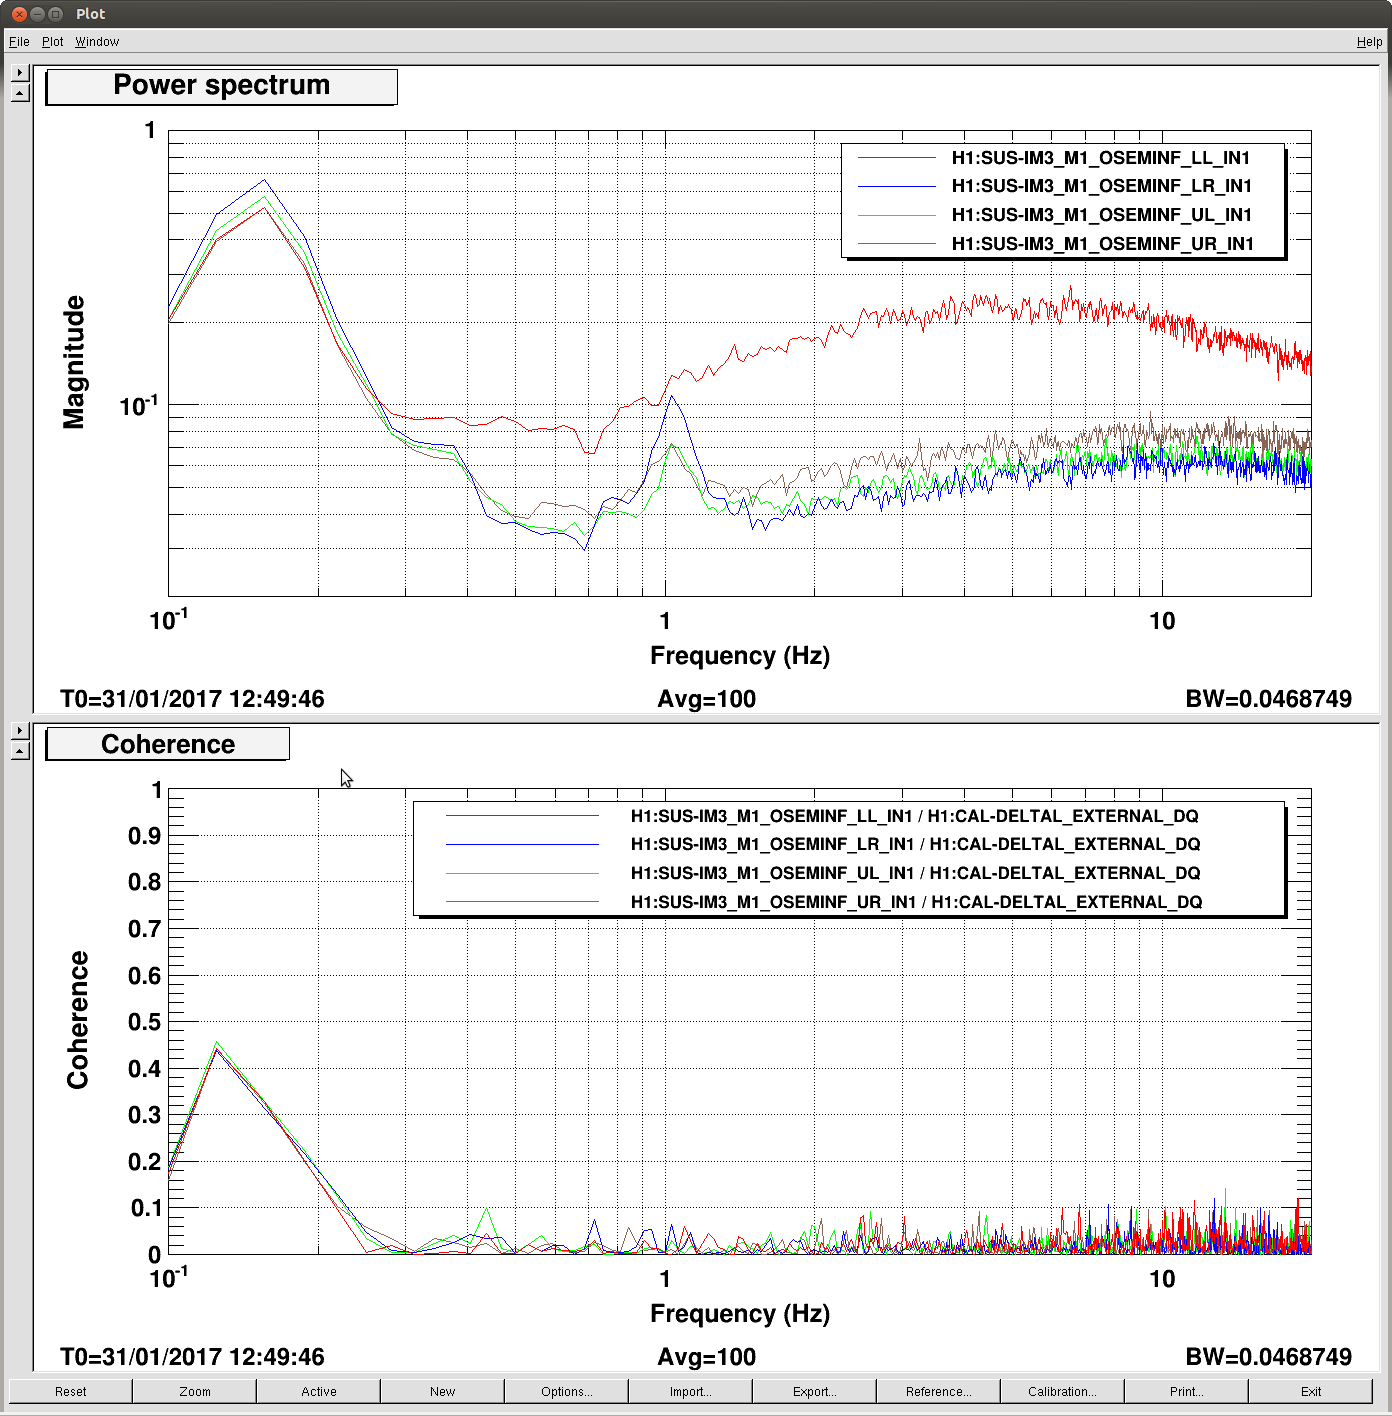
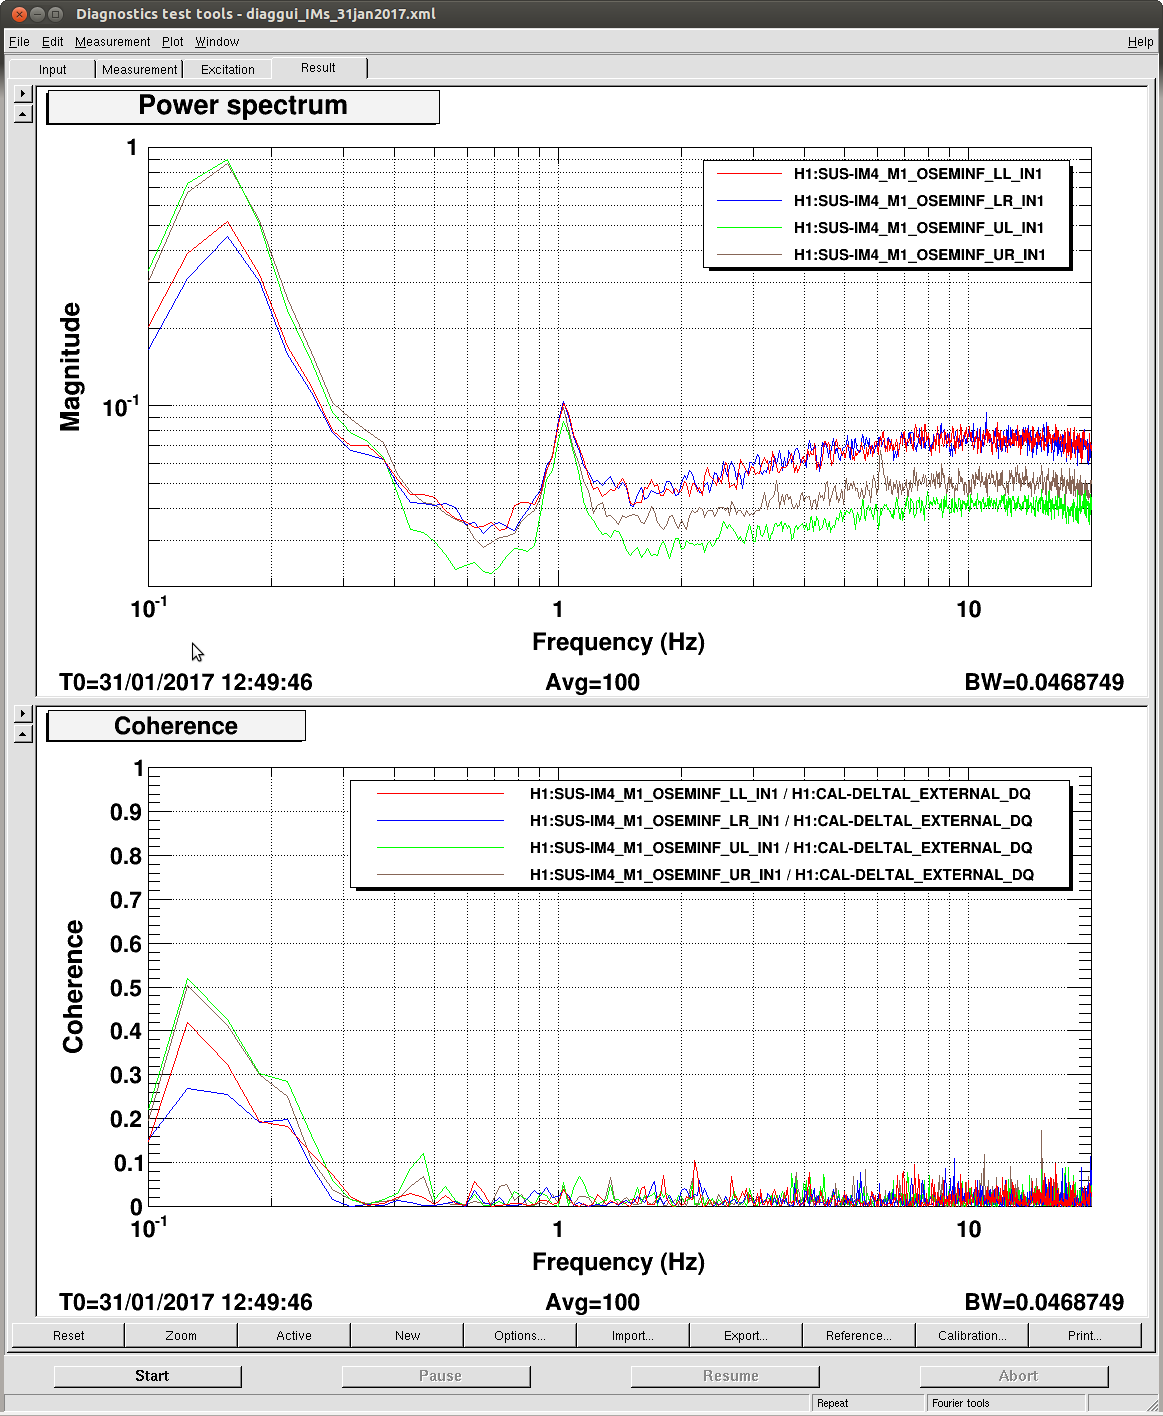
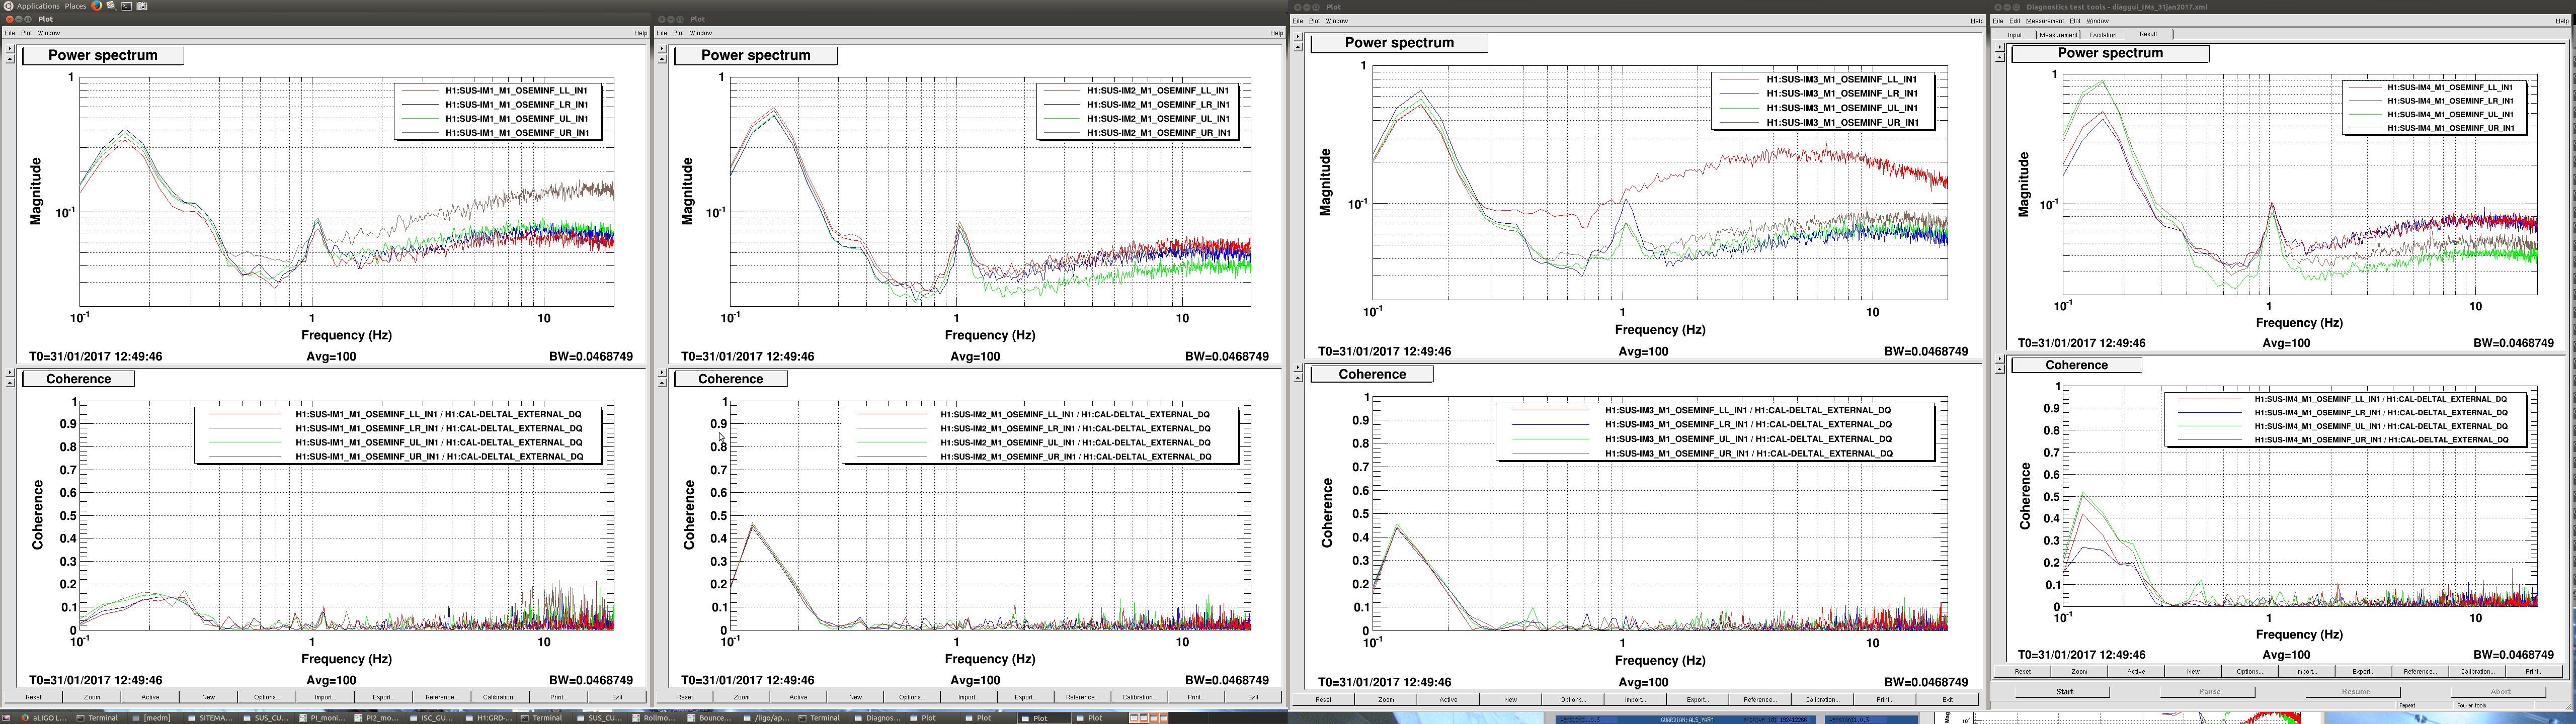
Here are plots of IM1, IM2, IM3, and IM4 OSEM input signals, test points, and coherence with DARM.
Power Spectrums:
- IM4, right side plot, only IM driven by ASC, and shows a difference in peaks between 0.1Hz and 0.2Hz, with upper OSEMs showing more motion that lower OSEMs, meaning of this is not immediately clear to me, but different that all other IMs
- IM3, right of center, OSEM LL noisy, and peaks at 1+Hz in OSEMs UL and UR are smaller than expected mangitude, OSEM LR magnitude at that frequency is expected
- IM2, left of center, all OSEM spectra look very similare
- IM1, left side plot, OSEM UR noisy
Coherence with DARM: all low, but some features
- IM4, right side plot, peak between 0.4Hz and 0.5Hz
- IM3, right of center, uneventful
- IM2, left of center, OSEM UR, brown trace, has a possibly interesting peak at 1.8Hz
- IM1, left side plot, peak between 0.1Hz and 0.2Hz very different that for all other IMs, lower and broader, also OSEM UR has coherence peaks up to 0.2 from 8Hz to about 15Hz, which is unique to IM1, so possible interesting
Images attached to this report
Comments related to this report
IM1, IM2, IM3, and IM4
Images attached to this comment