This entry is a follow up of one of the reported issues on my last DQ Shift.
The single lockloss that took place on the 2017-01-28 16:43:45 (UTC) or 1169657043 as reported by the segment database under flag H1:DMT-DC_READOUT_LOCKED:1
The thing that called my attention of this lockloss is that it was preceded by a not very common overflow, of channels H1:ASC-AS_C_SEG#. These channels are the ADC values of the 4 segments of a QPD located on the antisymmetric port for aligment sensing and control of signal recycling mirrors SRM and SR2.
A closer look of the lockloss pointed to several issues:
1) DMT Segment DMT-DC_READOUT_LOCKED:1 flags that inform when the detector is locked seems to be off. DMT segment generation should round the first sample of lock up to the next GPS second, and down for the end of a segment. So while the start second is included as locked, the stop second of the segment should not be included as locked. It would be of the type: [startgps stopgps). Looking at this particular lockloss seems this is not right:
DMT-DC_READOUT_LOCKED:1 --> 1169596818 1169657043
That means that the detector was locked up to GPS 1169657043, that corresponds to UTC 2017-01-28 16:43:45.
The way that flag is defined is: H1:DMT_DC_READOUT_LOCKED_s boolean "H1:DMT_DC_READOUT_s & H1:DMT_XARM_LOCK_s & H1:DMT_YARM_LOCK_s"
Where:
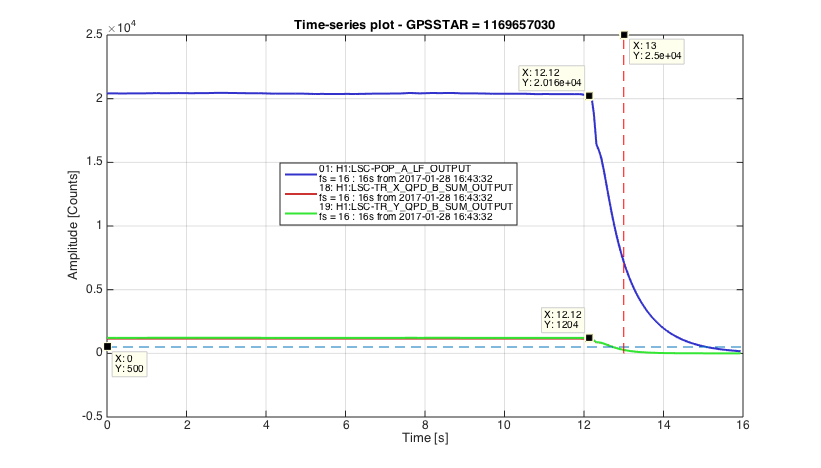
X-ARM Lock: H1:DMT_XARM_LOCK_s meanabove "H1:LSC-TR_X_QPD_B_SUM_OUTPUT" threshold=500
Y-ARM Lock: H1:DMT_YARM_LOCK_s meanabove "H1:LSC-TR_Y_QPD_B_SUM_OUTPUT" threshold=500
So I plot next these 2 channels, together with H1:LSC-POP_A_LF_OUTPUT which is an indication of the power built up on PR cavity so a good indication of having IFO locked. In dashed lines; blue is for the threshold=500 and red for the stop GPS of the lock segment. Clearly the detector was unlock before the stop GPS time of the flag:
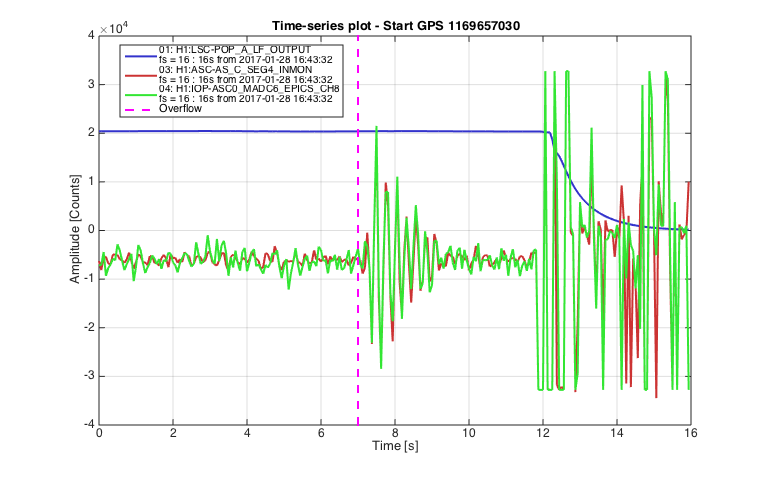
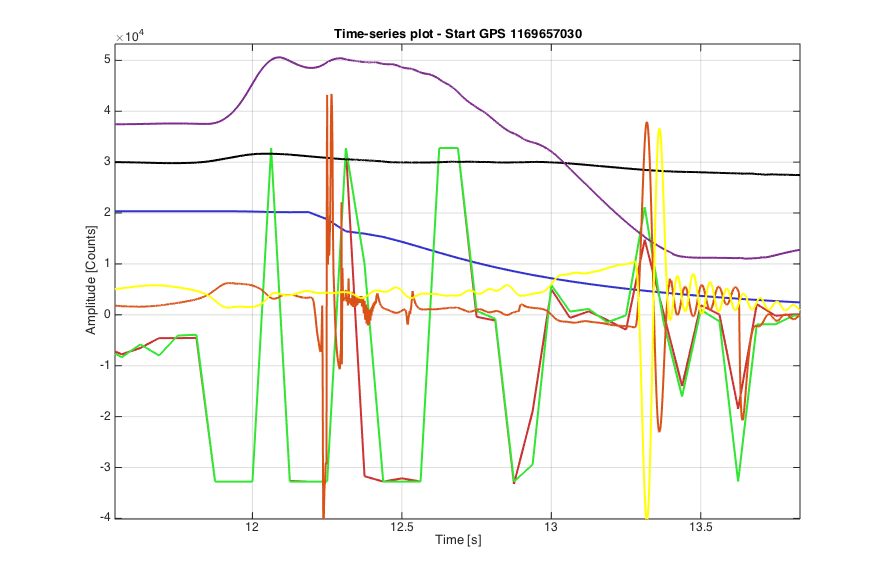
2) Now to the main issue of this post, the overflow of channels H1:ASC-AS_C_SEG# and the lockloss. I plot next the lockloss informaiton as indicated by H1:LSC-POP_A_LF_OUTPUT and I plot as well one of the saturating ADC channels H1:ASC-AS_C_SEG4 (from the H1ASC usermodel) together with the identical IOP model channels H1:IOP-ASC0_MADC6_EPICS_CH8, the first thing we notice is that they are not identical as they should. However notice that the usermodel channel is running at 2kHz while the IOP is running at 65kHz so while both channels are the same in principle to obtain H1:ASC-AS_C_SEG4 first we need to apply the downsampling filter to H1:IOP-ASC0_MADC6_EPICS_CH8 and then downsample it. In addition these plots are EPICS channels at 16Hz. Still there are considerable discrepancies. The vertical dashed magenta line represents the integer GPS time of the start of the overflow as given by the H1ASC usermodel Accumulative overflows: H1:FEC-19_ADC_OVERFLOW_ACC_4_8 (GPS 1169657037). Because the ADCs are 16 bits the overflow should happen at 2^15 = 32768. There are not such value in that second but notice that they are 16 bit downsampled channels so it must have been a very short duration overflow, they are more clear overflows of longer duration just before the lockloss but they were not reported on the Summary Pages maybe because it ignores 1 second before lockloss?:
Now to the interesting part.
It would be nice to look at the saturation channels at higher sampling rate but they are not stored in the frames. However what we have in the frames (at 2kHz which is the freq of the corresponding user model) is a combination of the 4 segment channels as the normalised sum (H1:ASC-AS_C_NSUM_OUT_DQ), this channel is then used to normalize also the combination used to generate Pitch and Yaw signals (for Yaw is H1:ASC-AS_C_YAW_OUT_DQ). I have scaled these 2 channels and overlap them with the previous plot as purple and black respectively:
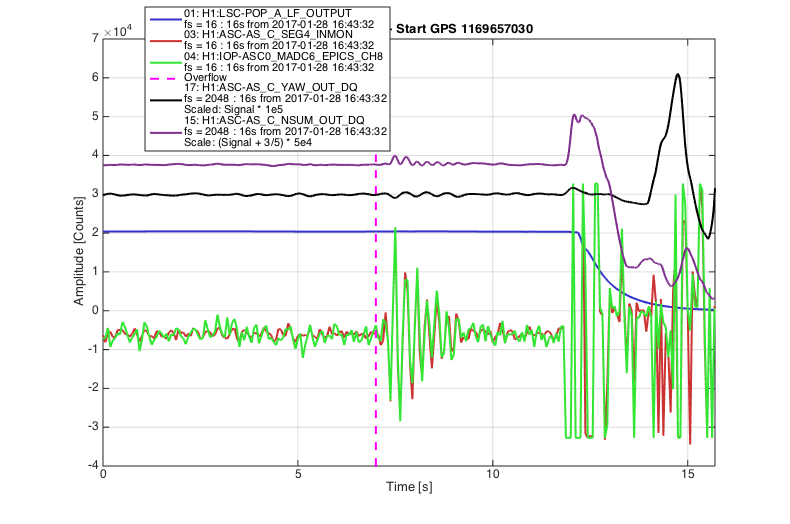
Notice how these NSUM and YAW channels oscillate after the overflows, as if it was a step response. In fact looking at the real time signals (with the help of David Barker) of the IOP channel H1:IOP-ASC0_MADC6_EPICS_CH8 and the equivalent usermodel channel H1:ASC-AS_C_SEG4, we observed that while the IOP saturated at 2^15 as expected, however the usermodel channel went above 50000 counts, the observation of these saturations are only possible when detector is unlocked as they happen often, it is not the case when the detector is locked. We then realised that this was due to the downsampling filters that are applied to the IOP channel (at 65kHz) to downsample it to the 2kHz frequency at which the usermodel runs, and sharp saturations of the IOP caused big step responses on H1:ASC-AS_C_SEG4. These step responses (as we can see above) perturbe the alignment signals that are later fed back to the control signals of the last stage of SR2 and SRM mirrors.
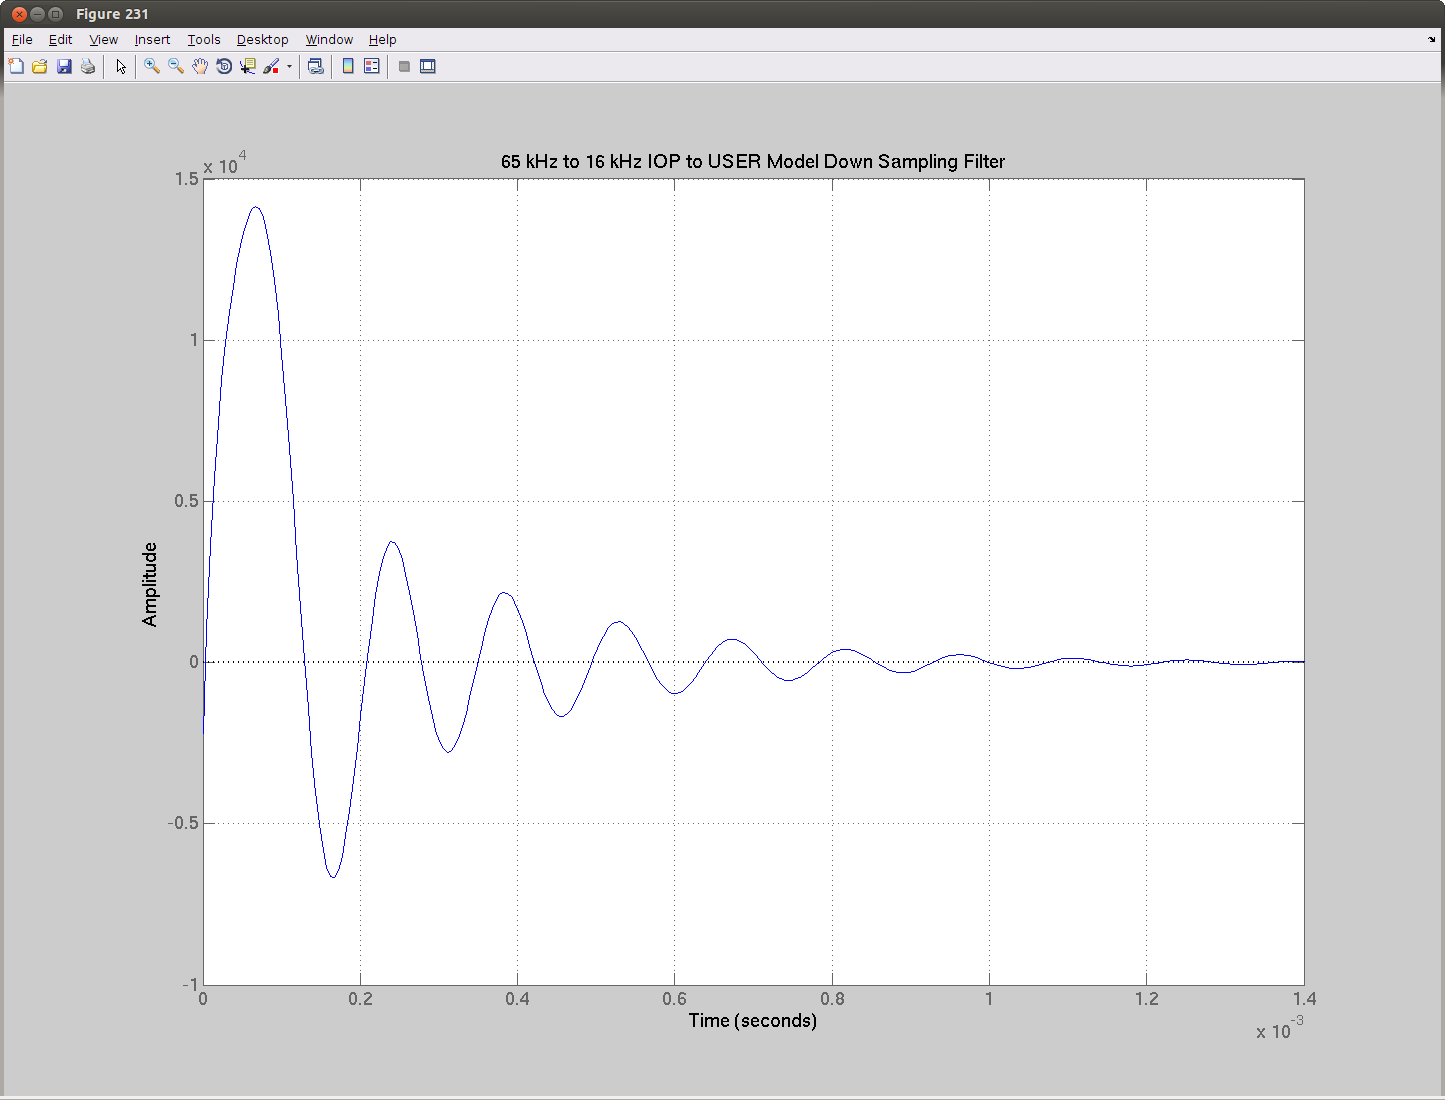
Jeff Kissel helped me to find the filter applied in the process and simulate the step response expected due to the downsampling filter used to go from 65kHz to 2kHz, and then apply the additional filter used to generate NSUM channel with a low pass filter at 1Hz (no additional filter is applied for the Pitch and Yaw channels but notice these are normalized by NSUM):
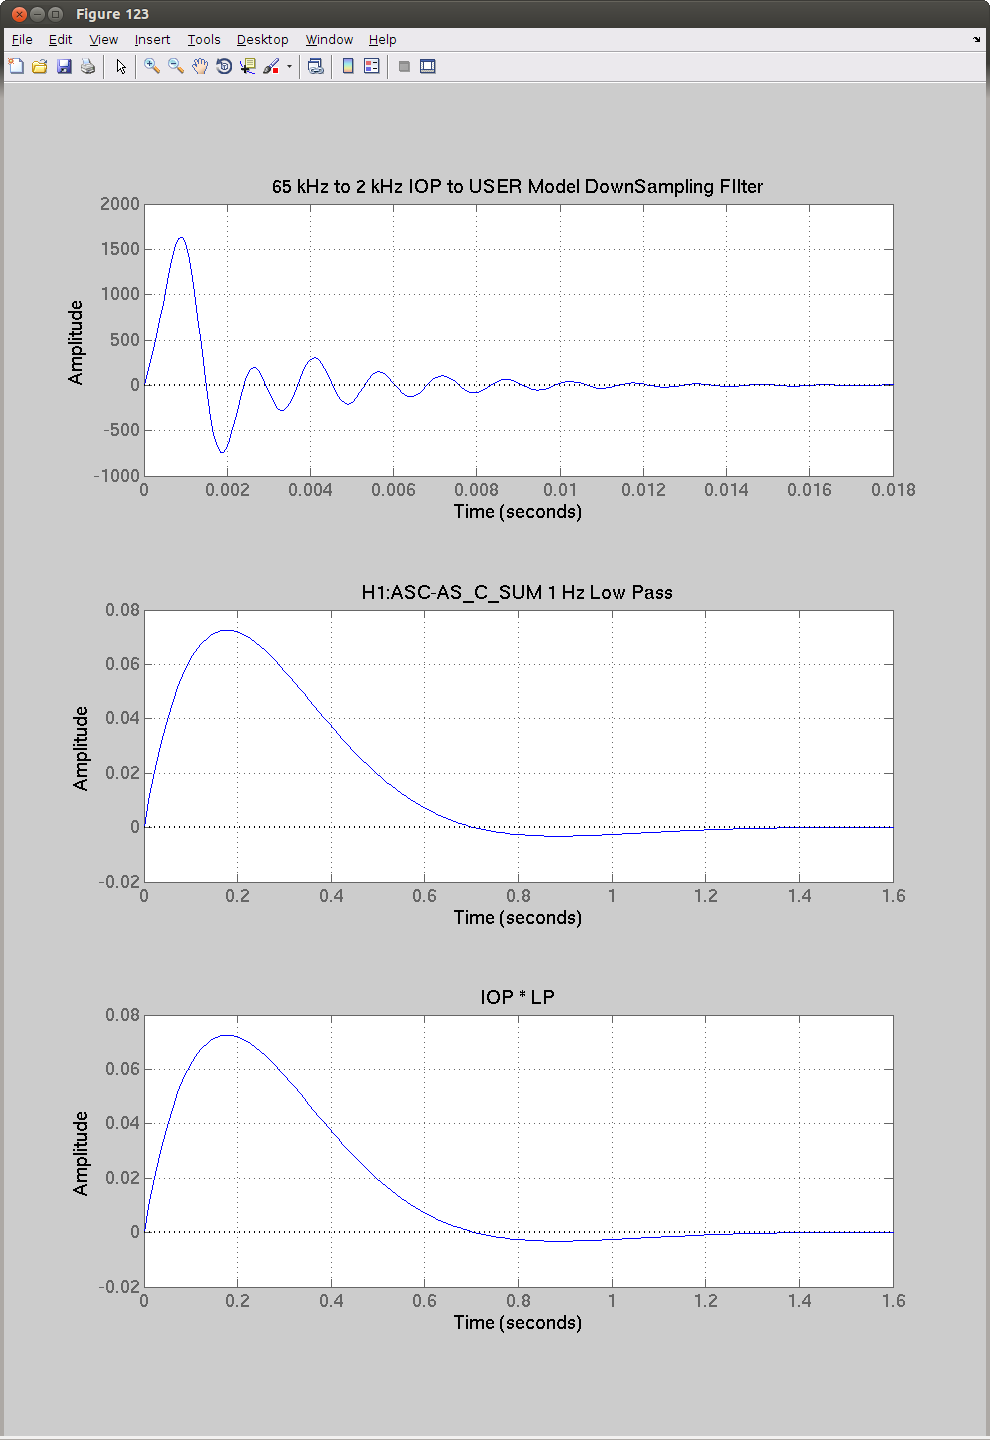
The step response time constant of less than 1 second for the product of both filters is not far from the period oscillations observed on the NSUM and YAW channels after saturation (periodicity of about 0.3 secs).
Now I add to the plot the control signals sent to the last stage of both mirrors (SRM and SR2), notice that for clarity I only plot one of the four quadrant MASTER_OUTPUT signals for each suspension:

Zooming around the lockloss shows how the step response happens immediately before the lockloss, and soon after the control signals to the SRM starts to missbehave:
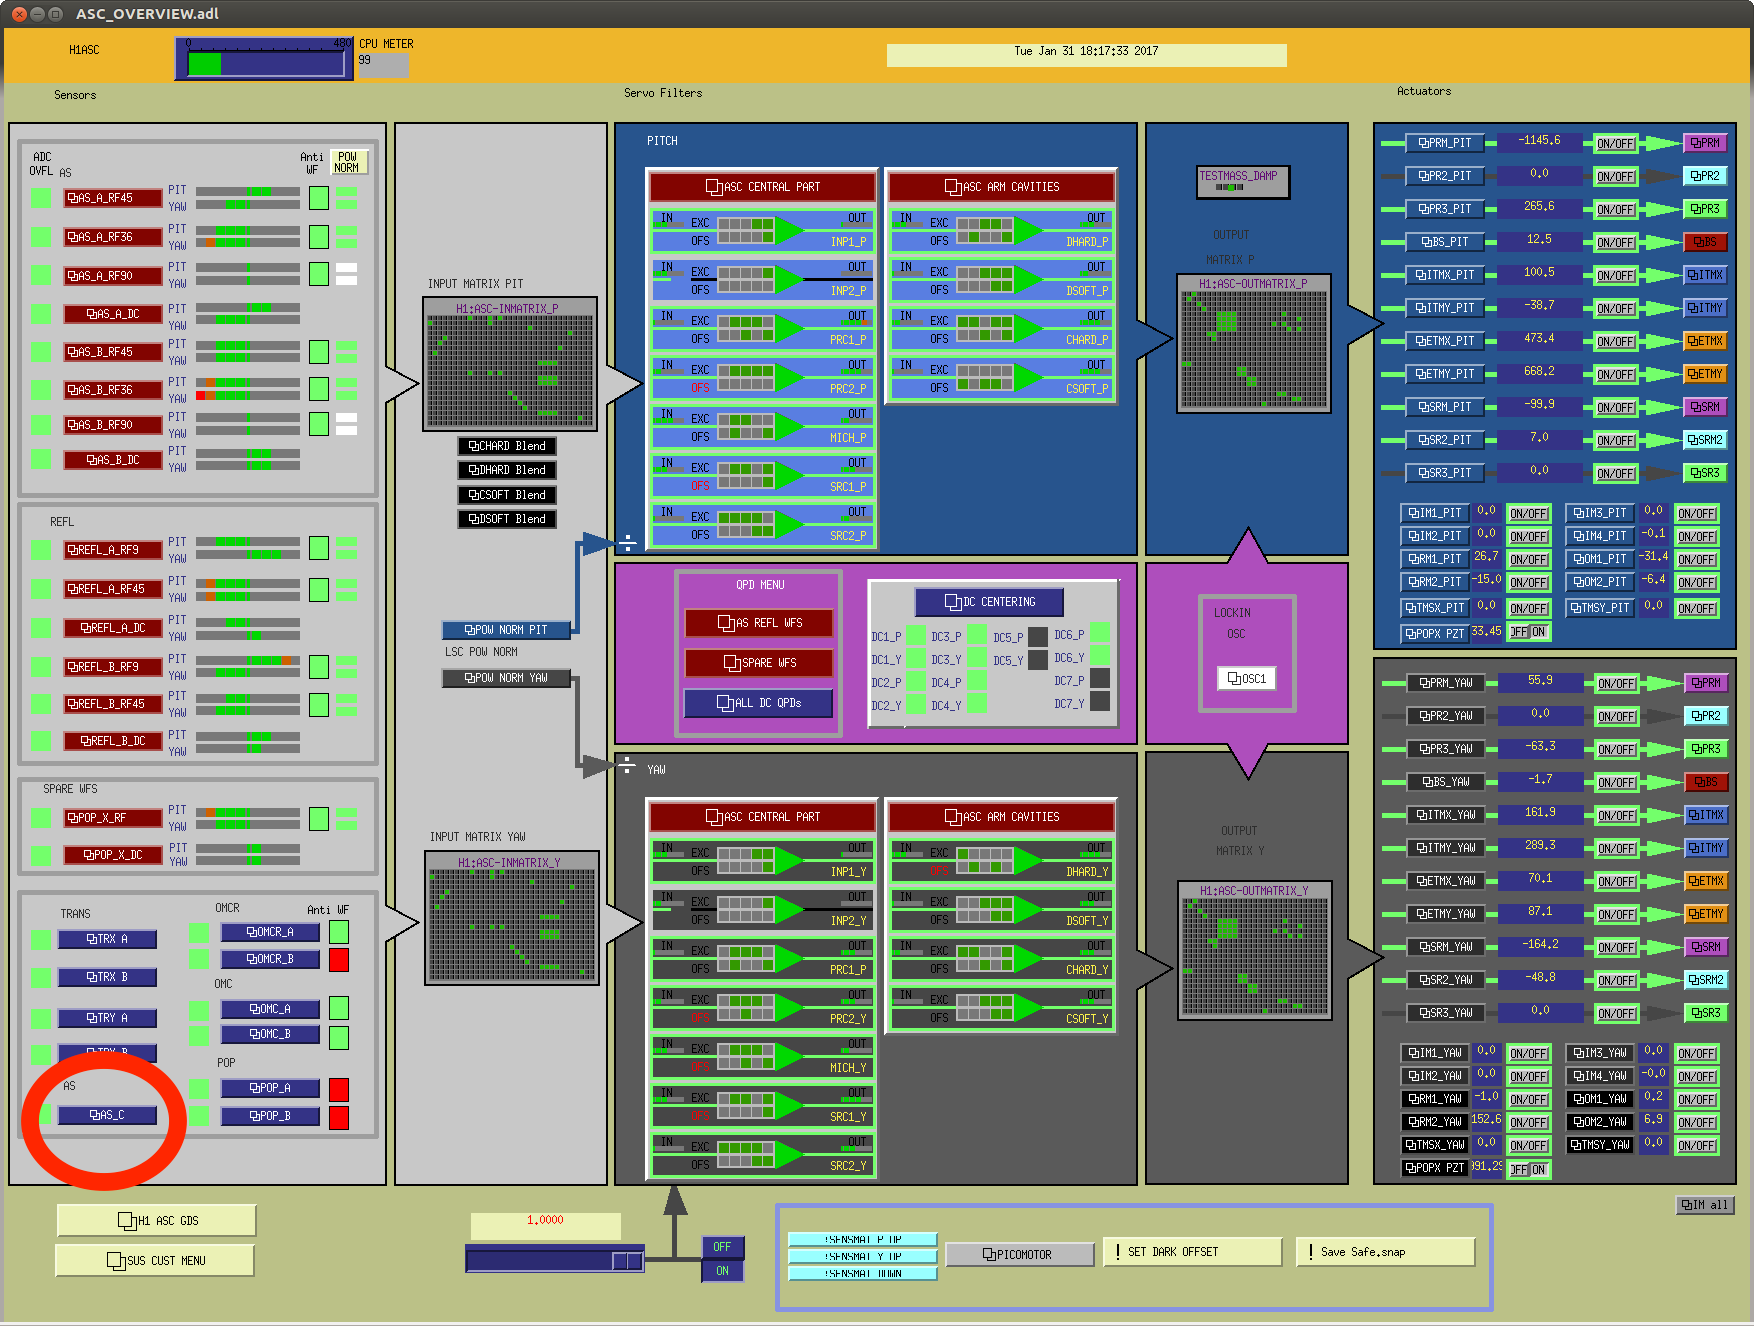
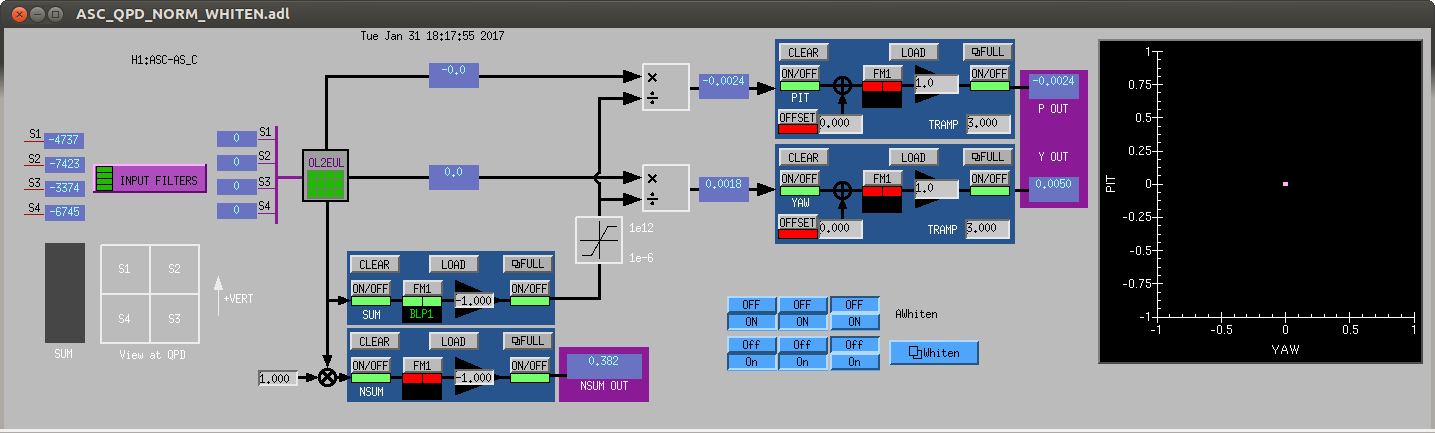
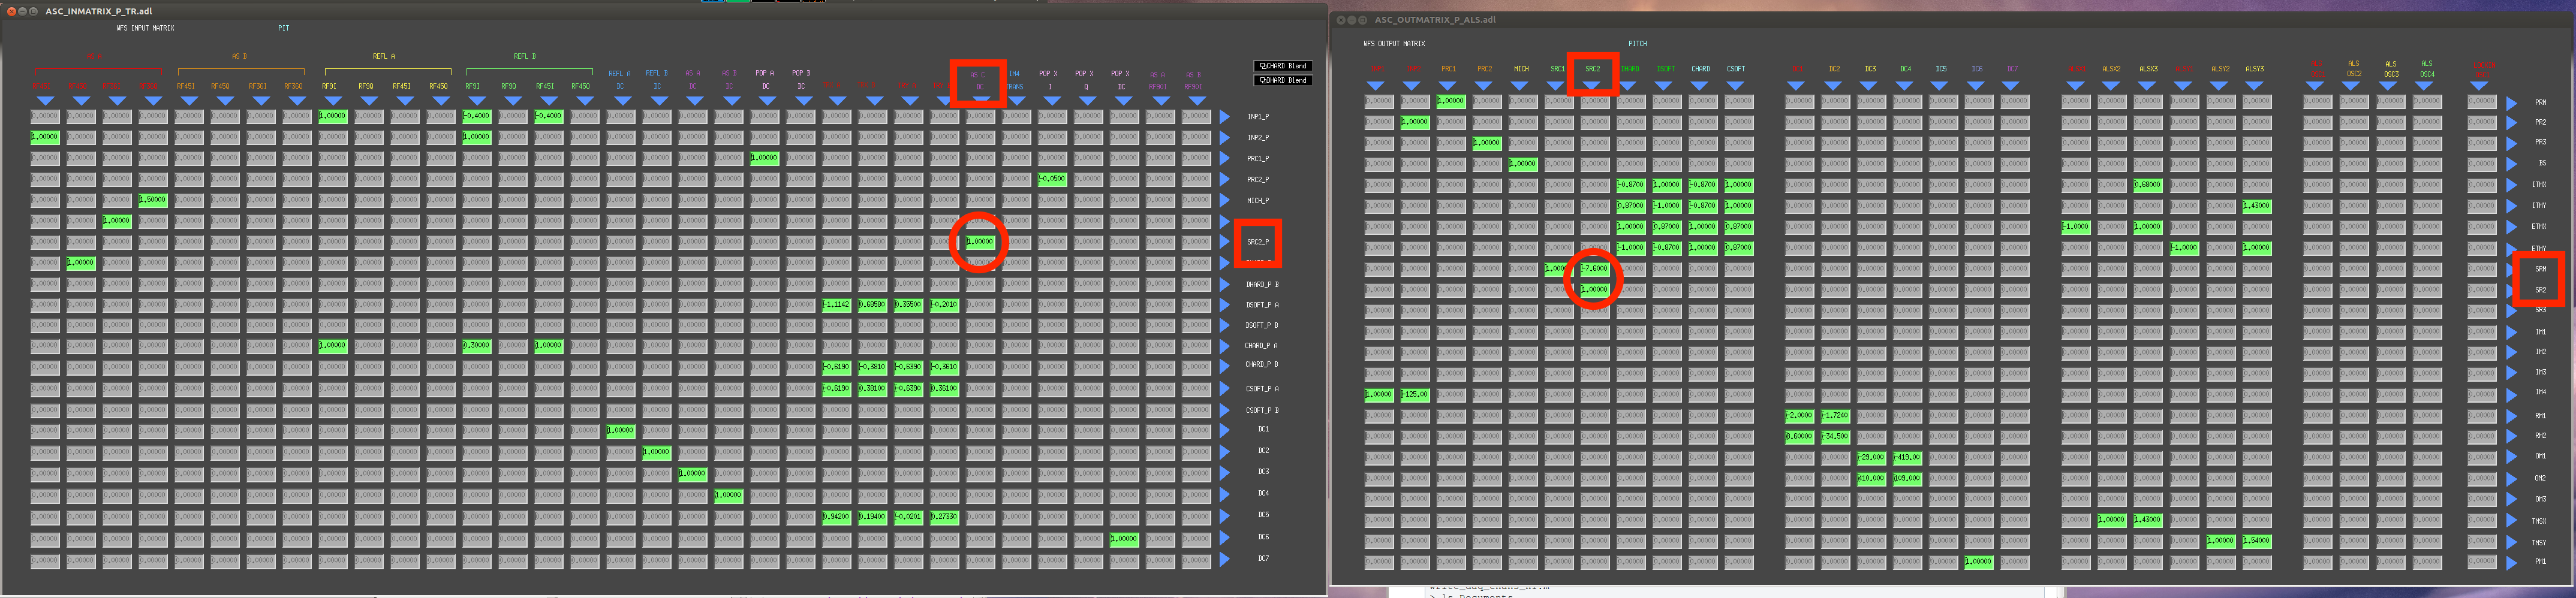
For completion and in order to see how these H1:ASC-AS_C_SEG channels are used to generate alignment signals to SRM and SR2, I have attached to this aLOG the H1ASC overview screen, also H1ASC_AS_C overview and the H1ASC Inputand-Output Matrices.
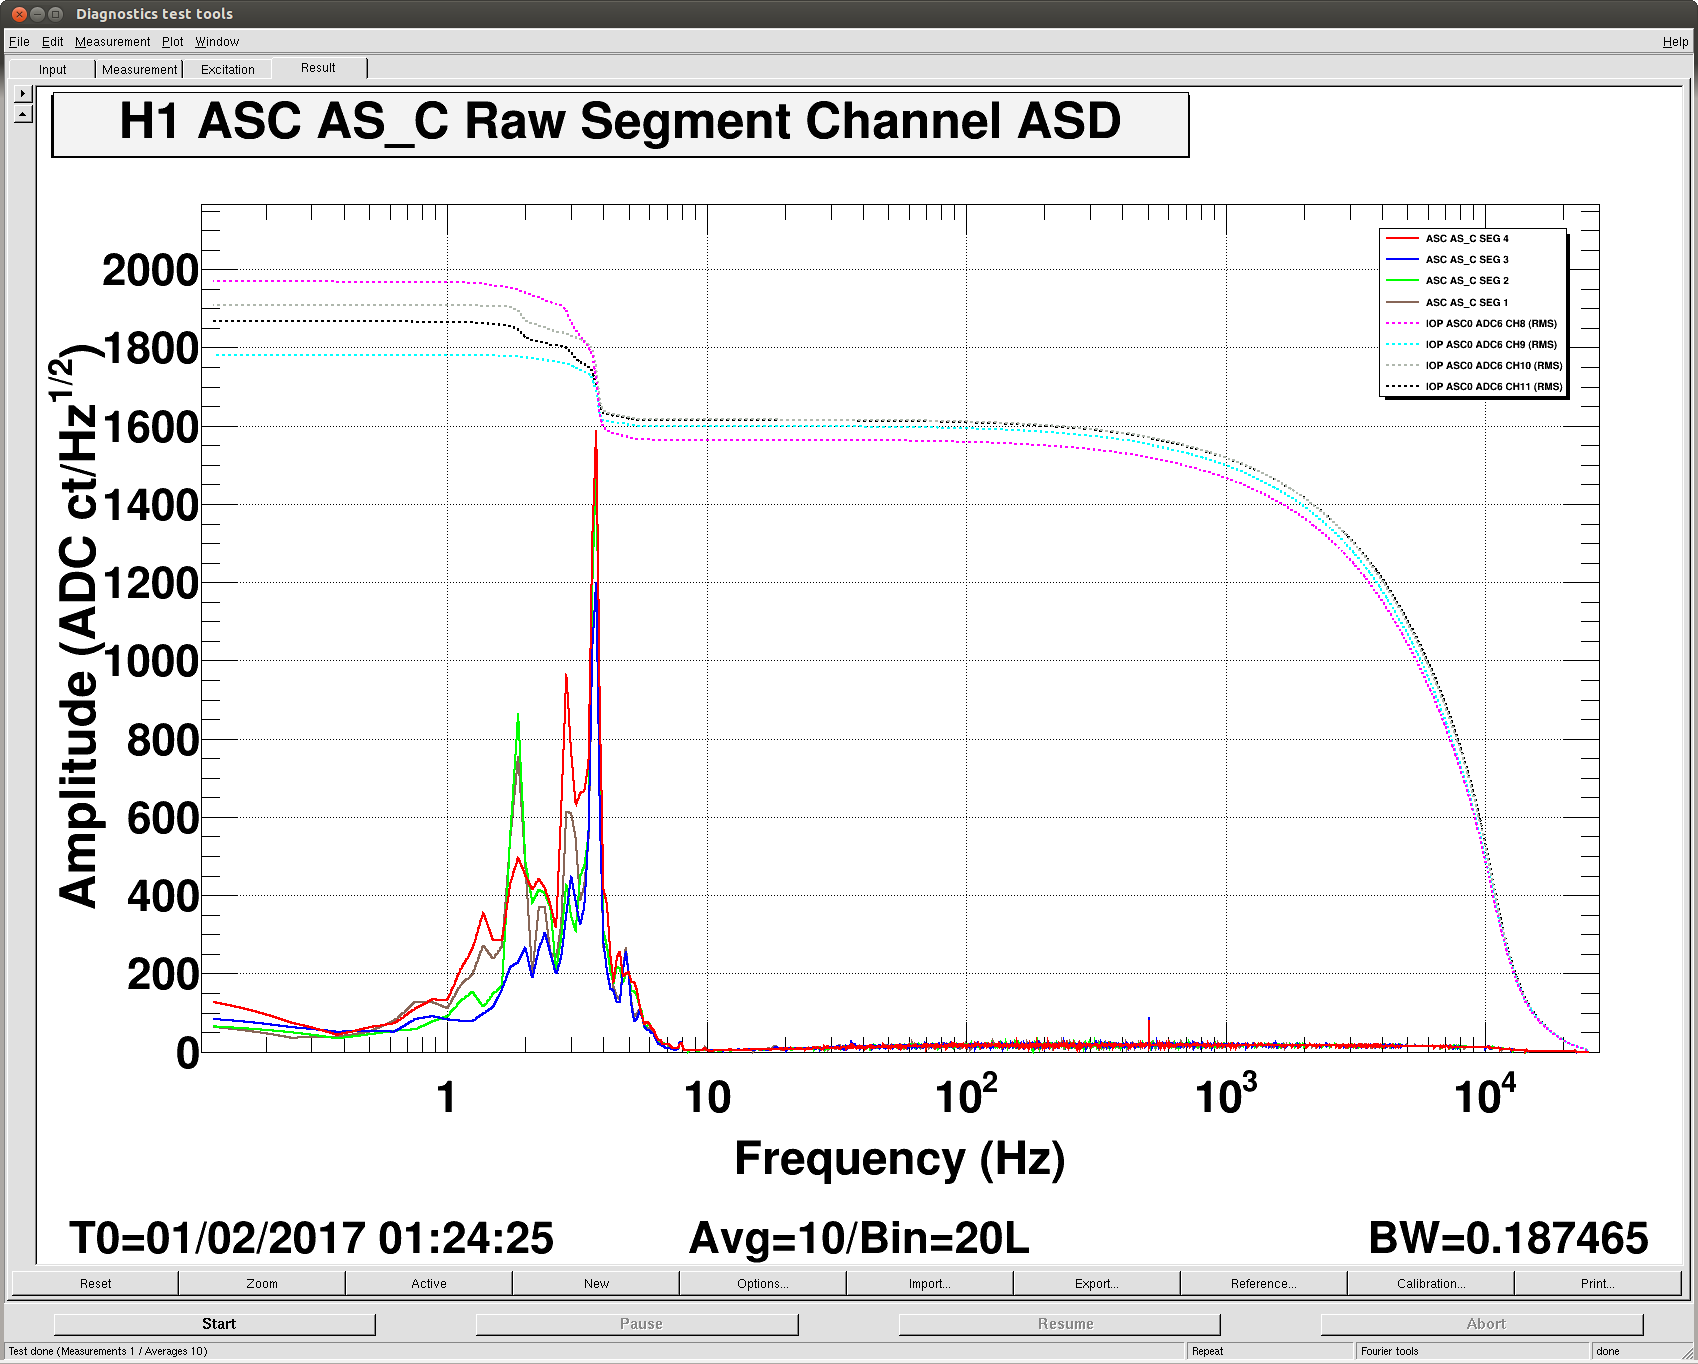
It is important to notice that saturations of these channels are not common when the detector is locked, as an example here is an ASD plot of the ASC_AS_C_SEG channels and RMS of their associated IOP channels (they are well below saturation):
Finally, Jeff suggested to also look at the step response of the downsampling from 65kHz IOP model to 16kHz of the OMC model, with a time constant of a fracion of a milisecond, could this be related to kHz glitches?: