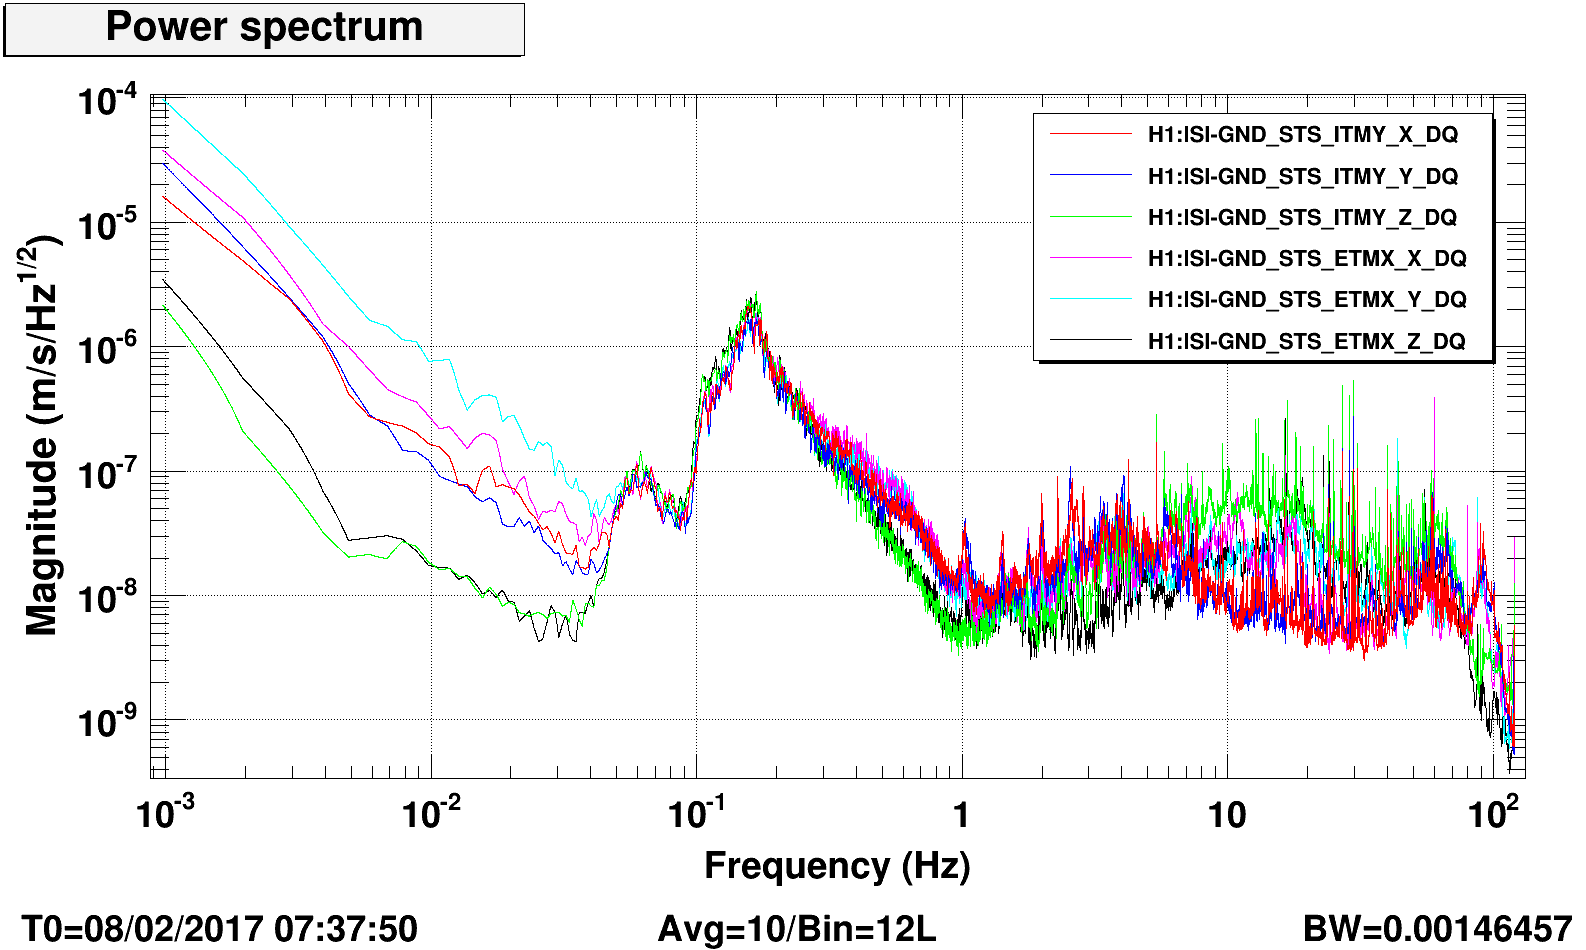
Here are spectra from the several STS2 seismometers we have around the site, all are on the floor except BRS PEM:
HAM2-- Just +X of HAM2
ITMY-- ~+8m +X & +Y
ETMX-- ~3m -X of ETMX
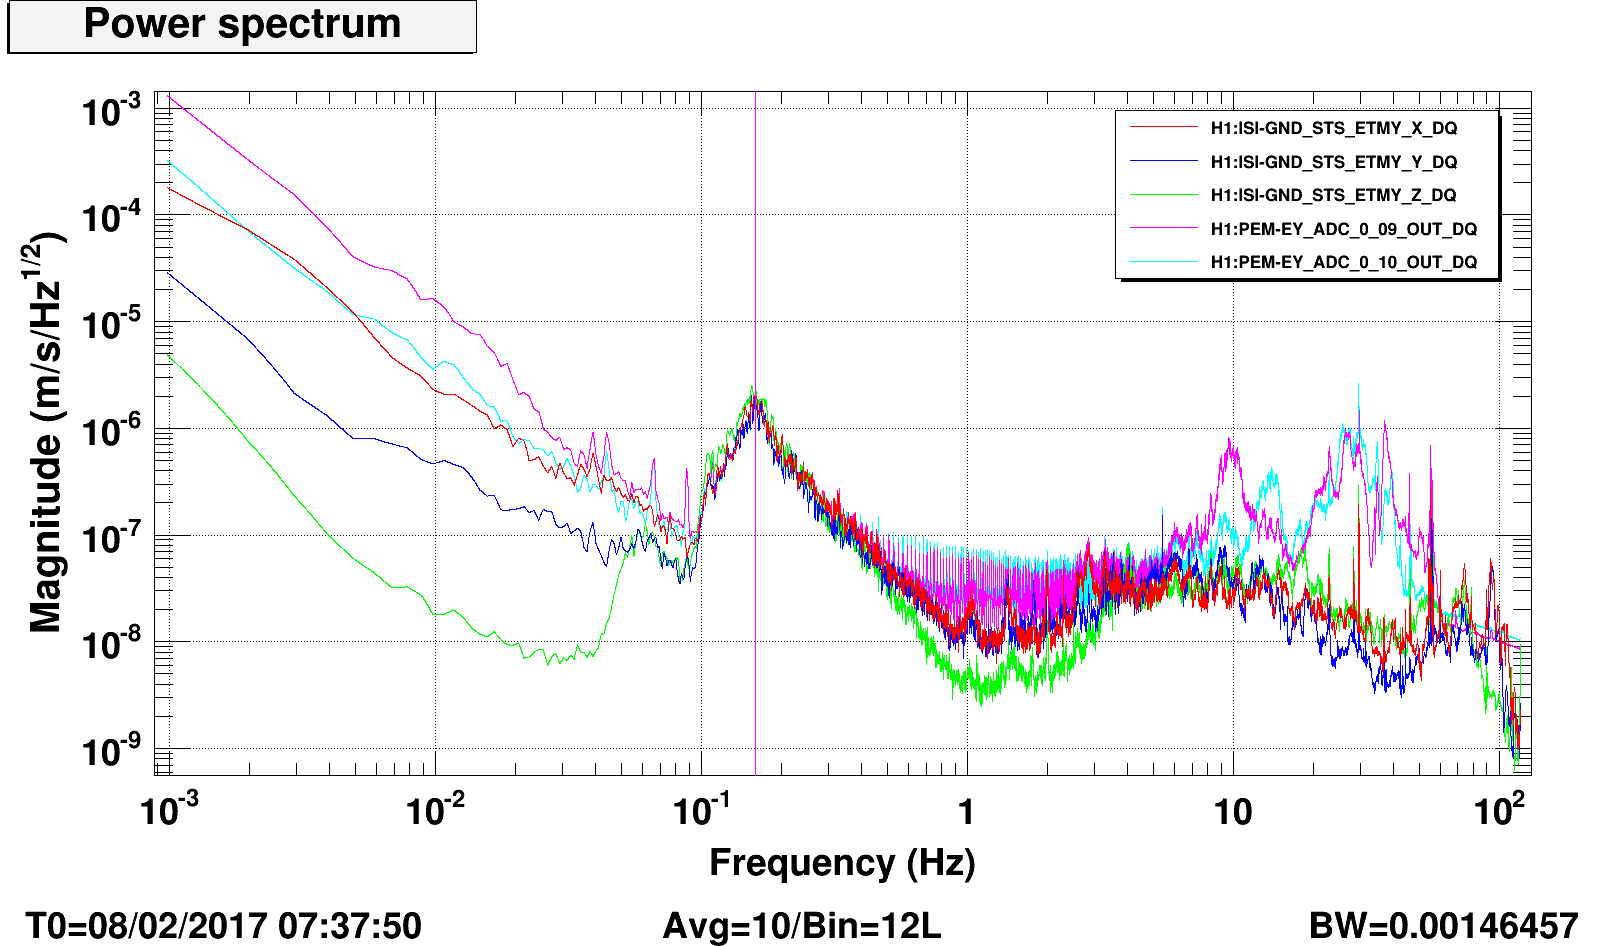
ETMY-- ~3m -Y of ETMY adjacent to BRS Housing
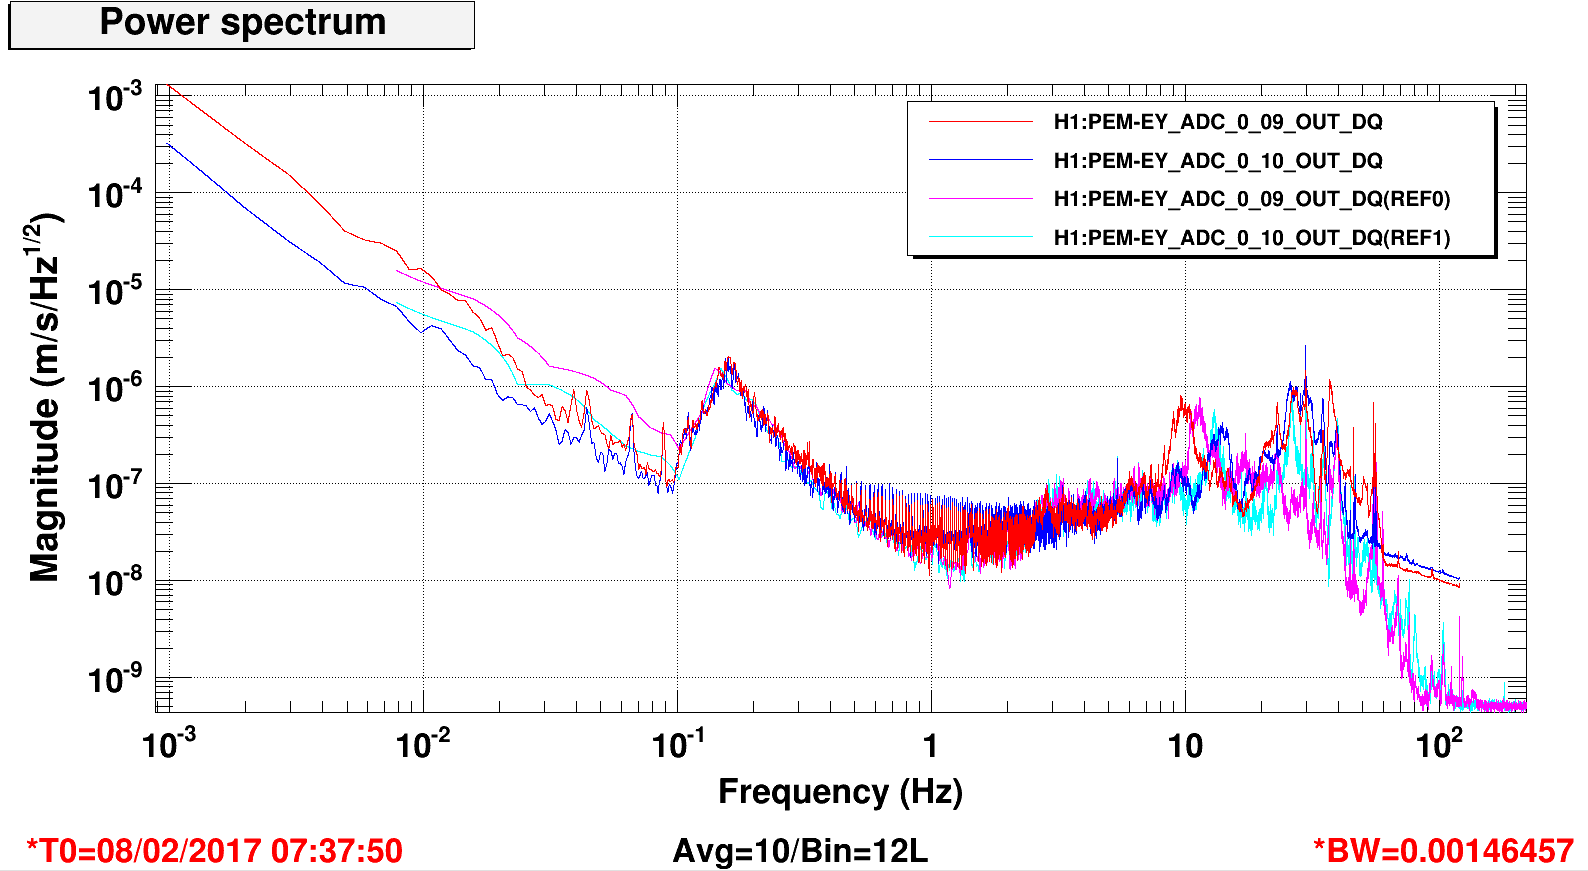
BRS PEM (ADC_0_9[10]_OUT) sitting on table mounted to BRS base plate, see 33387 for images.
These spectra were all taken (except the one reference set) about 1137pst 7 Feb when the Site BLRMS show little wind tilt or EQ affects.
The reference traces on the PEM EY unit mounted with the BRS were before the centering I did 31 Jan. See Krishna 33648 for the problems it had. Sadly, my attempts to center it then and as of yesterday, power cycling it and more centering, has managed to center it but has not relieved it of the glitching started on 31 Jan.
J. Kissel, H. Radkins, J. Warner

We're collectively surprised that we haven't aLOGged it before, but here's a description of the DTT calibration for the STS channels (i.e. H1:ISI-GND_STS_${CHAMBER}_${DOF}_DQ) -- if you want to properly invert the inertial sensor response of the STS, which is an 8.3 mHz resonant spring with a critically coupled Q of sqrt(2)/2 (or a phase between the complex poles of 45 [deg]). We don't typically invert the response, because we typically only show data down to 10 mHz, and the impact of the inertial sensor response distorting the true displacement/velocity is minimal.

Also, remember, I'm assuming that the H1:ISI-GND_STS_${CHAMBER}_${DOF}_DQ channels have their gain pre-calibrated to asymptote to velocity units of 1 [(nm/s)/ct].

(Note, it won't really make a difference, but Hugh -- at my imprecise request -- used 8 mHz as the pole frequency instead of 8.3 mHz in the plots above)

    Unit = "m/s"

    gain = 1e-9 * prod( pair(0.0083,45) )             % [(nm/s) / (m/s)] * [(m/s)/ct] in matlab notation
         = 1e-9 * 6.889e-05                           % [(nm/s) / (m/s)] * [(m/s)/ct] numerically evaluated
         = 6.5e-14 [(m/s)/ct]                         % [Hz] what you should stick into DTT

    poles = 0,0                                       % [Hz] what you should stick into DTT (note the comma!)

    zeros = pair(0.0083,45)                           % [Hz] in matlab notation
          = 0.005869 0.005869                         % [Hz] what you should stick into DTT (note the lack of comma!)

I prefer to enter in this more simple calibration in velocity [m/s], and let DTT do the integration if I want to convert to displacement [m]. However, if you want to get straight to the punch, then you'll want to enter in

    Unit = "m"

    gain = 1e-9 / (2*pi) * prod( pair(0.0083,45) )    % [(nm/s) / (m/s)] * [(m/s)/ct] in matlab notation
         = 1e-9 * 0.159 * 6.889e-05 [(m/s)/ct]        % [(nm/s) / (m/s)] * [(m/s)/ct] numerically evaluated
         = 1.1e-14 [(m/s)/ct]                         % [Hz] what you should stick into DTT

    poles = 0,0,0                                     % [Hz] what you should stick into DTT (note the comma!)

    zeros = pair(0.0083,45)                           % [Hz] in matlab notation
          = 0.005869 0.005869                         % [Hz] what you should stick into DTT (note the lack of comma!)

Happy low frequency hunting!
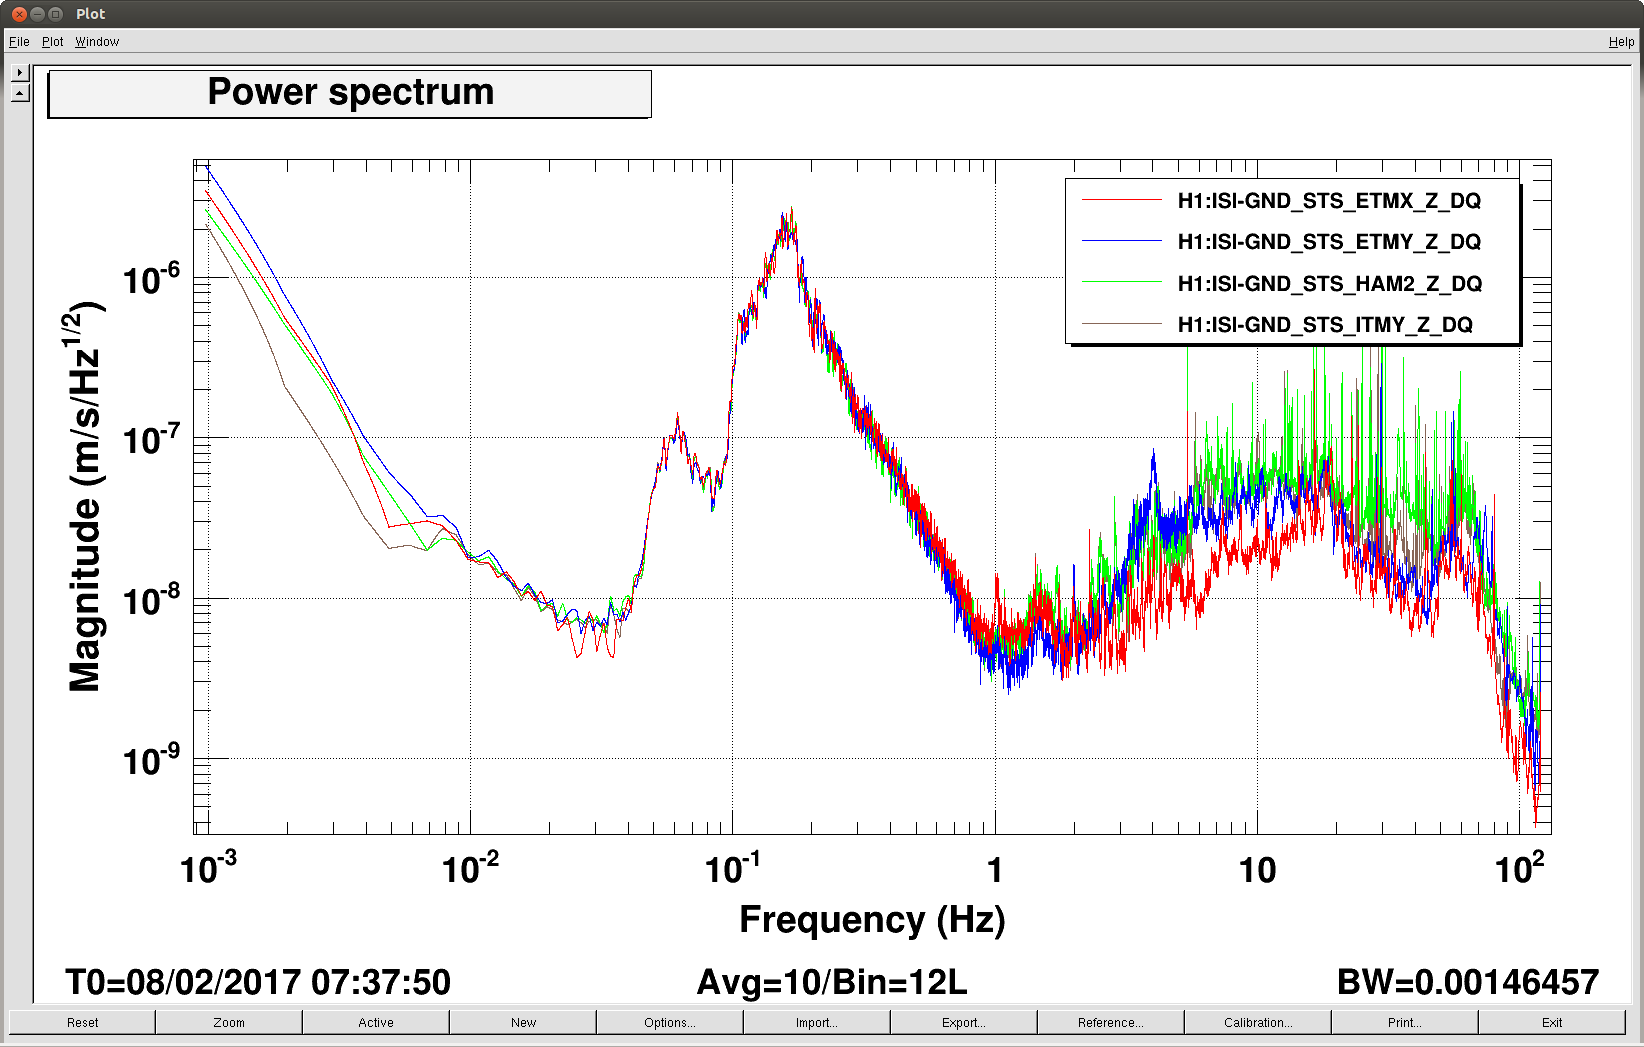
Site Common DOF Spectra
The attached 3 plots put the four GND STSs on common DOF graphs to better compare there performance. They are the same traces as above.
Let's start with Z. Cause it looks easy. Pretty similar between 0.010 and 1 Hz. Above that band, ETMX gets quieter or the others get noisier. Below, ITMY gets quieter.
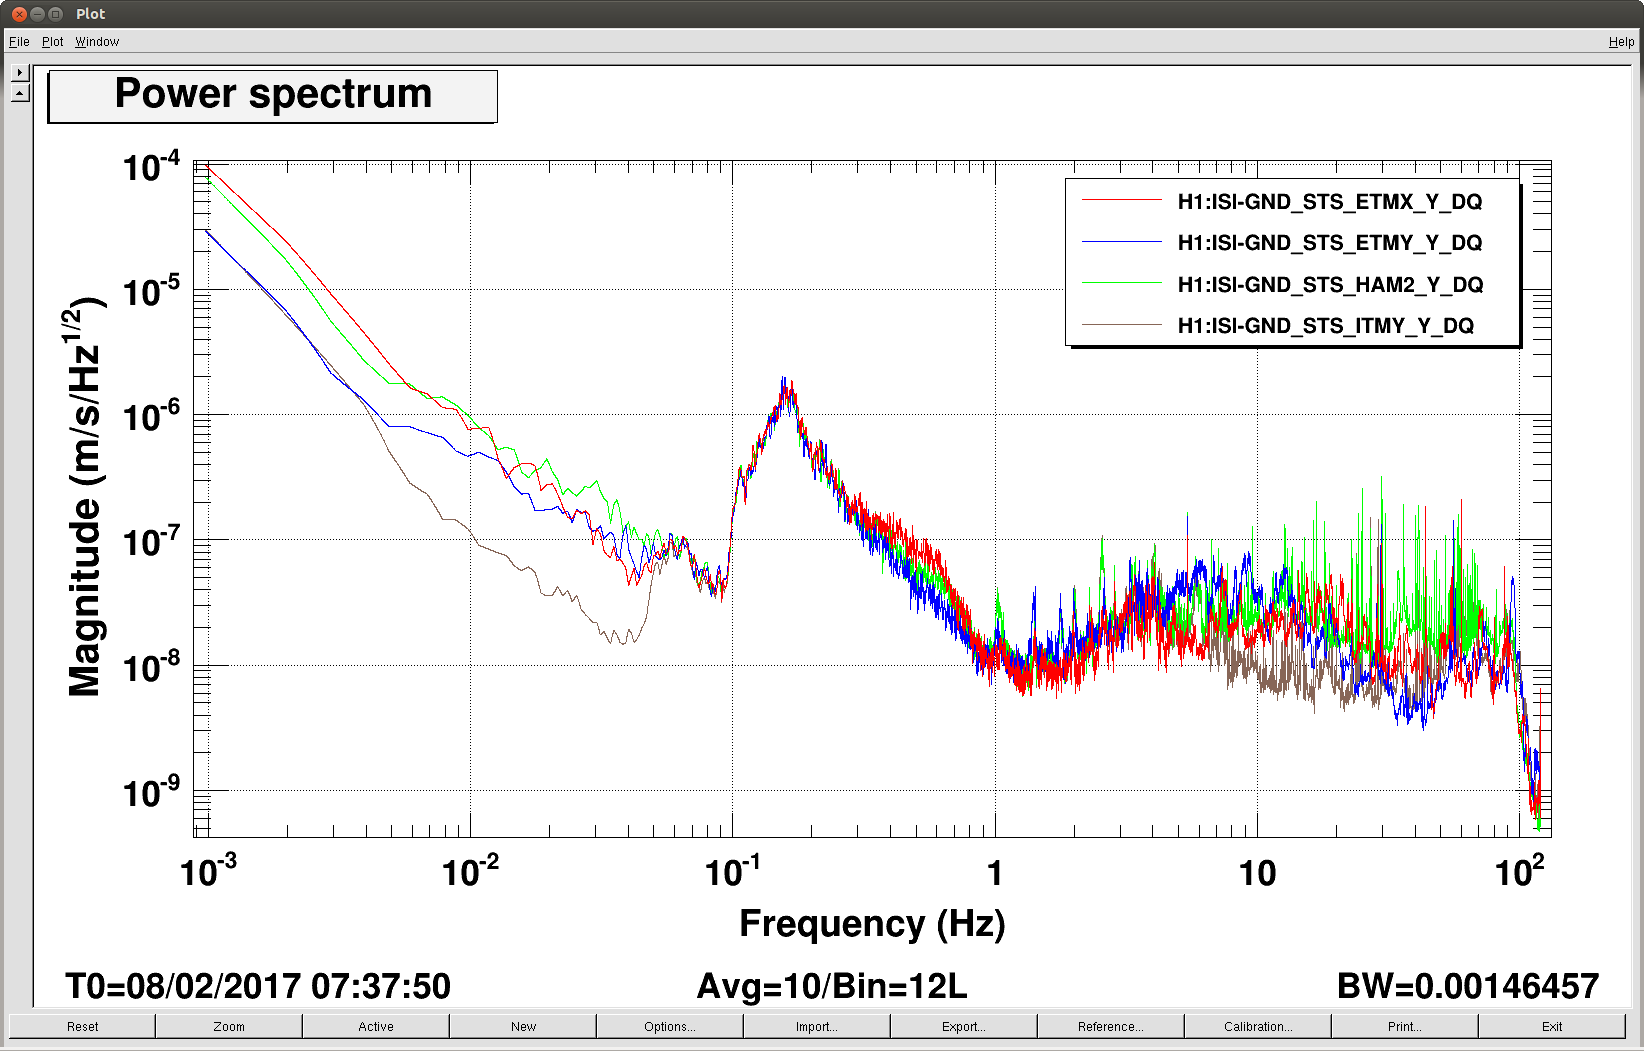
For the Y Dof, maybe this shows how well the ITMY's location is free of tilt, even in this relatively wind free data. All the other sensors show a similar low-f response above 10mHz.
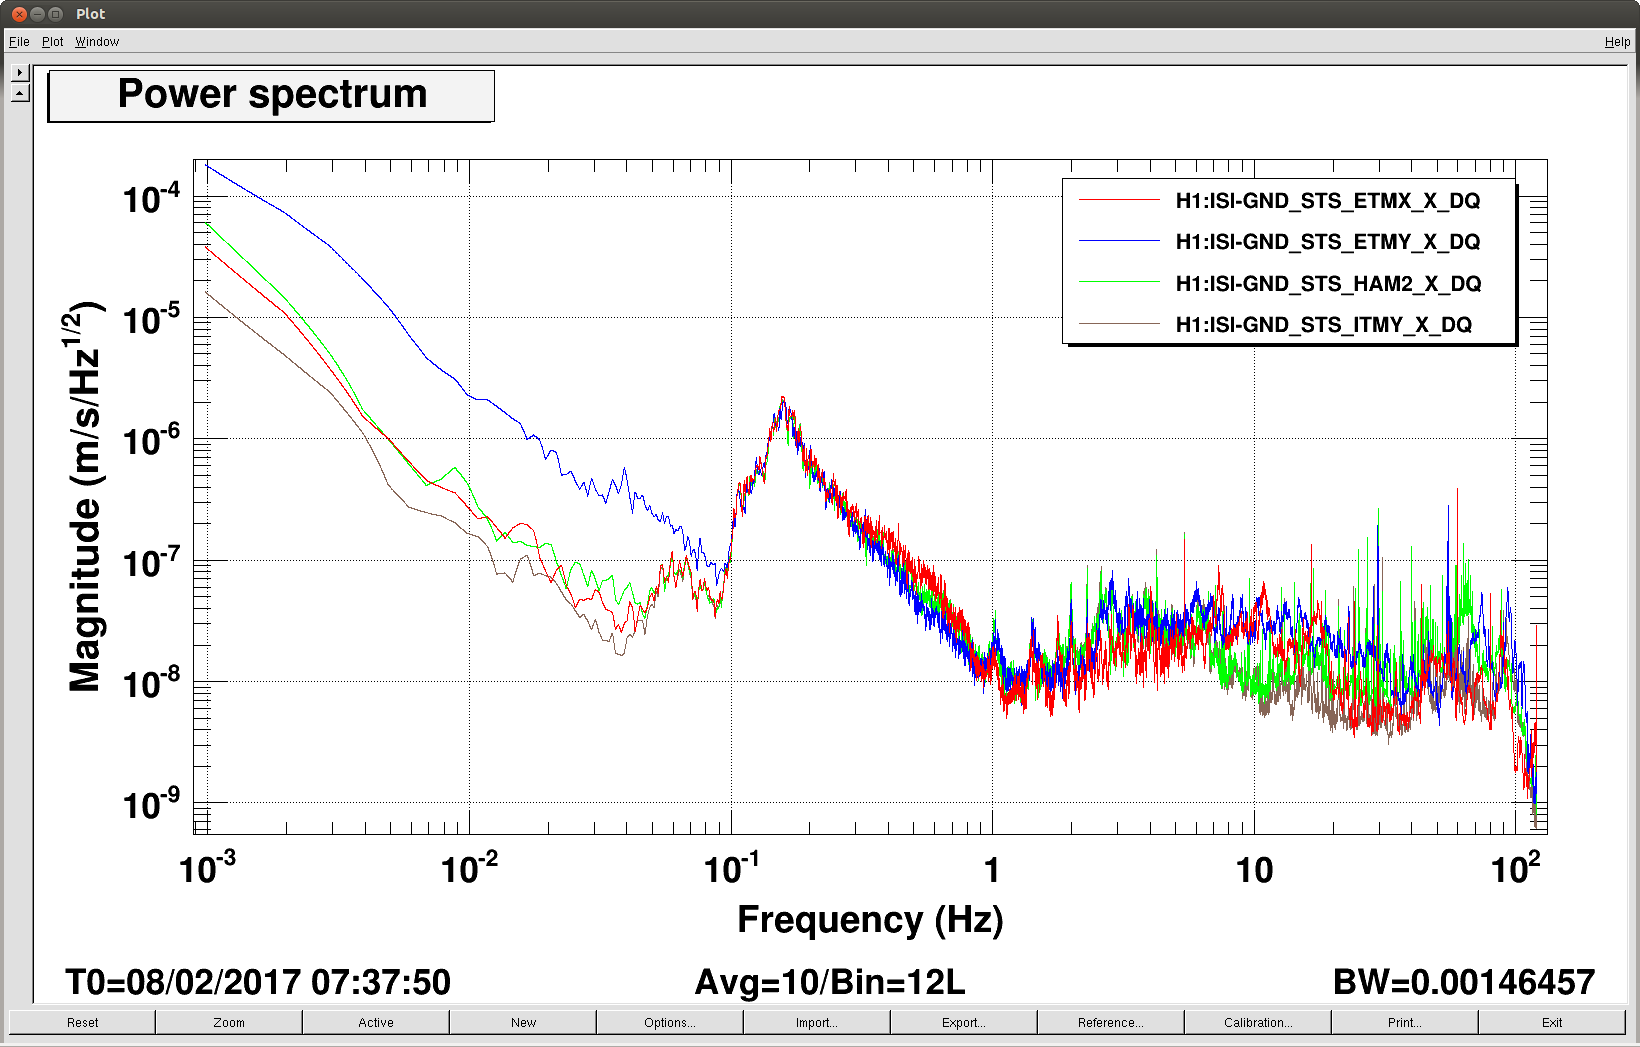
The X DoF too is interesting as the HAM2 and the ETMX data approaches the performance of the ITMY instrument: These sensors' X axes is along the long axis of the building and may see less inherent tilt. But, that would suggest I should argue that the ETMY Y axis is not performing as it should...and maybe it isn't. No matter how you slice it though, this plot suggests the ETMY X axis is not doing as well as it could. I don't think the ETMY sensor is too much closer to the outside wall than is the ETMX, maybe a little.