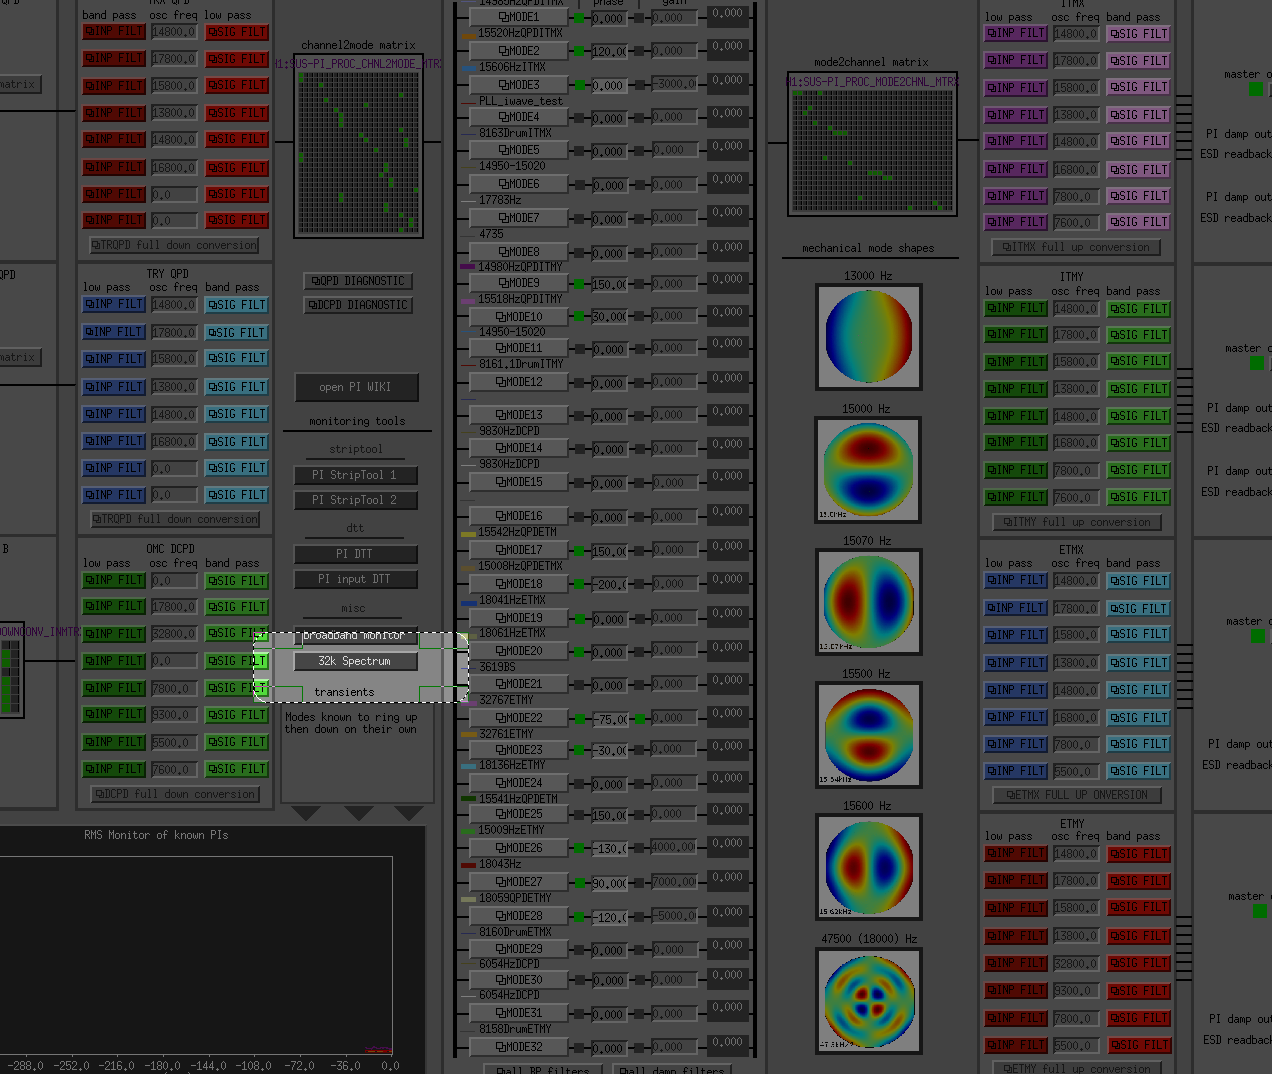
By Terra's request I have added a new button on the PI main screen that will launch a matlab script to plot the spectrum from 32758-32768Hz. Matlab has to be used because DTT cannot plot frequencies that close to the Nyquist Frequency, and python cannot be used because the Ubunutu machines have an old version of scipy without the welch function. The Debian machines do have an up-to-date version of scipy but operators use both machines. This is NOT a live spectrum, and should be used only to reference at what frequencies the modes are at. Continue to use the StripTools to monitor these PIs in real time.
A few notes:
- It can sometimes take around 50seconds before the plot is fully displayed.
- If it failed to get data from the nds, try again. It isn't always reliable for reasons that I am trying to figure out.
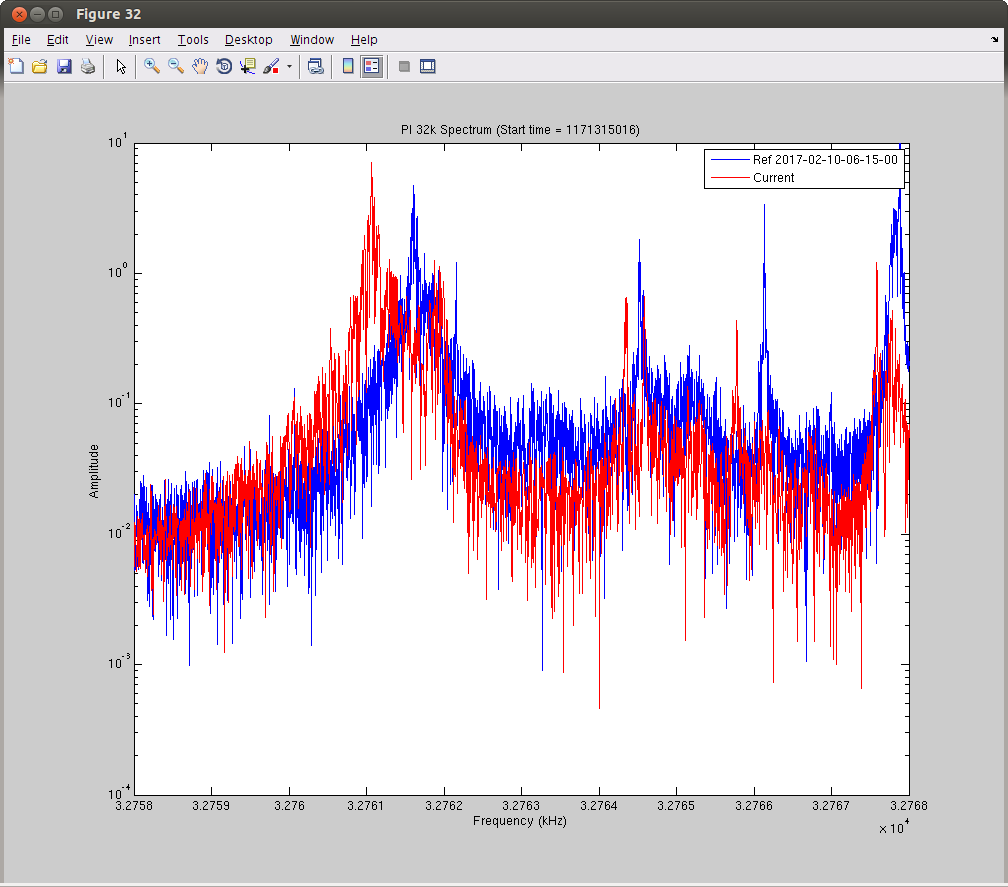
Example output attached.
To clarify a few things:
The button will call a bash script in an xterm window, which will run a <i>matlab</i> script to display the spectrum. I may have added too many negatives and triple/quadruple negatives and made what was actually being used much too confusing.
I say that it is not live in the sense that it will not continuously refresh or rerun the mesurement like we would normally see when we use DTT. The plot that is displayed takes 90 seconds worth of data, with the gps start time in the title and (now) in the legend.
Awesome, thanks so much TJ!
As TJ said, this is to be used just as you would the PI DTT - to check the BandPass placements for MODE22 and MODE23. These are new modes to the PI medm, but they've broken lock several times in the past without us knowing, so lets keep an eye on them.