Posting a couple of quick plots comparing LHO's duty cycle and environment between O1 & O2.
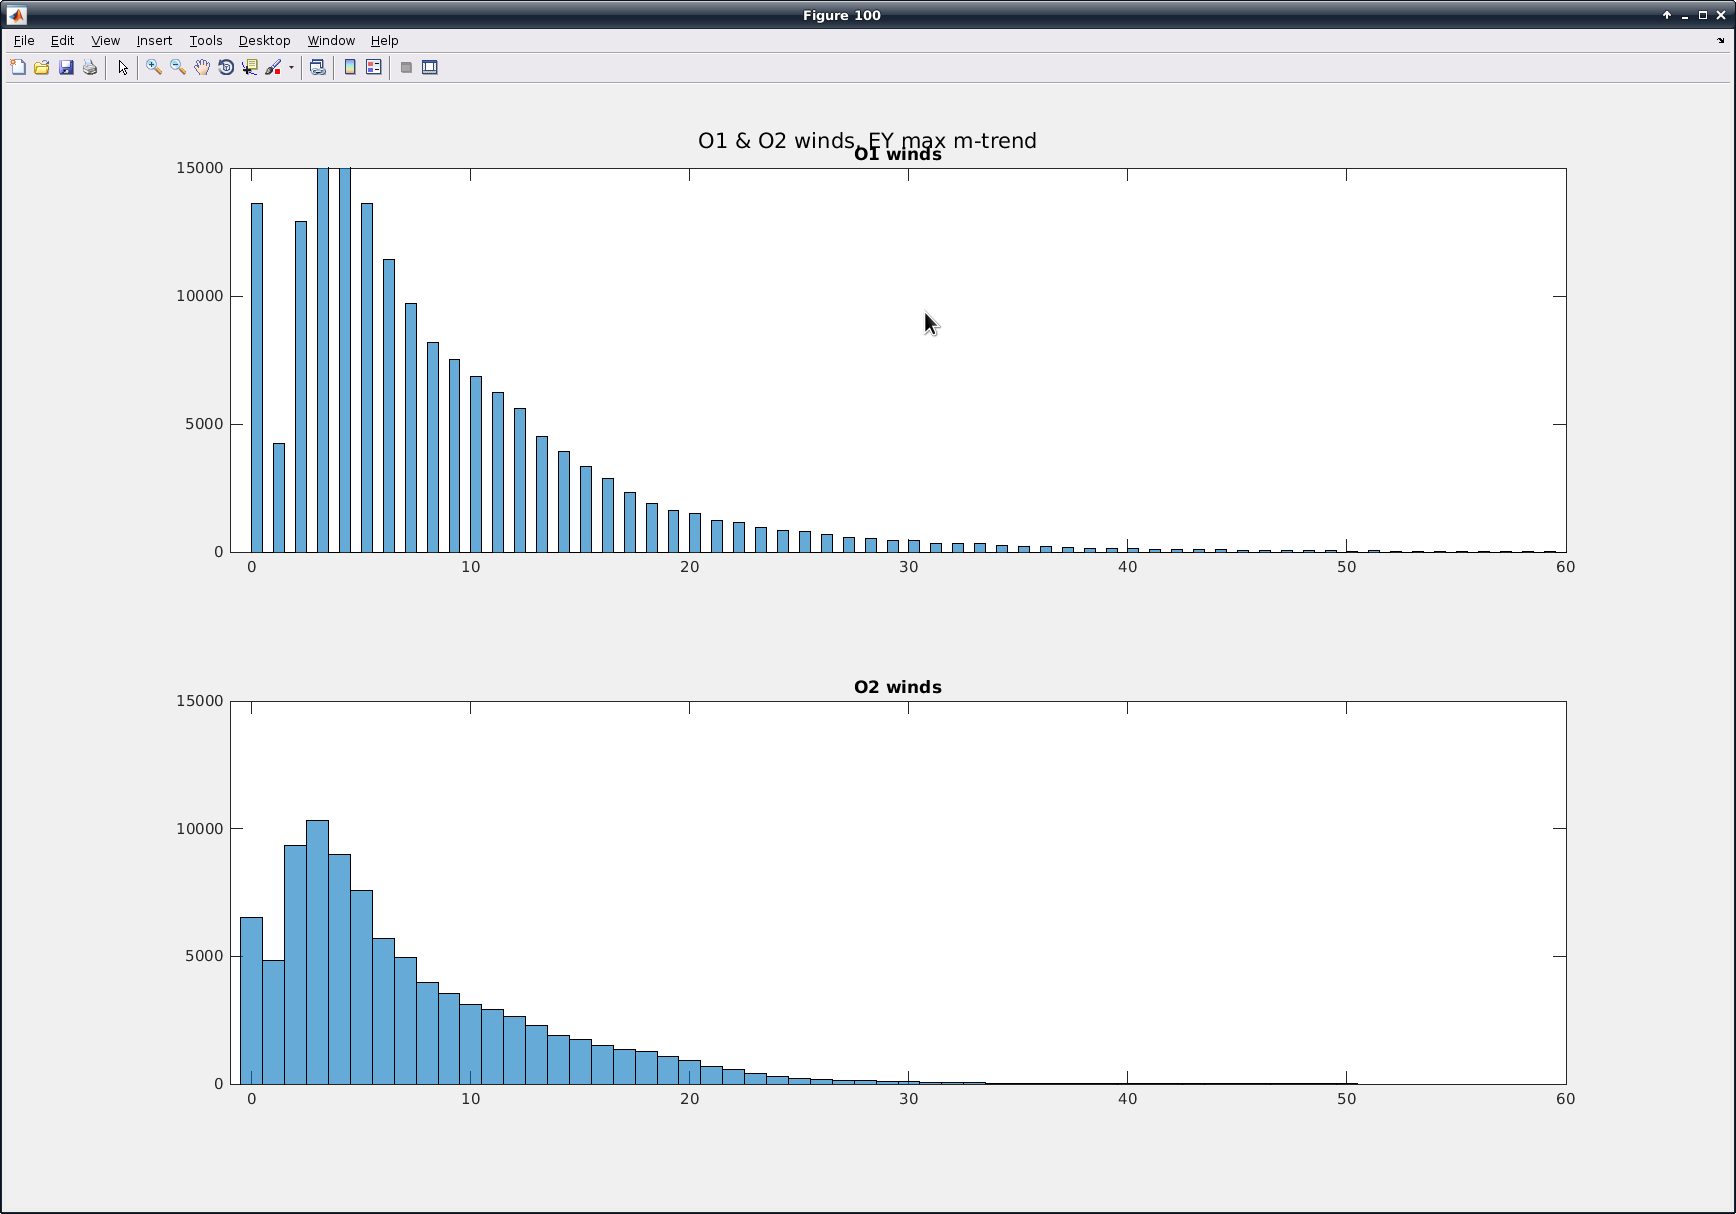
The first plot are histograms of the total wind for O1 & O2. Overall O2 has been gentle compared to O1.
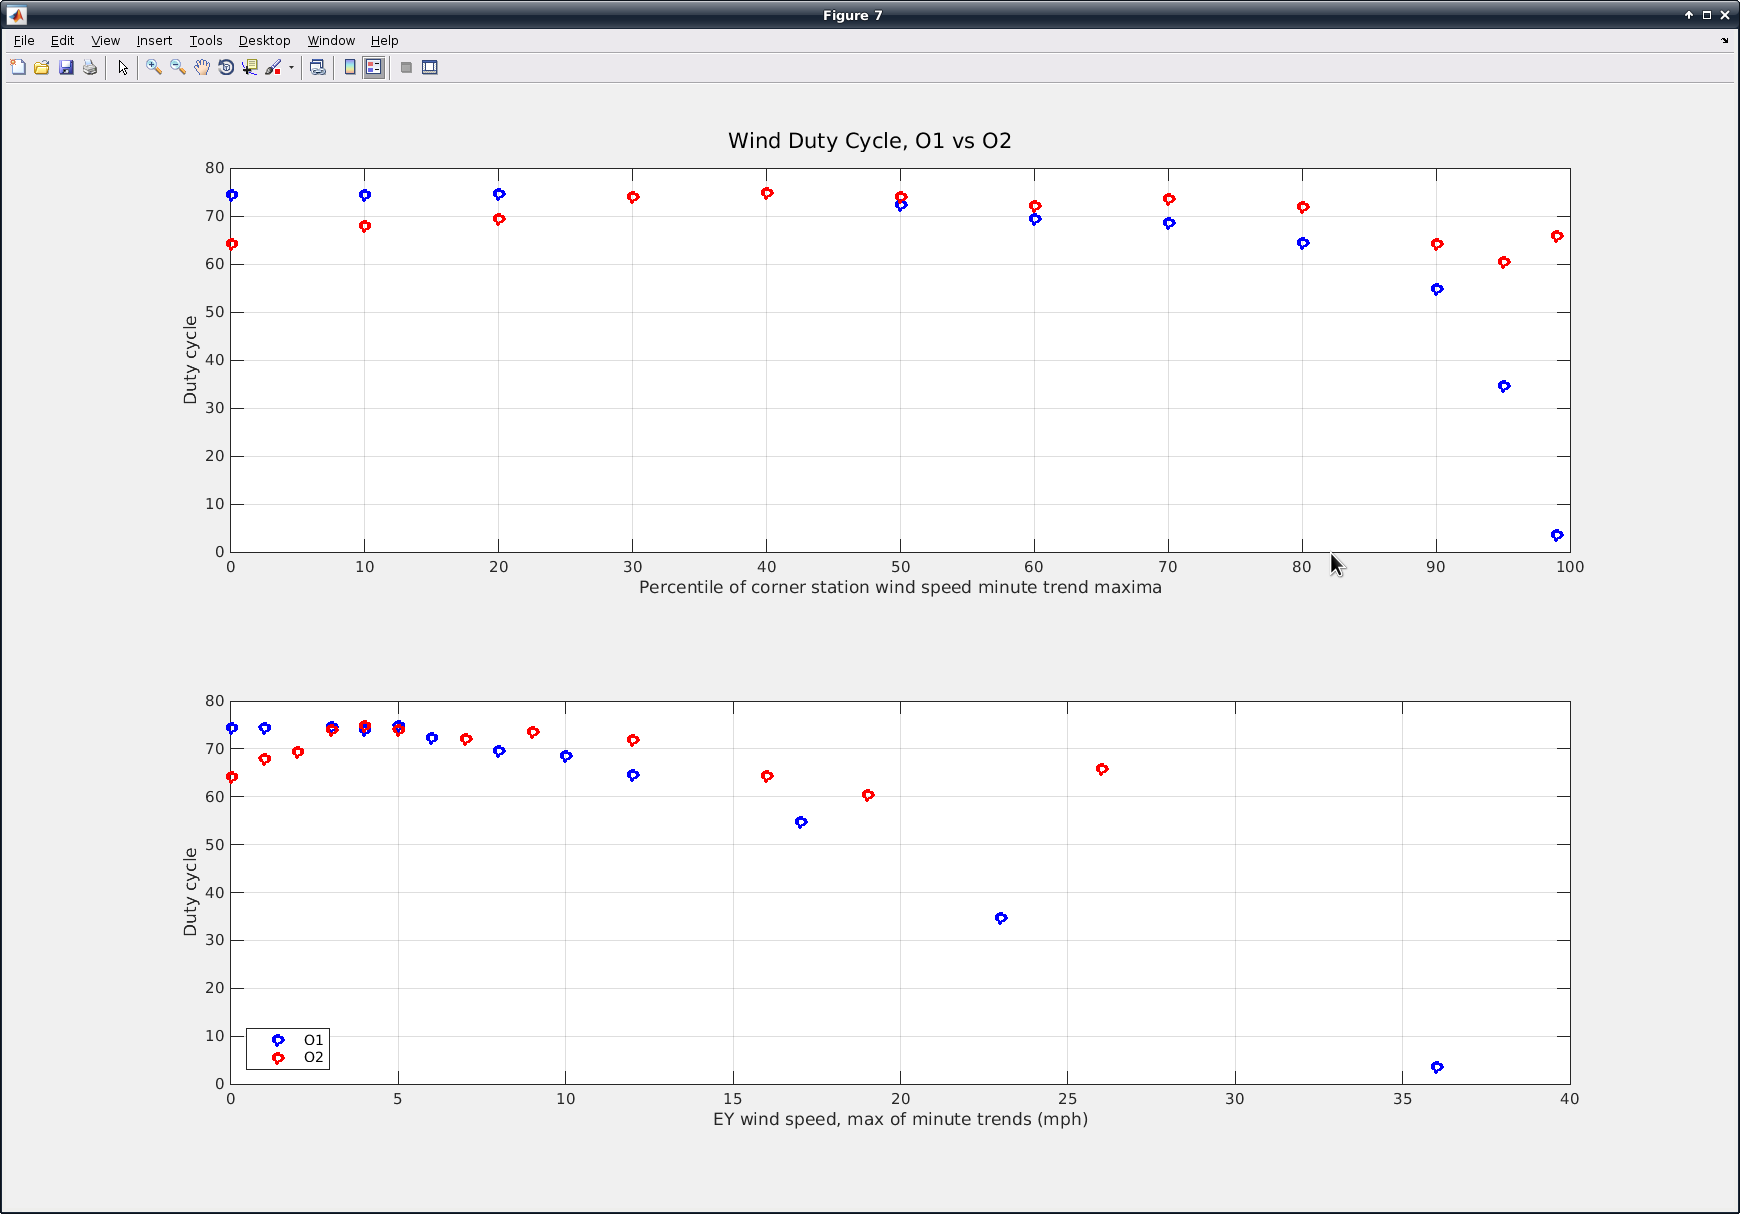
The second plot is the wind duty cycle comparison in both percentile and absolute wind speed. LHO is doing better overall (I think the dip at low wind speeds is partly due to Snowpocalypse 2017), but we will know better after more run time. Spring is coming!
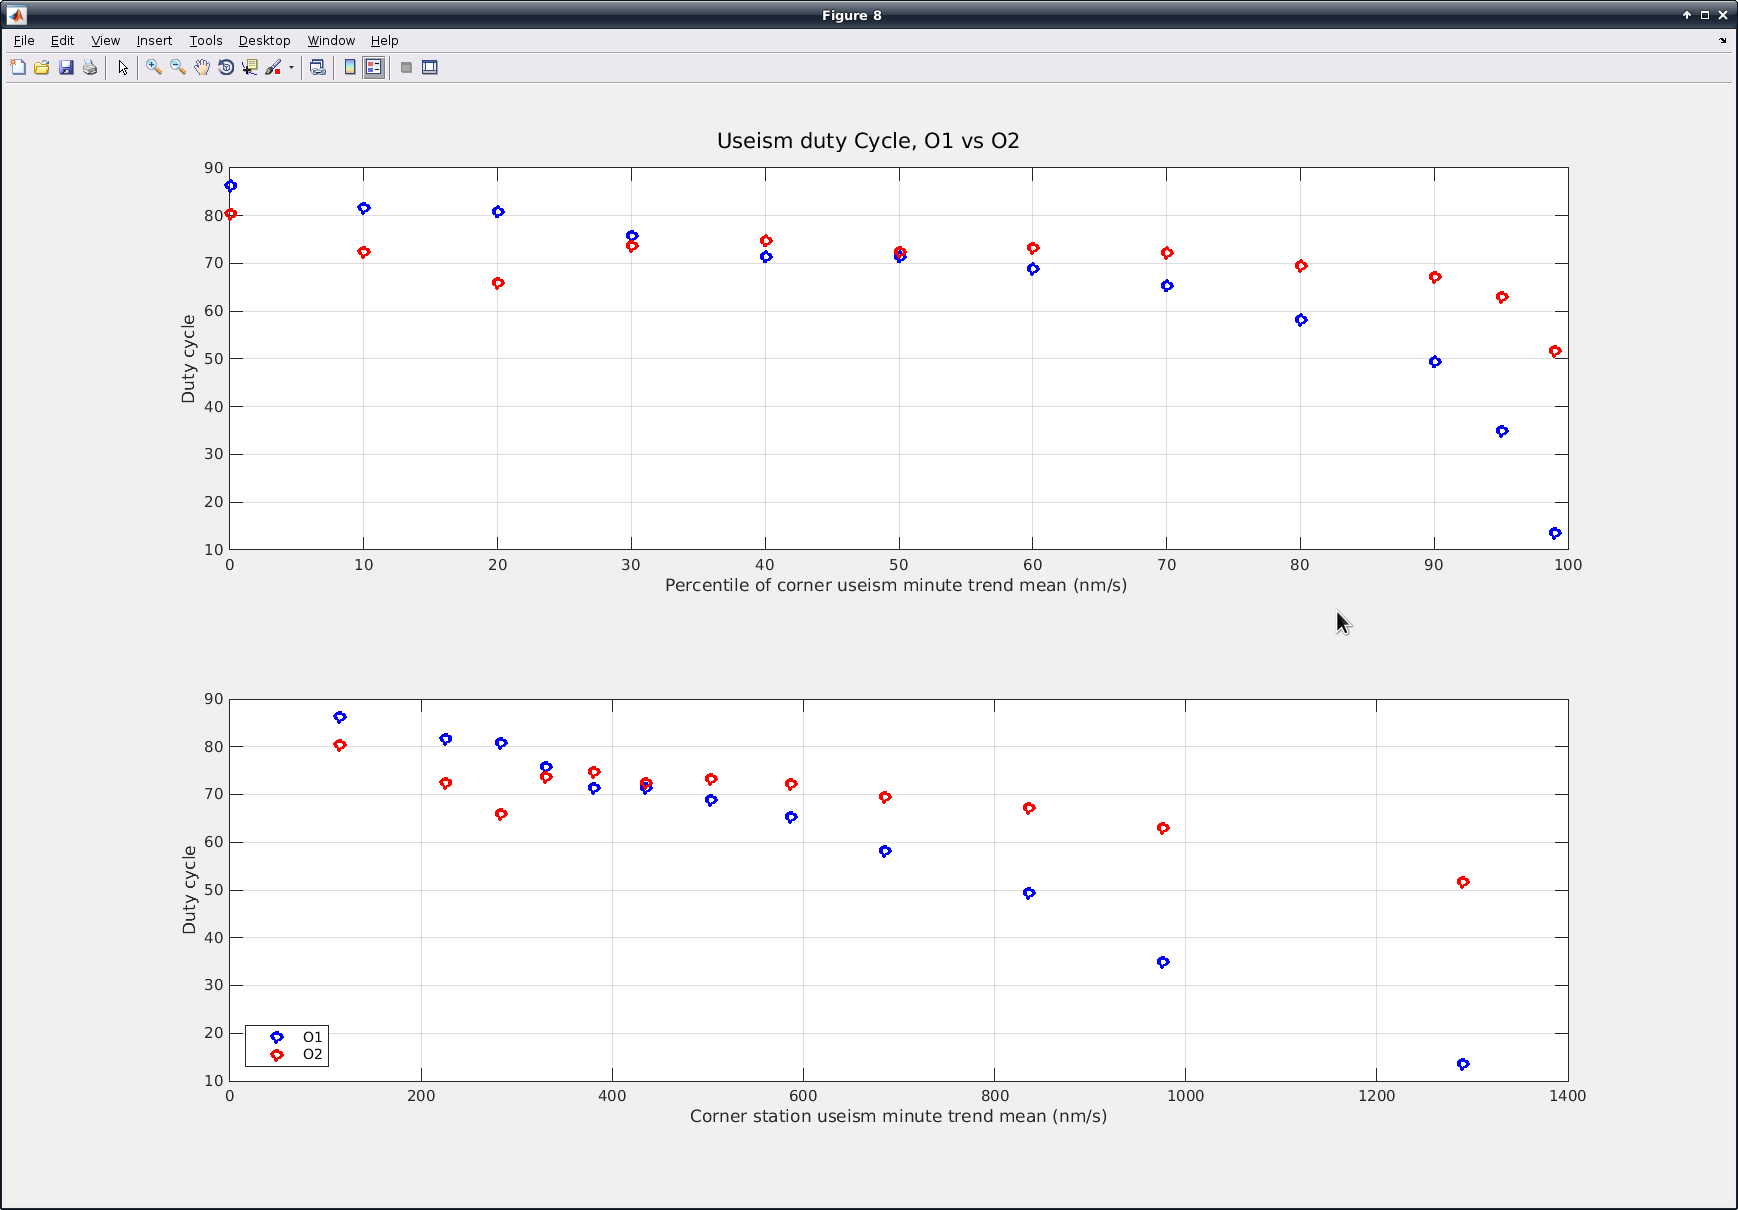
The third plot is the duty cycle for microseism. Still looking pretty good compared to O1, and we made it through the worst of the microseism.
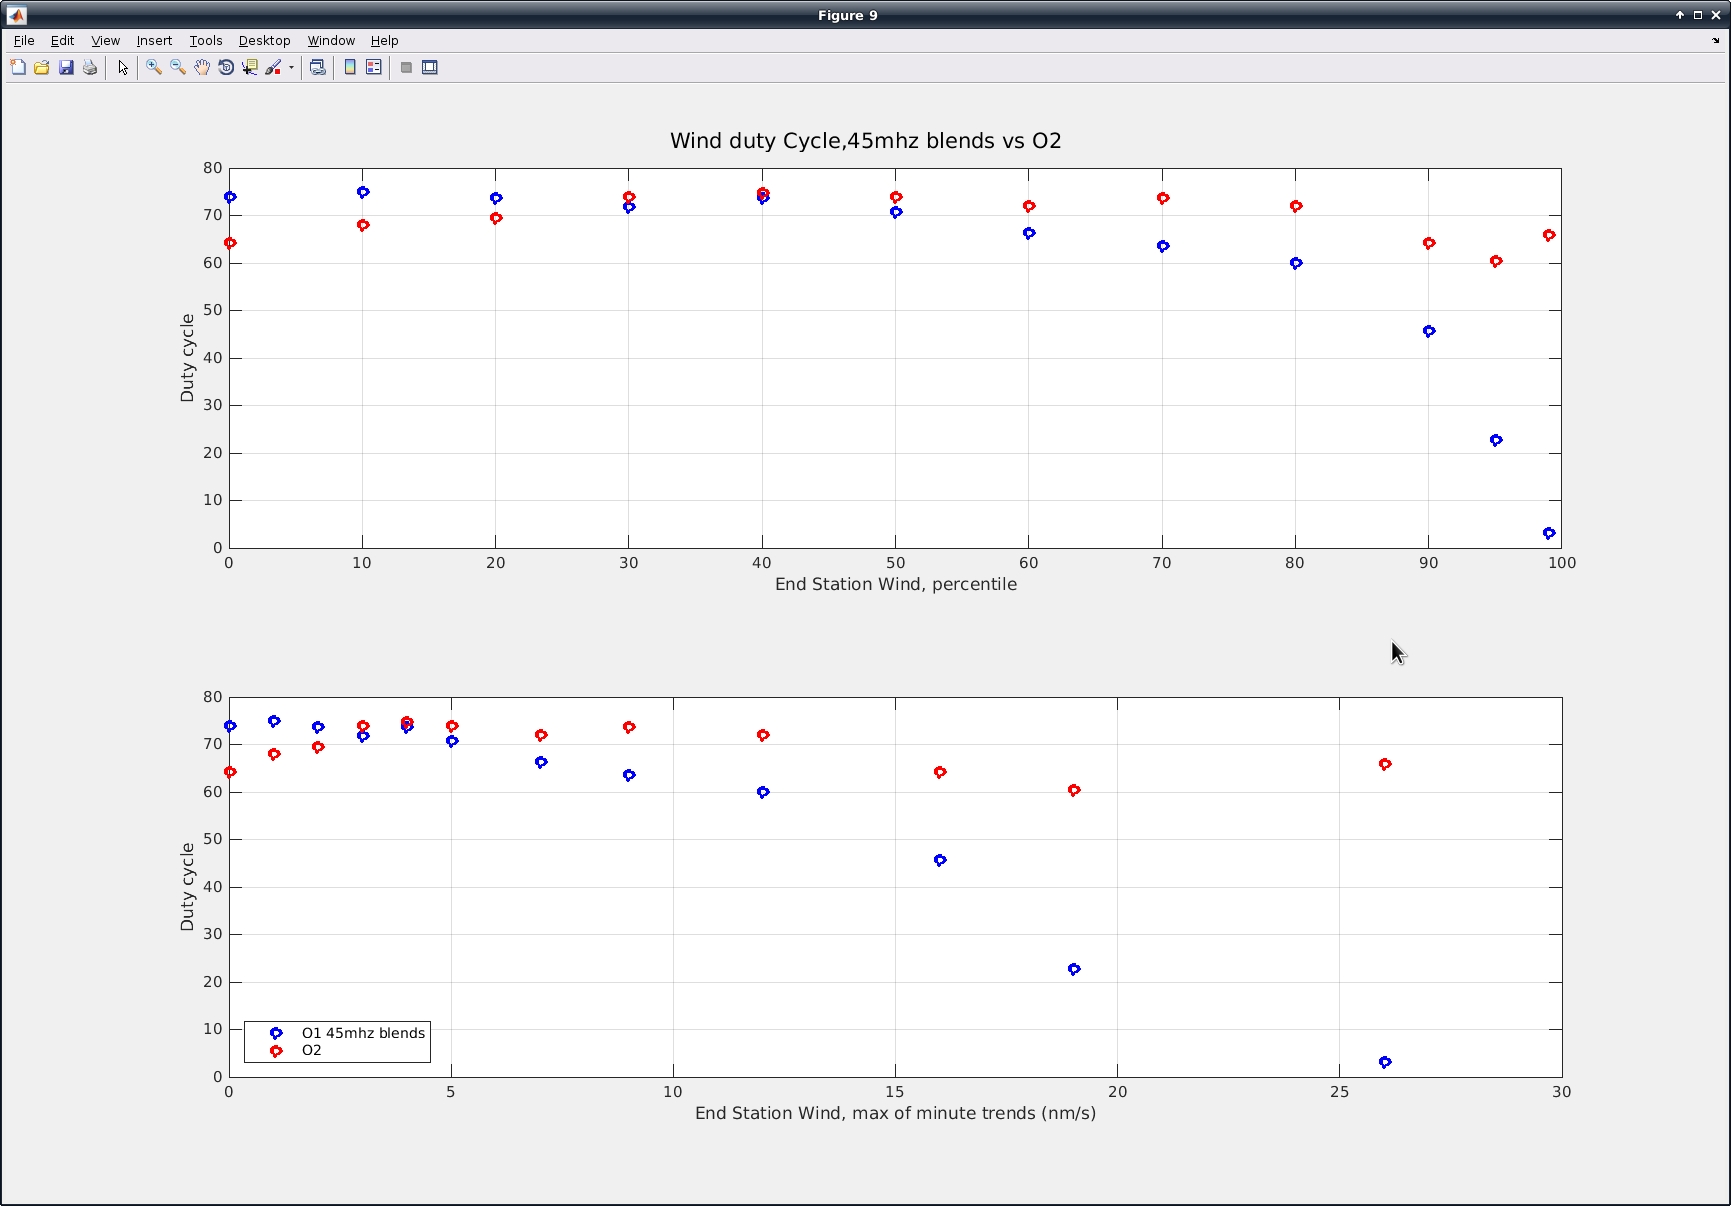
The fourth plot is the wind duty cycle again, but I filtered the O1 data by when we were using 45 mhz blends in the Y direction on the ETMY ISI. We are clearly doing better with respect to wind duty cycle here.