[Vaishali Adya, Sheila Dwyer, Heather Fong]
Objective: To test if any additional lines show up in the DARM spectra barring the calibration lines and the power lines (this was done following the probable improvement in the DARM spectra at Livingston [30655]), and to try to find the source of these additional lines.
Method:
During the commissioning day on Tuesday earlier this week, we identified the different channels that were powered by the 18V or the 24 V power supplies. We unplugged the channels and then replugged them.
The channels that we looked at for EX and EY are listed below (these are power monitors which are on the power strips that power the electrostatic driver):
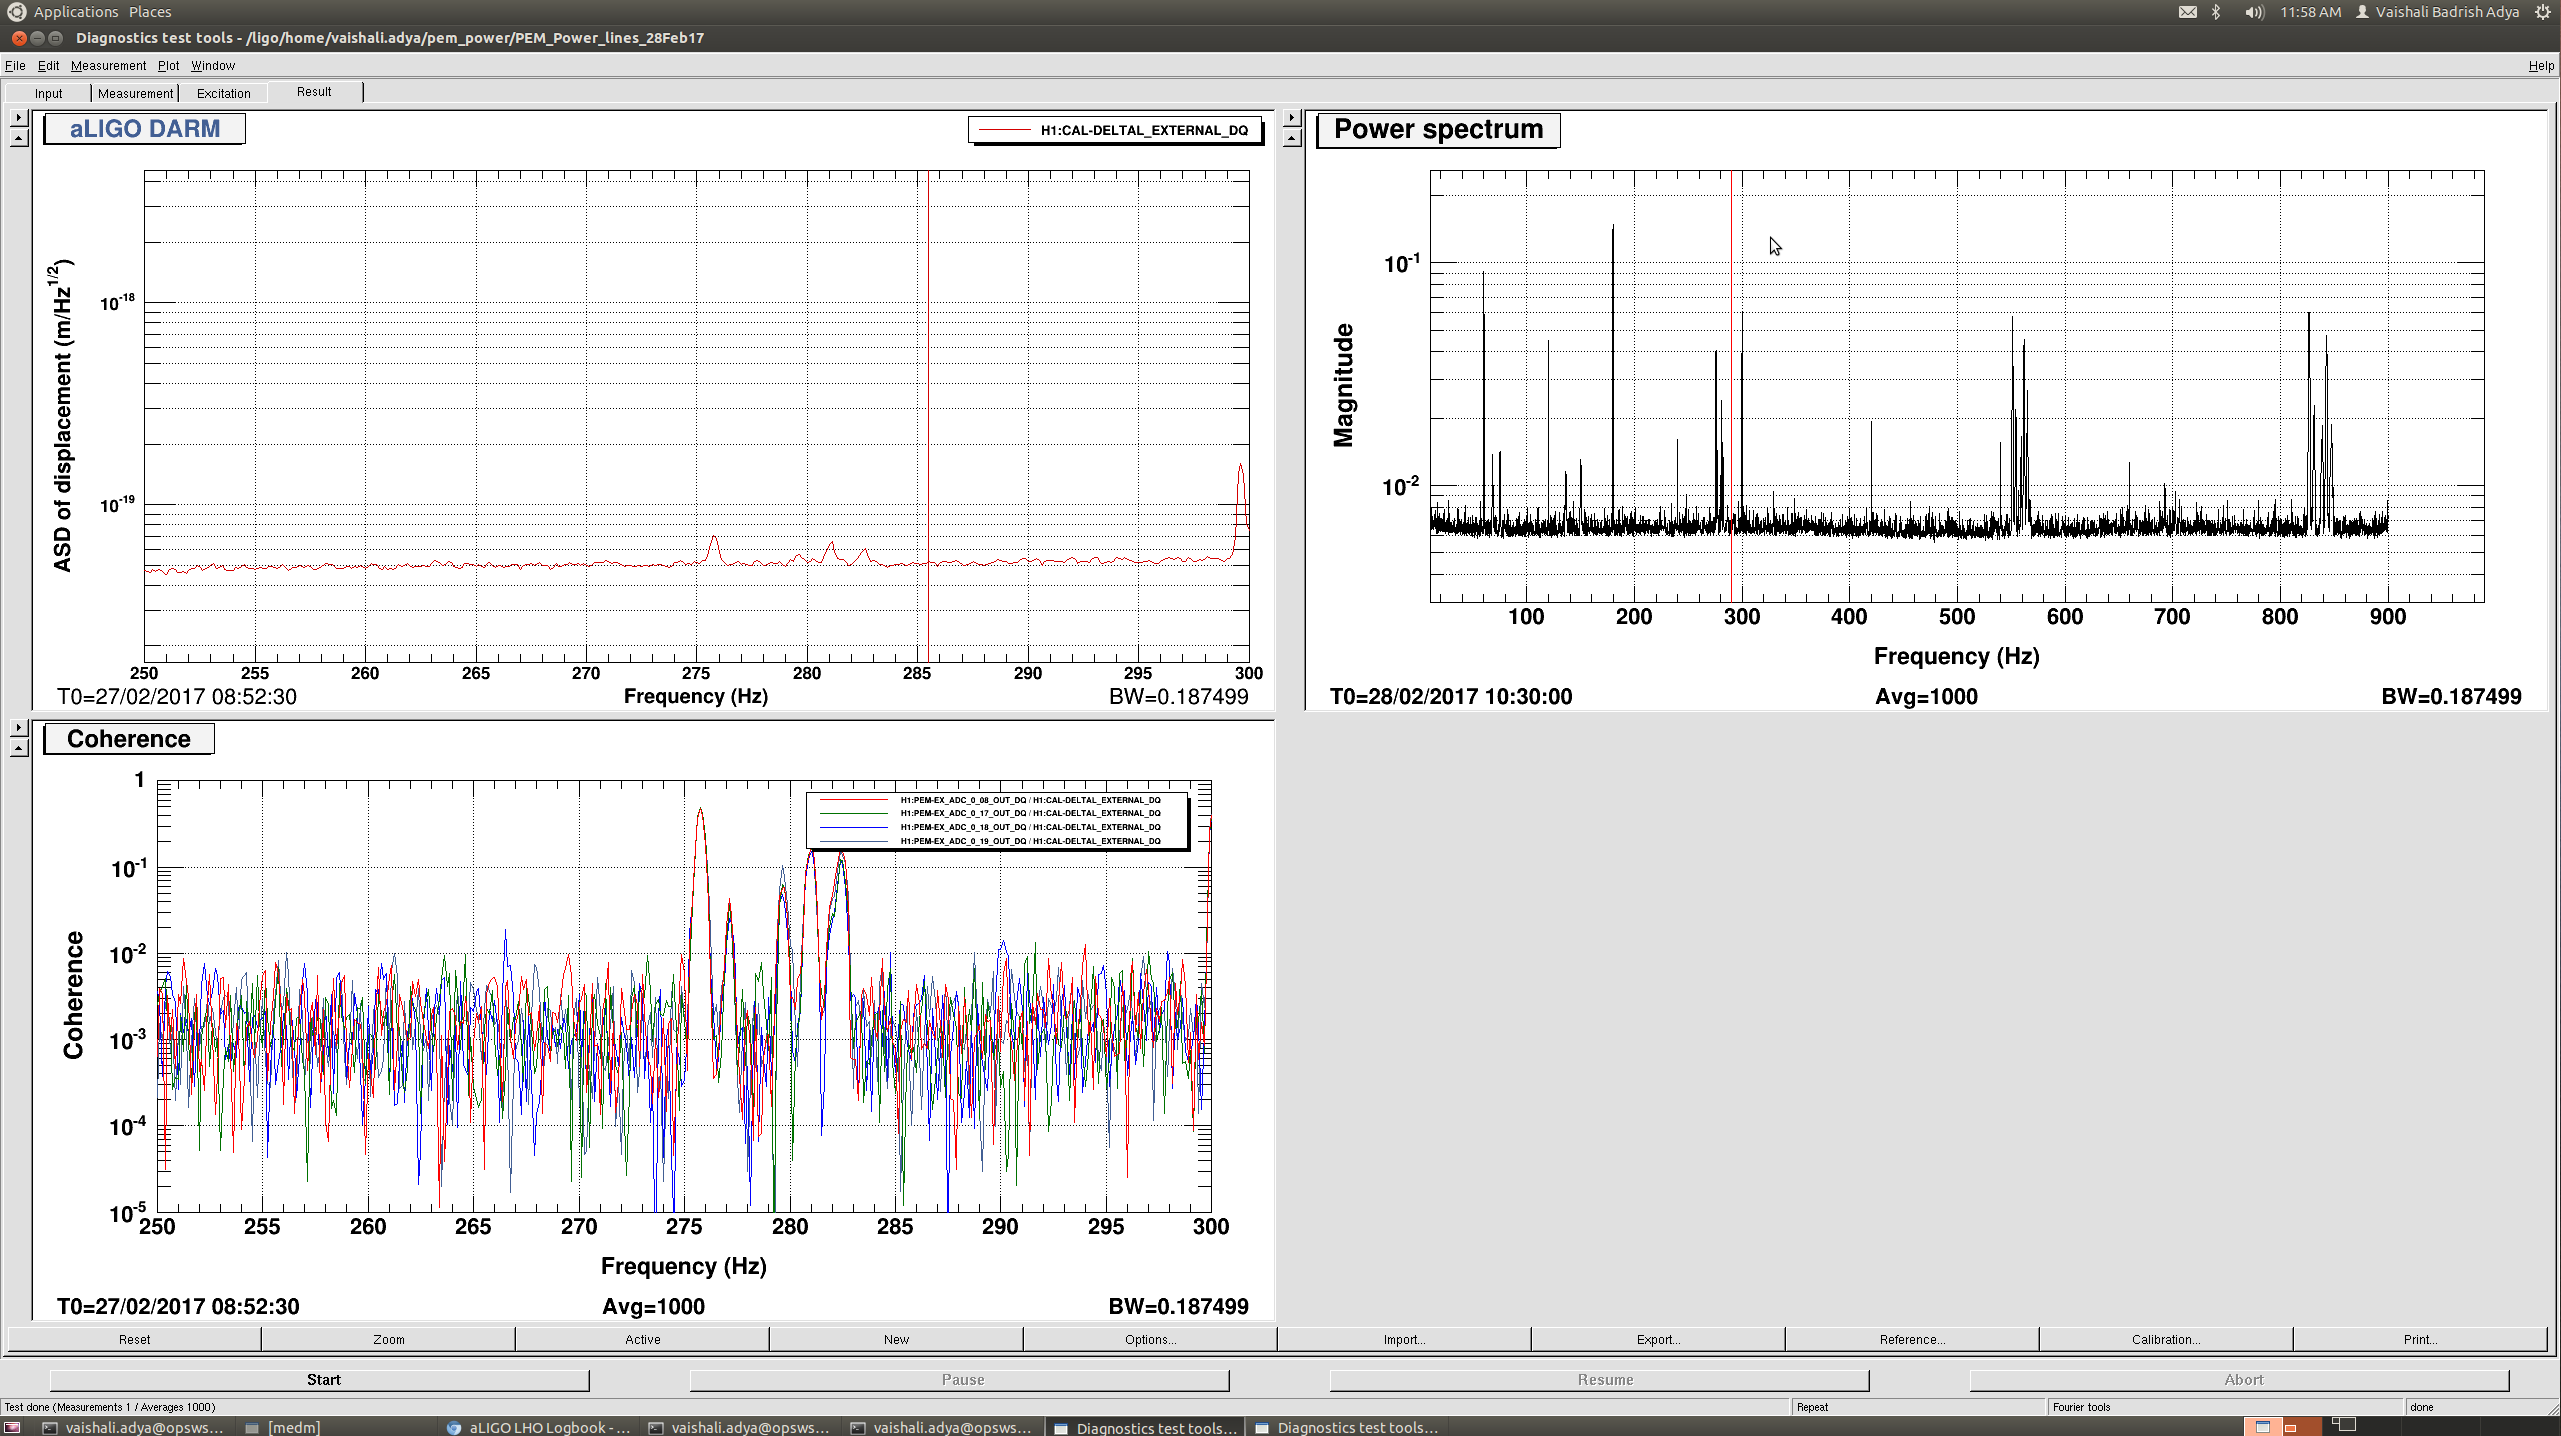
- H1:PEM-EX_ADC_0_17_OUT_DQ (-24V)
- H1:PEM-EX_ADC_0_18_OUT_DQ (+24V)
- H1:PEM-EX_ADC_0_19_OUT_DQ (-17V)
- H1:PEM-EX_ADC_0_08_OUT_DQ (+17V)
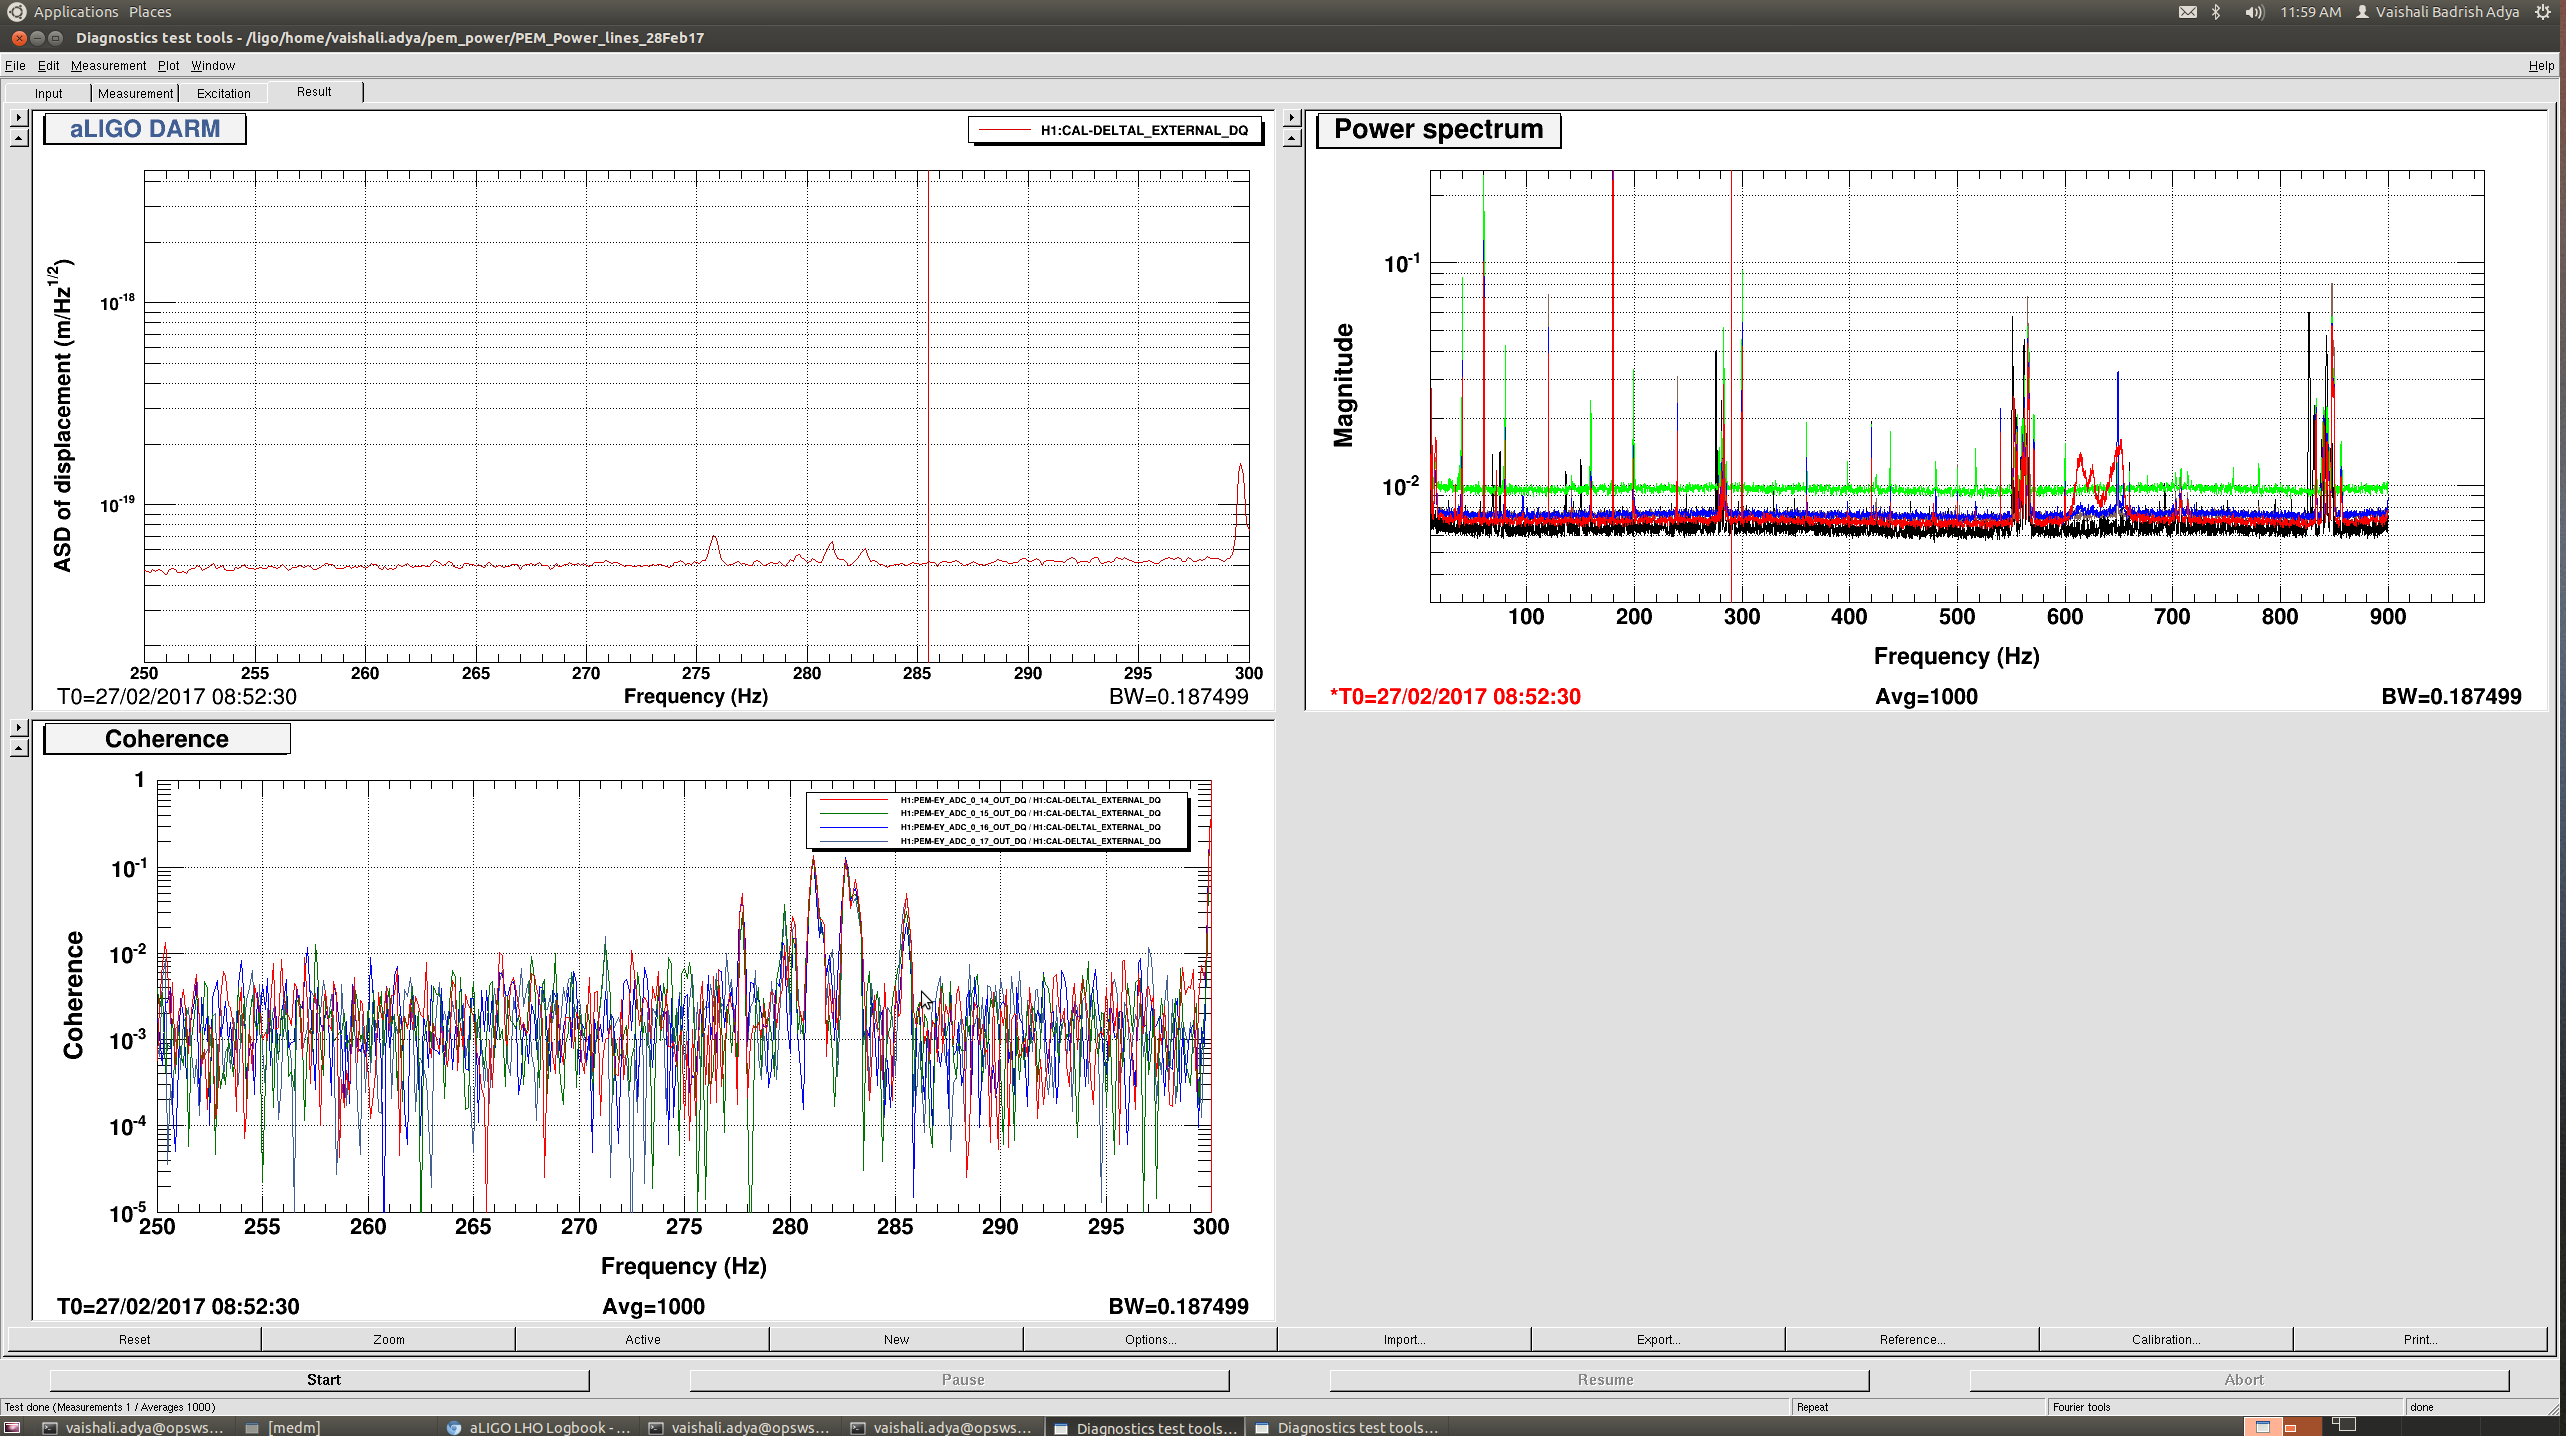
- H1:PEM-EY_ADC_0_14_OUT_DQ (+24V)
- H1:PEM-EY_ADC_0_15_OUT_DQ (-24V)
- H1:PEM-EY_ADC_0_16_OUT_DQ (+17V)
- H1:PEM-EY_ADC_0_17_OUT_DQ (-17V)
Preliminary results:
During our tests, we noticed peaks in the coherence and DARM plots at frequencies 275.5 Hz, 281.1 Hz, and 282.4 Hz; these peaks are seen in the plots for EX (please see attached). For EY, we saw peaks in DARM at frequencies 279.8, 141.4, 281.1, and 285.5 Hz. With the exception of 279.8 Hz, the peaks in EY were present in all channels; only EY channels 14 and 15 showed a peak at a frequency of 279.8 Hz. We also tried unplugging other electronics (PEM power distribution, PCAL camera, DCPD boxes, illuminator) which were plugged into the power strips, but we did not observe any changes in the power monitor. We would like to go back to the end stations and try unplugging the rest of the electronics to monitor changes in the power monitor.