A major question for the H1 interferometer is whether one of our arm cavities has anomalously high absorption. To look into this, Aidan asked me to run mode scans of the arm cavities immediately after lockloss, so that we can watch the frequency separation of the higher order modes change as the interferometer cools down. Prep work for this was done during last week's commissioning window (alog 34512), following the technique that Kiwamu used in 2014 (LLO alog 13768).
Prior to breaking the lock, Sheila and I went to the LVEA and bypassed the /10 frequency difference divider in the ALS COMM electronics chain, such that I can scan several FSR.
Travis got us back to ALS locked about 3.5 minutes after I broke the 9.5 hour lock, and the scan was started immediately after that. After the first scan or two, I remembered to slightly misalign the IR beam into the cavities, which I did by moving PR3 0.8urad in pitch (which was enough that I started seeing the TEM10 mode in the arm cavity transmission powers).
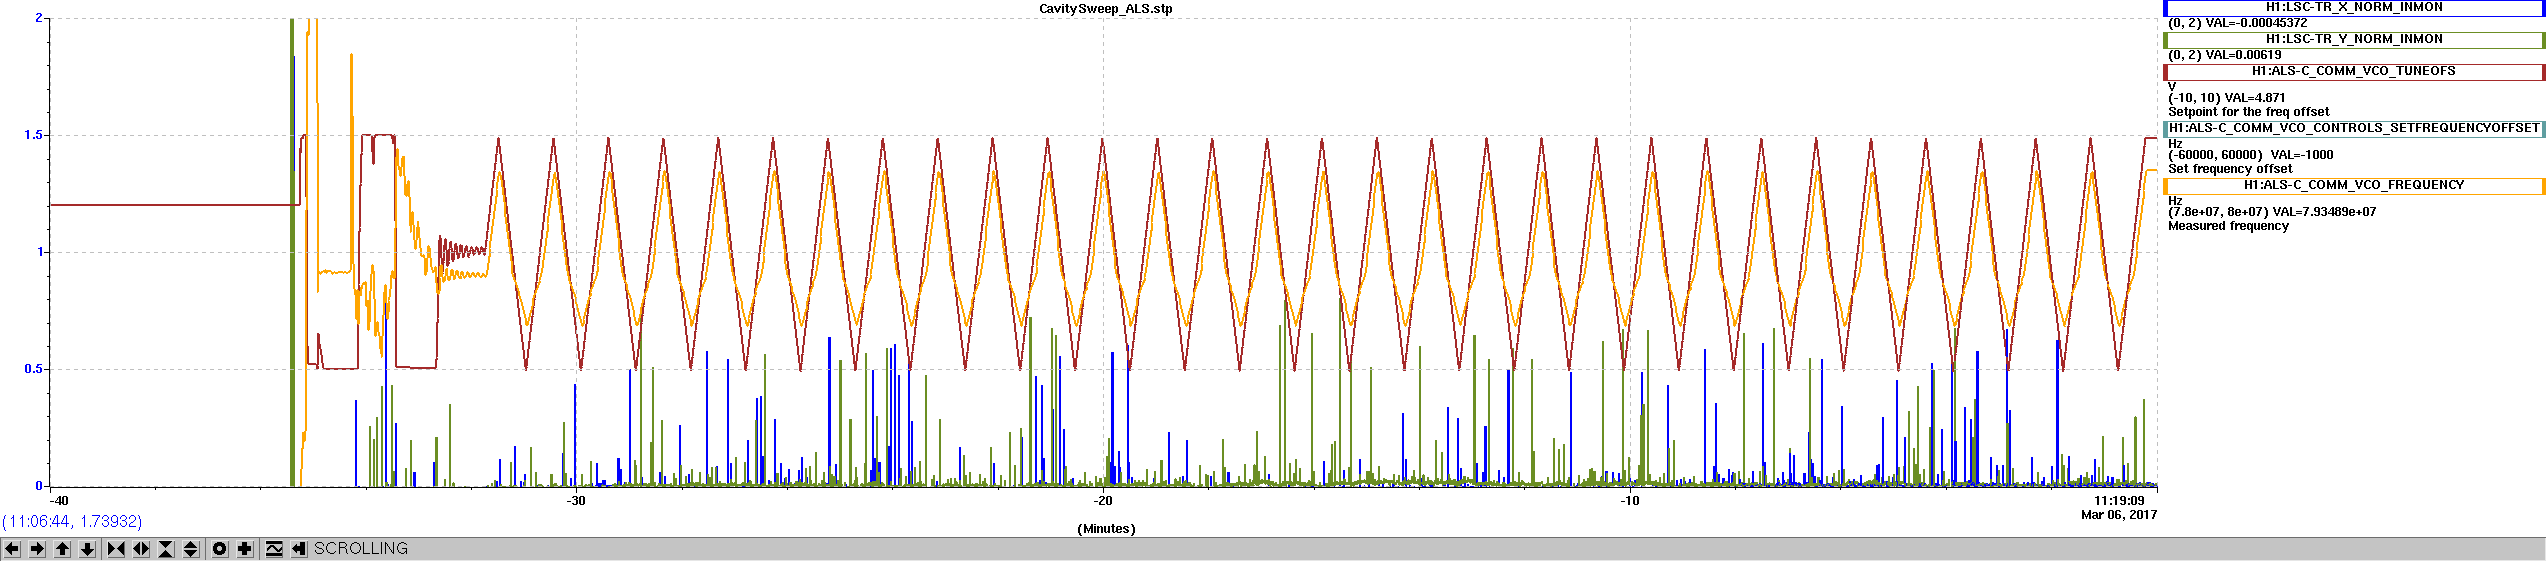
The scan ran for 30 minutes.
I put the FDD back in place, and Travis is now re-locking the IFO. The attached screenshot shows my striptool of the sweeps, mostly just that indeed it went on for about 30min.
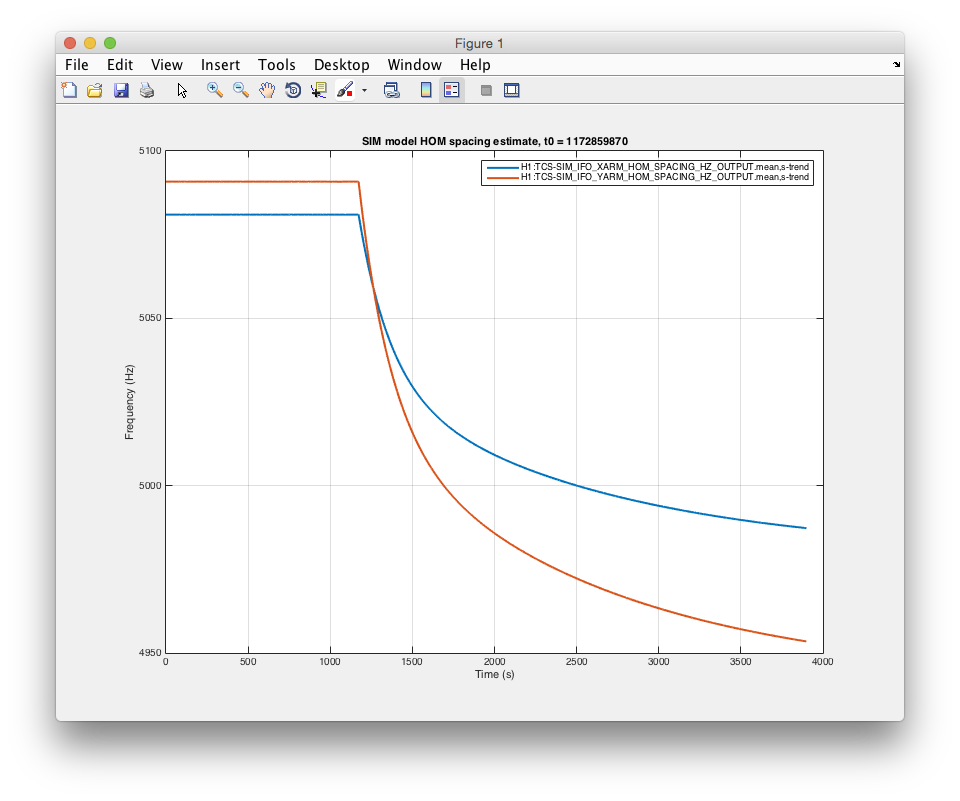
The HOM spacing change over 30 minutes (t=[1200s, 3000s] in the attached plot) estimated by the online SIM model is approximately 90Hz for the XARM and 125Hz for the Y-ARM. This assumes:
| Optic | Absorption (ppb) |
| ITMX | 210 ppb |
| ITMY | 280 ppb |
| ETMX | 160 ppb |
| ETMY | 250 ppb |
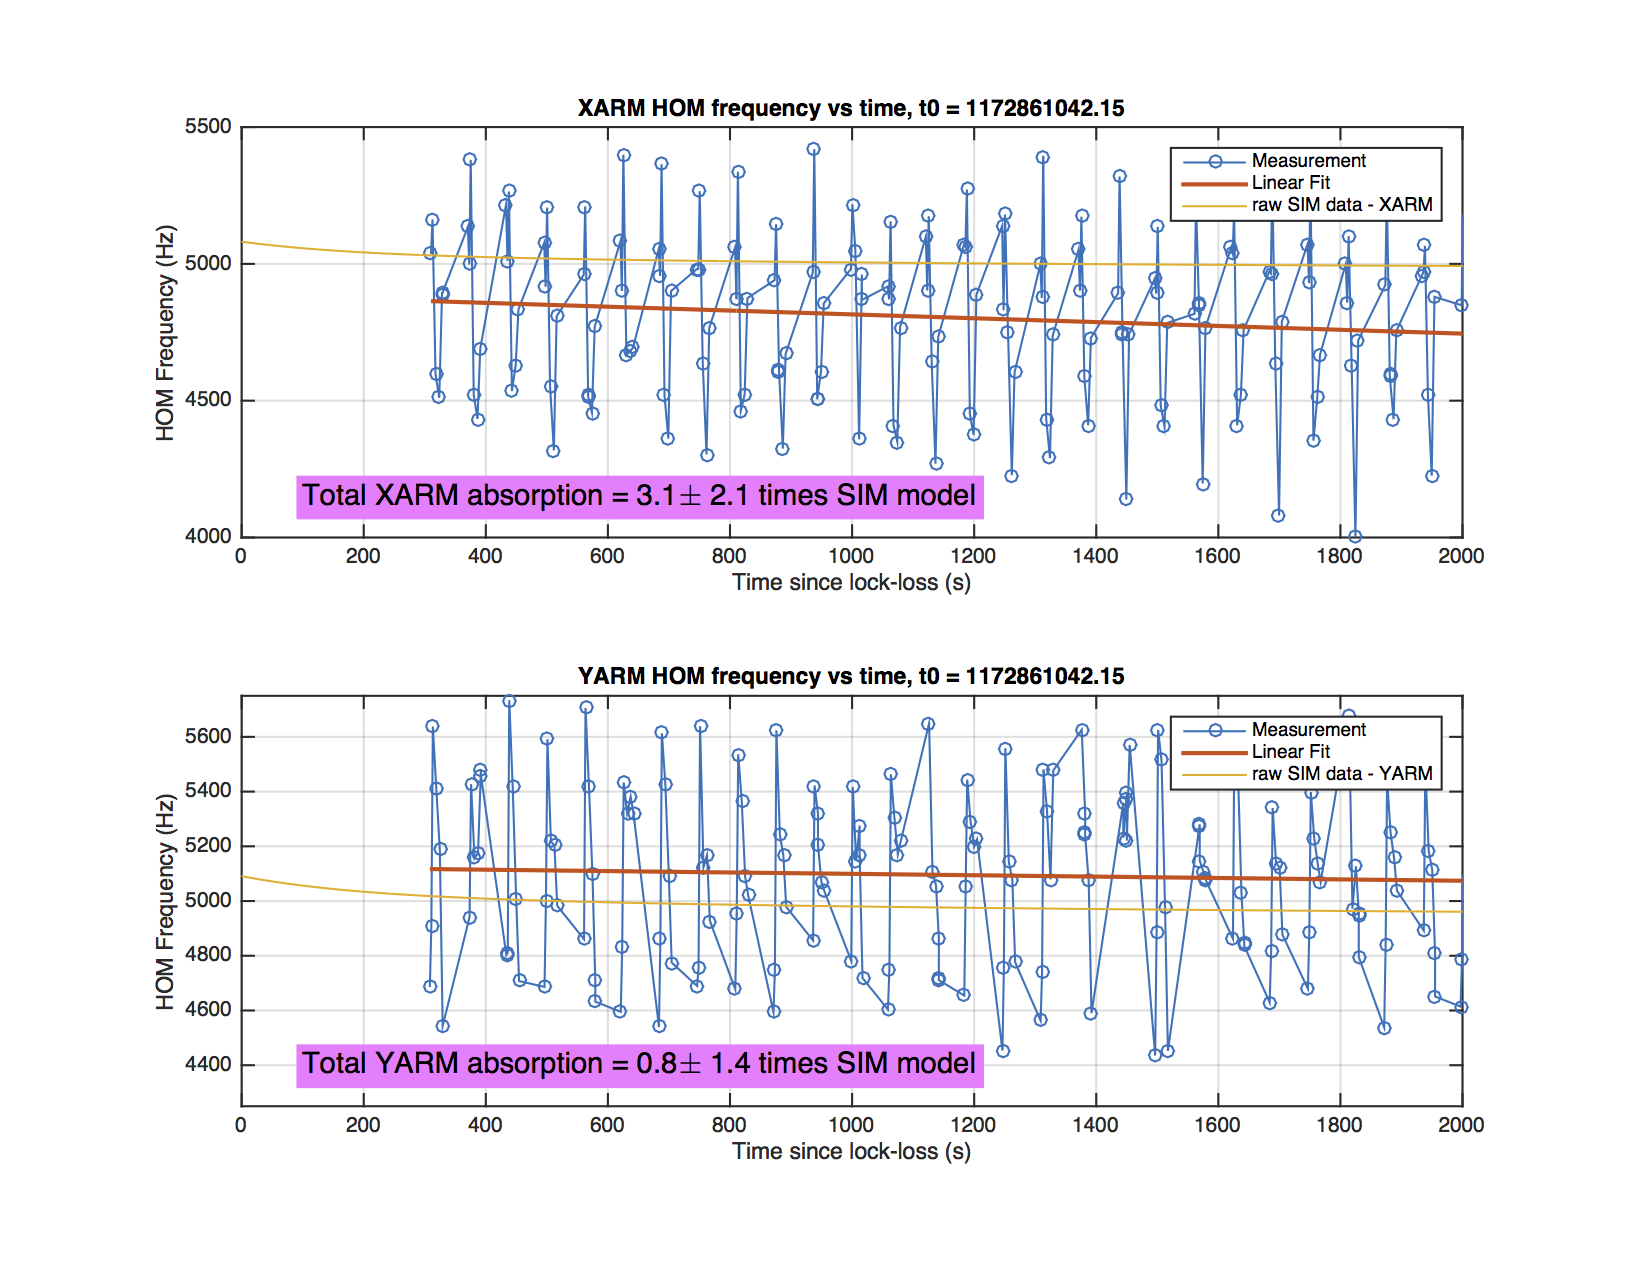
I analyzed the data from the cavity scan measurements. There's a lot of noise in the data (partly from ALS COMM frequency noise) and I need to do a proper estimate of the best measurement we could expect to get.
In spite of the noisy data, we see a distinct downward trend on the XARM HOM spacing that is larger than the YARM downward trend. I did a linear fit to the data to estimate the change in frequency over time (from t = 310s to t = 2000s) and compared that to the change in frequency expected from the SIM model. The results are:
- XARM: 3.1 +/- 2.1 times the expected frequency change from the SIM model (we observe a decrease of 120Hz from t = 310s to t=2000s)
- YARM: 0.8 +/- 1.4 times the expected frequency change from the SIM model (we observe a decrease of 43Hz from t = 310s to t=2000s)
Based on the standard error of this measurement, we expect that the total absorption in the XARM could be anywhere from 1x to 5.2x the total absorption expected in the SIM model. The YARM could be anywhere from 0x to 2.2x the total absorption in the SIM model (it can't be negative).
Obviously I need to repeat this measurement taking care to get the best precision possible.