With a nudge from peterF and mevans, I checked to see how hard it might be to do some time-domain subtraction of the jitter in H1 DARM. This is similar to what Sheila (alog 34223) and Keita (alog 33650) have done, but now it's in the time domain so that we could actually clean up DARM before sending it to our analysis pipelines.
The punchline: It's pretty easy. I got pretty good feedforward subtraction (close to matching what Sheila and Keita got with freq-domain subtraction) without too much effort.
Next steps: See if the filters are good for times other than the training time, or if they must be re-calculated often (tomorrow). Implement in GDS before the data goes to the analysis pipelines (farther future?).
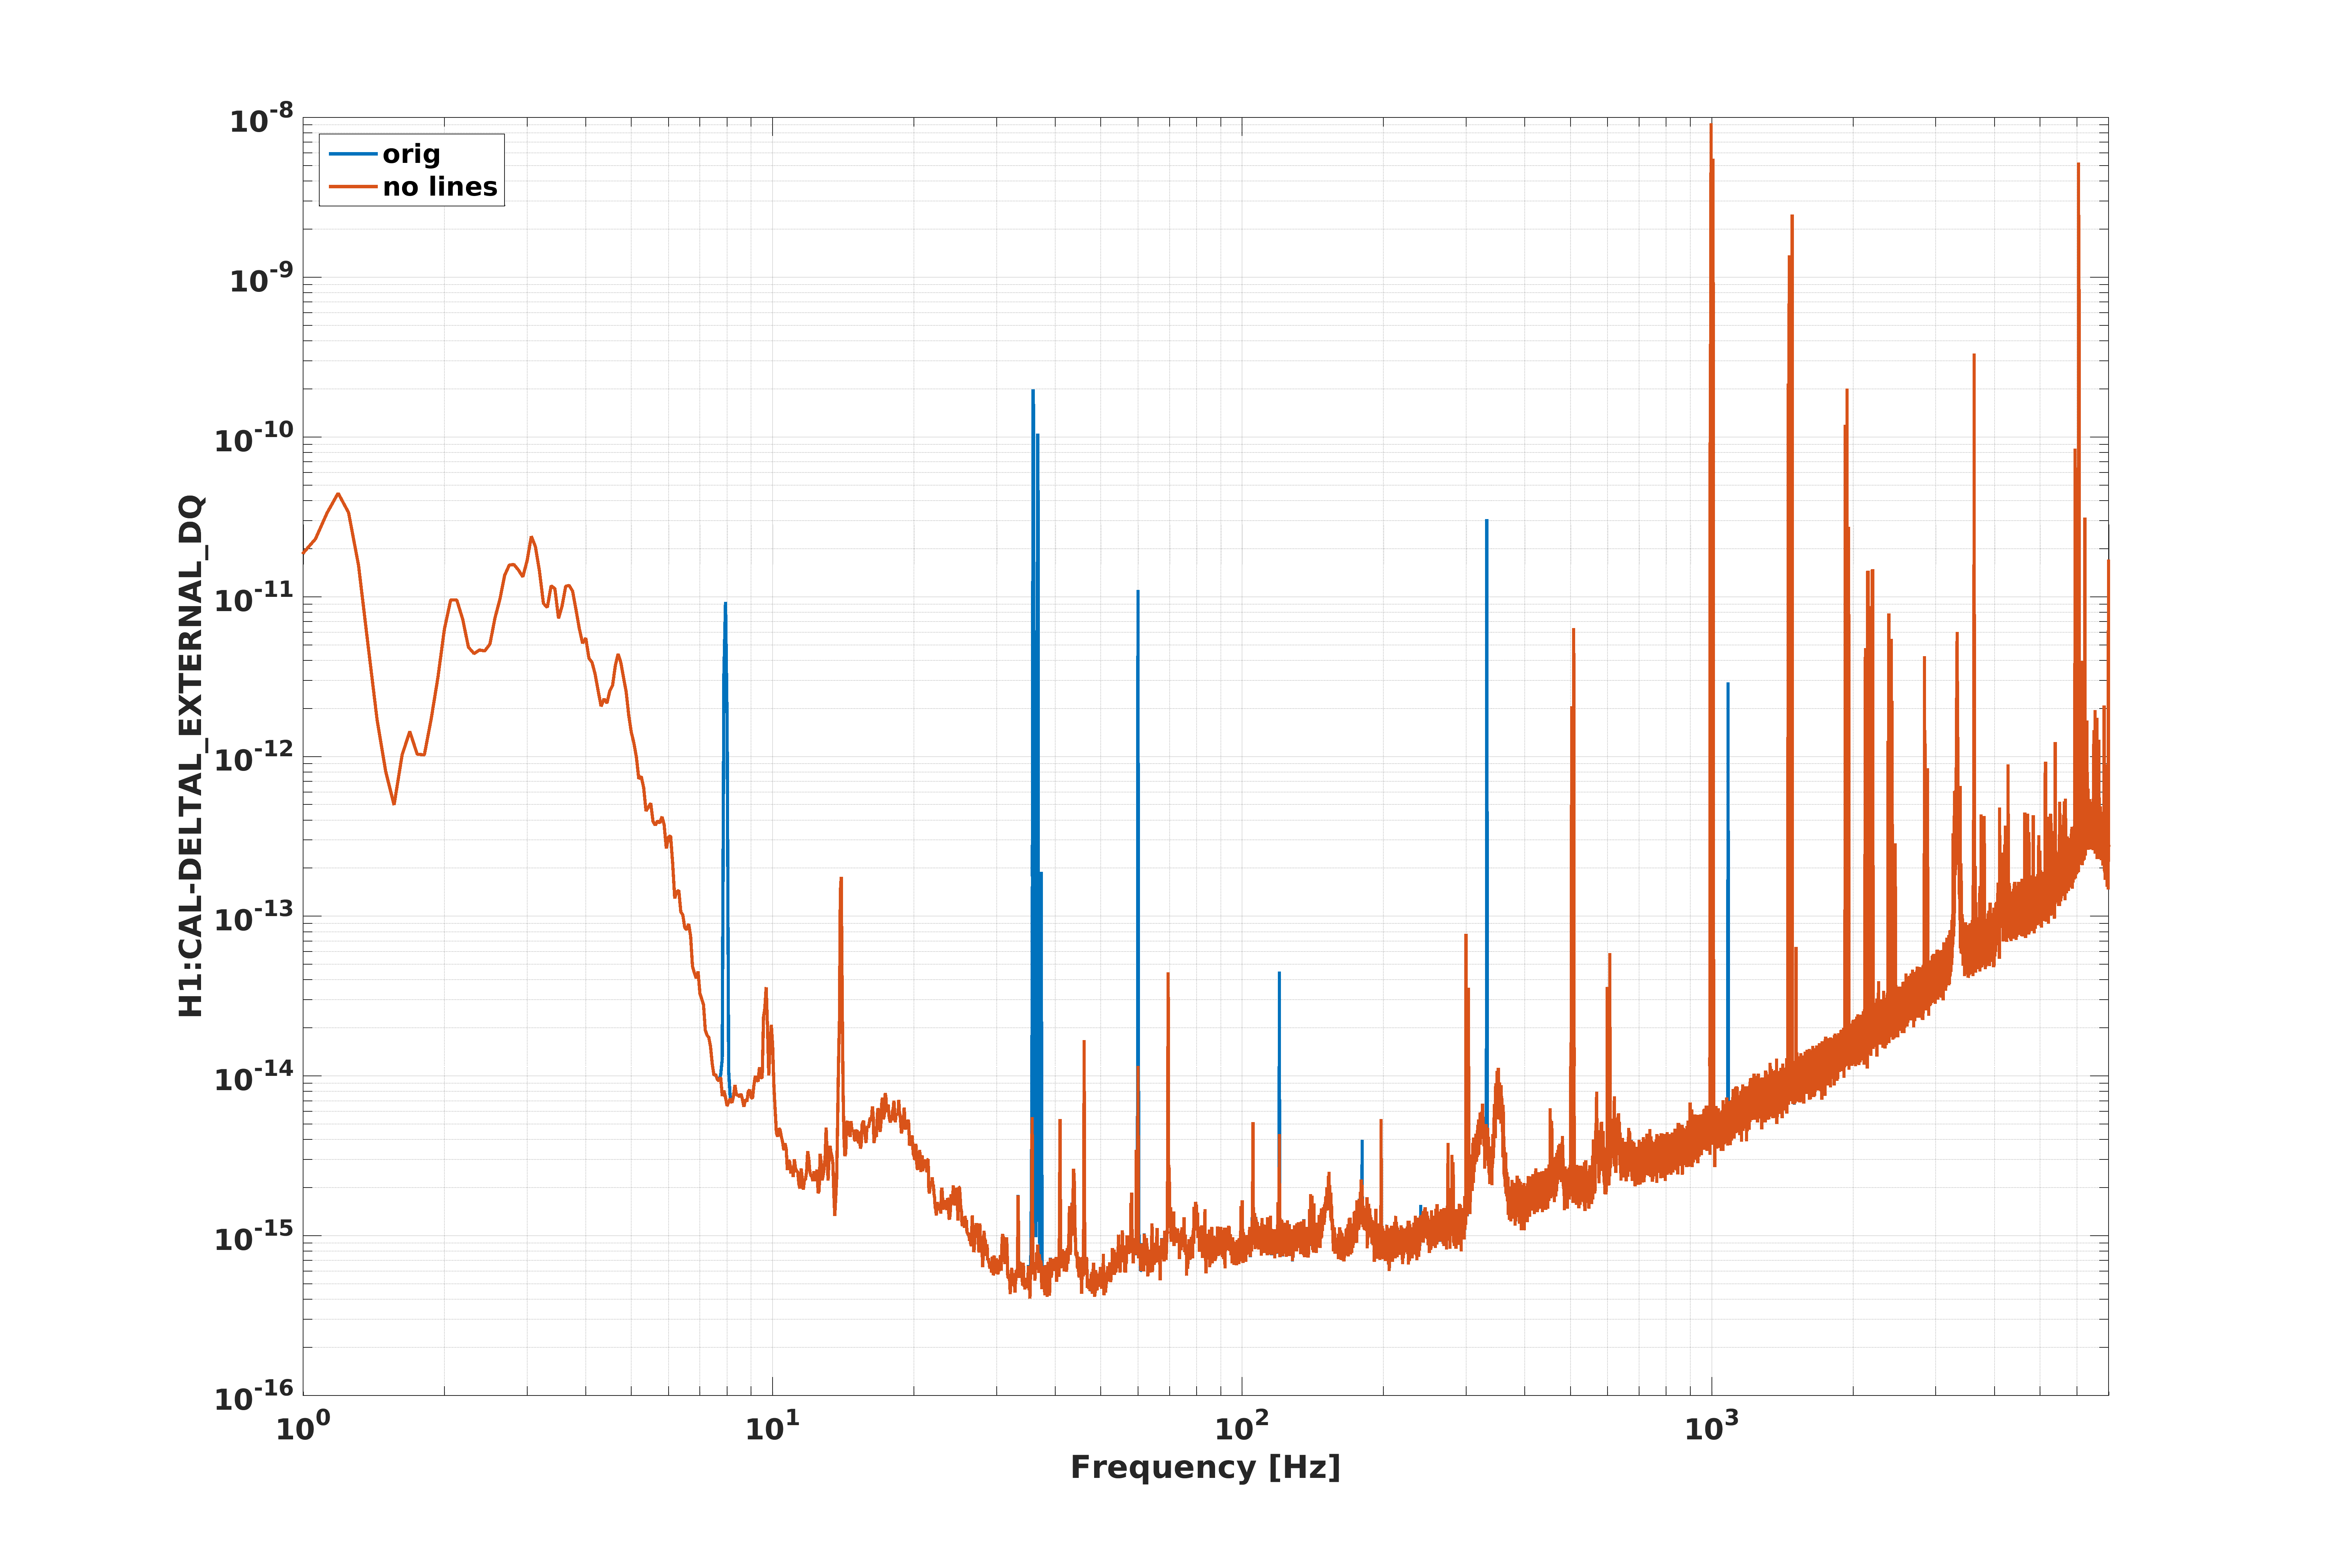
I was finding it difficult to calculate effective Wiener filters with so many lines in the data, since the Wiener filter calculation is just minimizing the RMS of the residual between a desired channel (eg. DARM) and a witness (eg. IMC WFS for jitter). So, I first removed the calibration lines and most of the 60Hz line. See the first attached figure for the difference between the original DARM spectrum and my line-subtracted DARM spectrum. This is "raw" CAL-DELTAL_EXTERNAL, so the y-axis is not in true meters.
I did not need to use any emphasis filters to reshape DARM or the witnesses for the line removal portion of this work. The lines are so clear in these witnesses that they don't need any help. I calculated the Wiener filters for each of the following channels separately, and calculated their estimated contribution to DARM individually, then subtracted all of them at once. H1:CAL-PCALY_EXC_SUM_DQ has information about the 7Hz line, the middle line in the 36Hz group, the 332Hz line and the 1080Hz line. H1:LSC-CAL_LINE_SUM_DQ has information about the highest frequency line in the 36Hz group. Both of those are saved at 16kHz, so required no extra signal processing. I used H1:SUS-ETMY_L3_CAL_LINE_OUT_DQ for the lowest frequency of the 36Hz group, and H1:PEM-CS_MAINSMON_EBAY_1_DQ for the 60Hz power lines. Both of these channels are saved slower (ETMY cal at 512Hz and MainsMon at 1kHz), but since they are very clean signals, I felt comfortable interpolating them up to 16kHz. So, these channels were interpolated using Matlab's spline function before calculating their Wiener filters. Robert or Anamaria may have thoughts on this, but I only used one power line monitor, and only at the corner station for the 60Hz line witness. I need to re-look at Anamaria's eLIGO 60Hz paper to see what the magical combination of witnesses was back then.
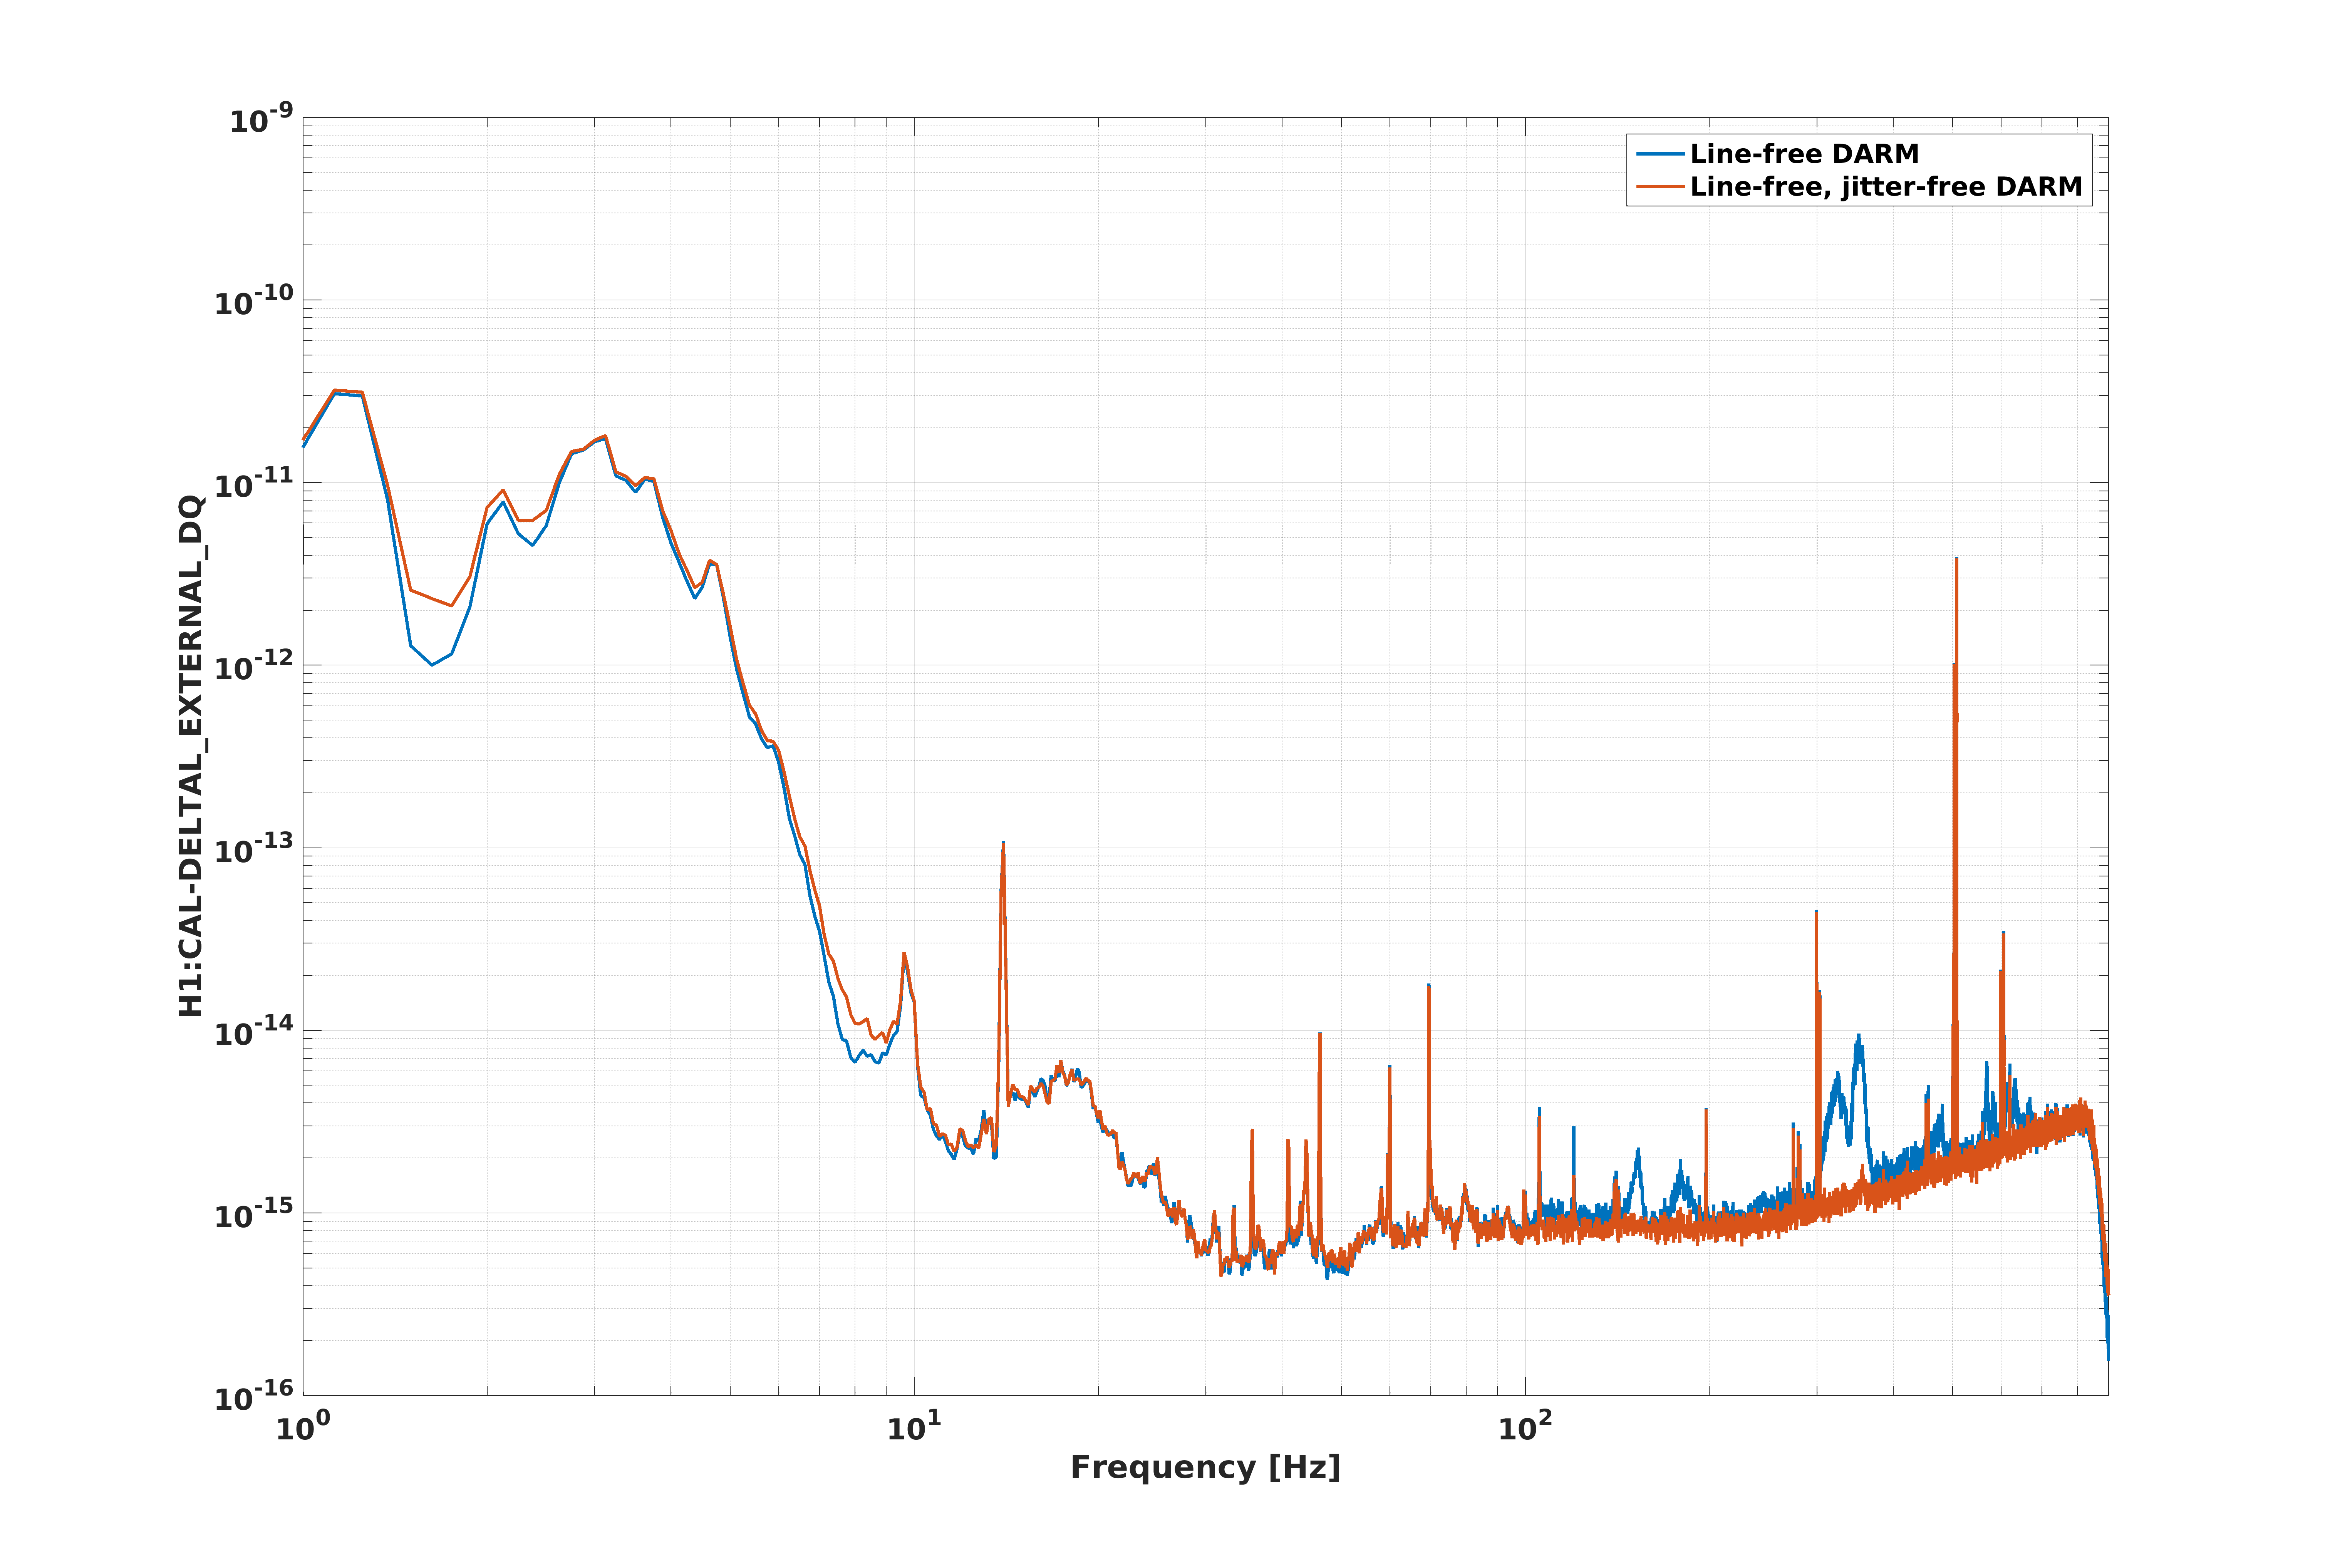
Once I removed the calibration lines, I roughly whitened the DARM spectrum, and calculated filters for IMC WFS A and B, pit and yaw, as well as all 3 bullseye degrees of freedom. Unfortunately, these are only saved at 2kHz, so I first had to downsample DARM. If we really want to use offline data to do this kind of subtraction, we may need to save these channels at higher data rates. See the second attached figure for the difference between the line-cleaned DARM and the line-and-jitter-cleaned DARM spectrum. You can see that I'm injecting a teeny bit of noise in, below 9Hz. I haven't tried adjusting my emphasis filter (so far just roughly whitening DARM) to minimize this, so it's possible that this can be avoided. It's interesting to note that the IMC WFS get much of the jitter noise removed around these broad peaks, but it requires the inclusion of the bullseye detector channels to really get the whole jitter floor down.
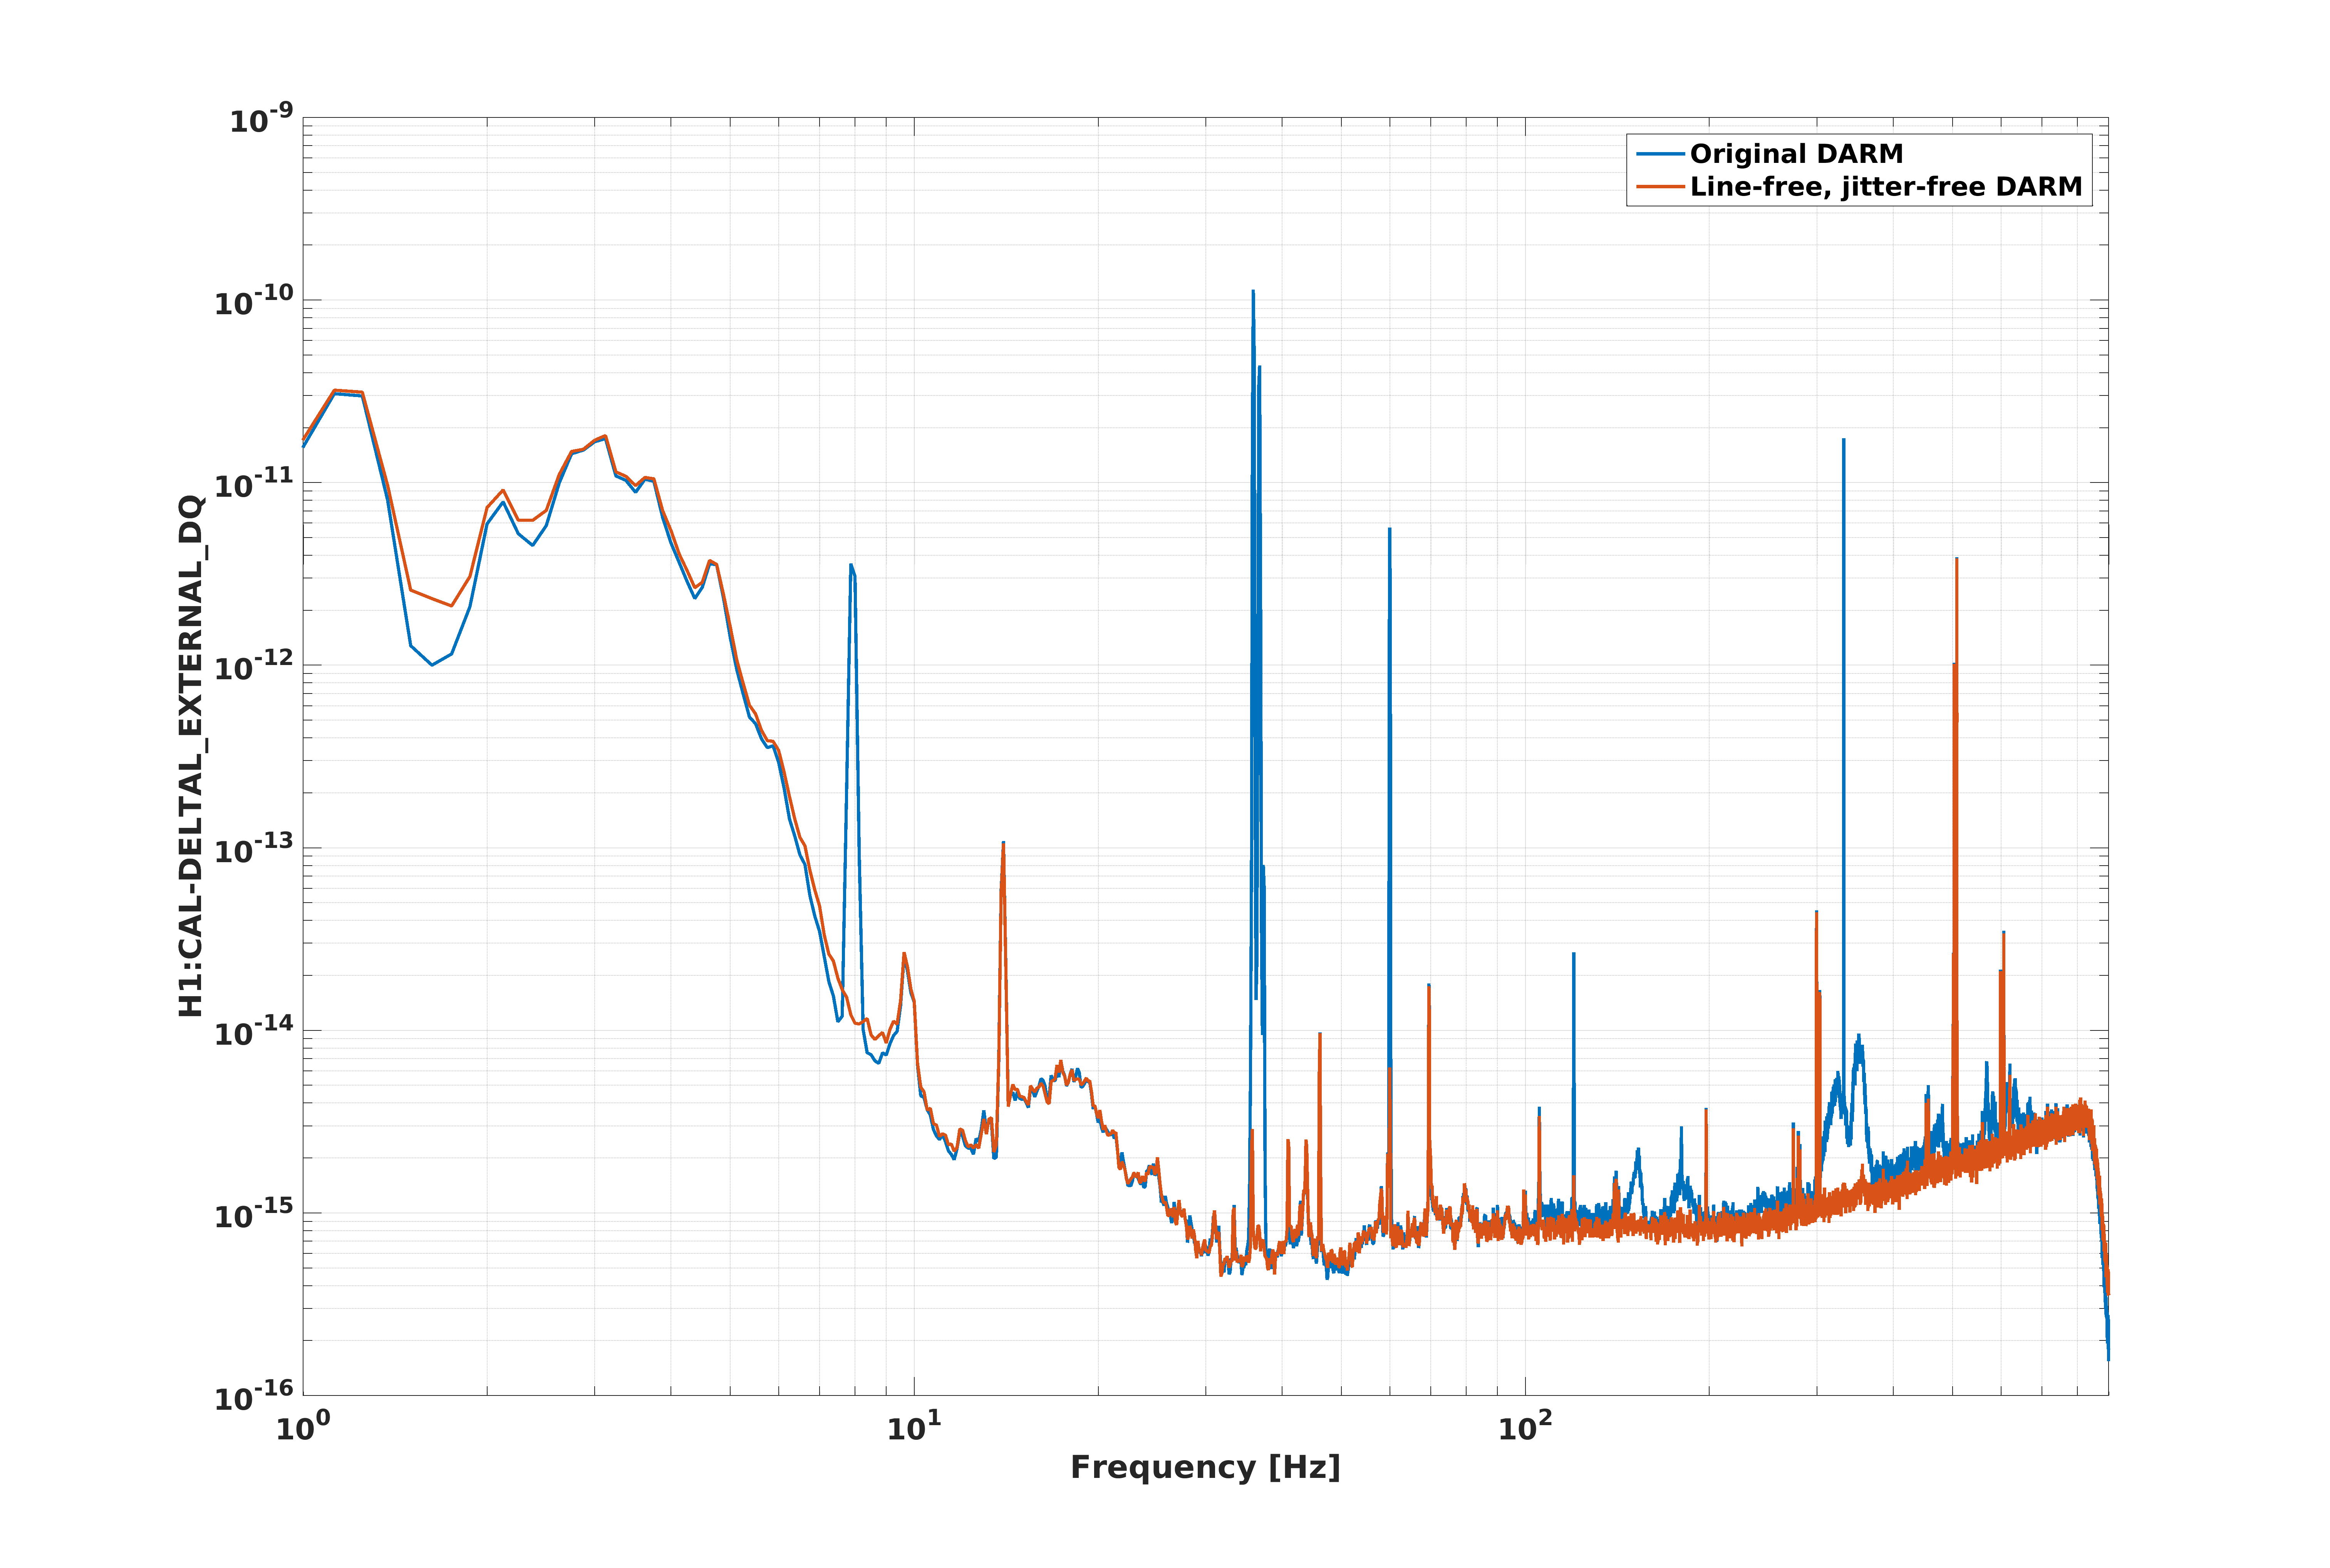
Just because it's even more striking when it's all put together, see the third attachment for the difference between the original DARM spectrum and the line-and-jitter-cleaned DARM spectrum.
It might be worth pushing the cleaned data through the offline PyCBC search and seeing what difference it makes. How hard would it be to make a week of cleaned data? We could repeat e.g. https://sugwg-jobs.phy.syr.edu/~derek.davis/cbc/O2/analysis-6/o2-analysis-6-c00-run5/ using the cleaned h(t) and see what the effect on range and glitches are. The data could be made offline, so as long as you can put h(t) in a frame (which we can help with) there's no need to get it in GDS to do this test.
Do you think it would be possible to post the spectrums as ascii files? It would be interesting to get a very rough estimate of the inspiral range difference.
In fact, I'm working on a visualization of this for a comparison between C00 and C01 calibration versions. See an example summary page here:
https://ldas-jobs.ligo.caltech.edu/~alexander.urban/O2/calibration/C00_vs_C01/L1/day/20161130/range/
I agree with Other Alex and I'd like to add your jitter-free spectrum to these plots. If possible, we should all get together at the LVC meeting next week and discuss.