jim.warner@LIGO.ORG - posted 08:20, Wednesday 22 March 2017 - last comment - 12:06, Wednesday 22 March 2017(34999)
ASC got noisy this morning, looks like quad longitudinal modes?
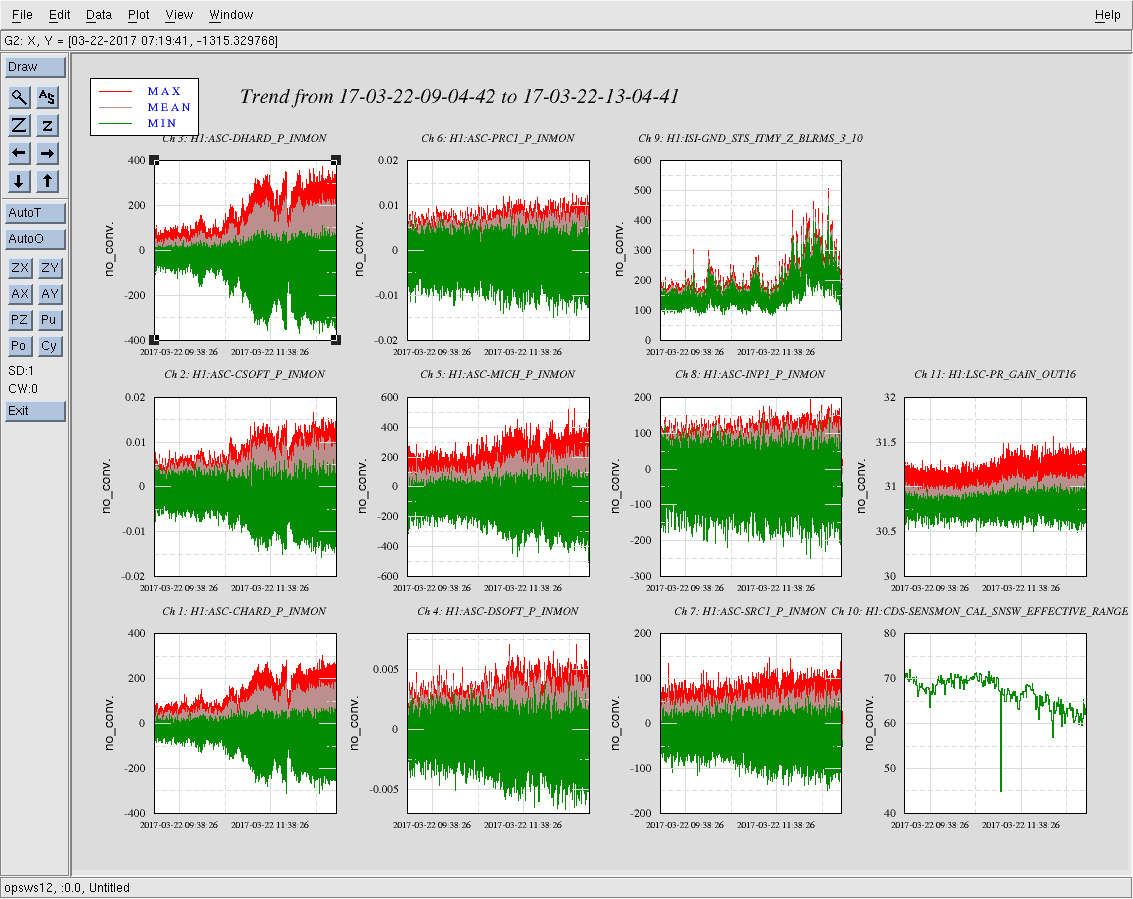
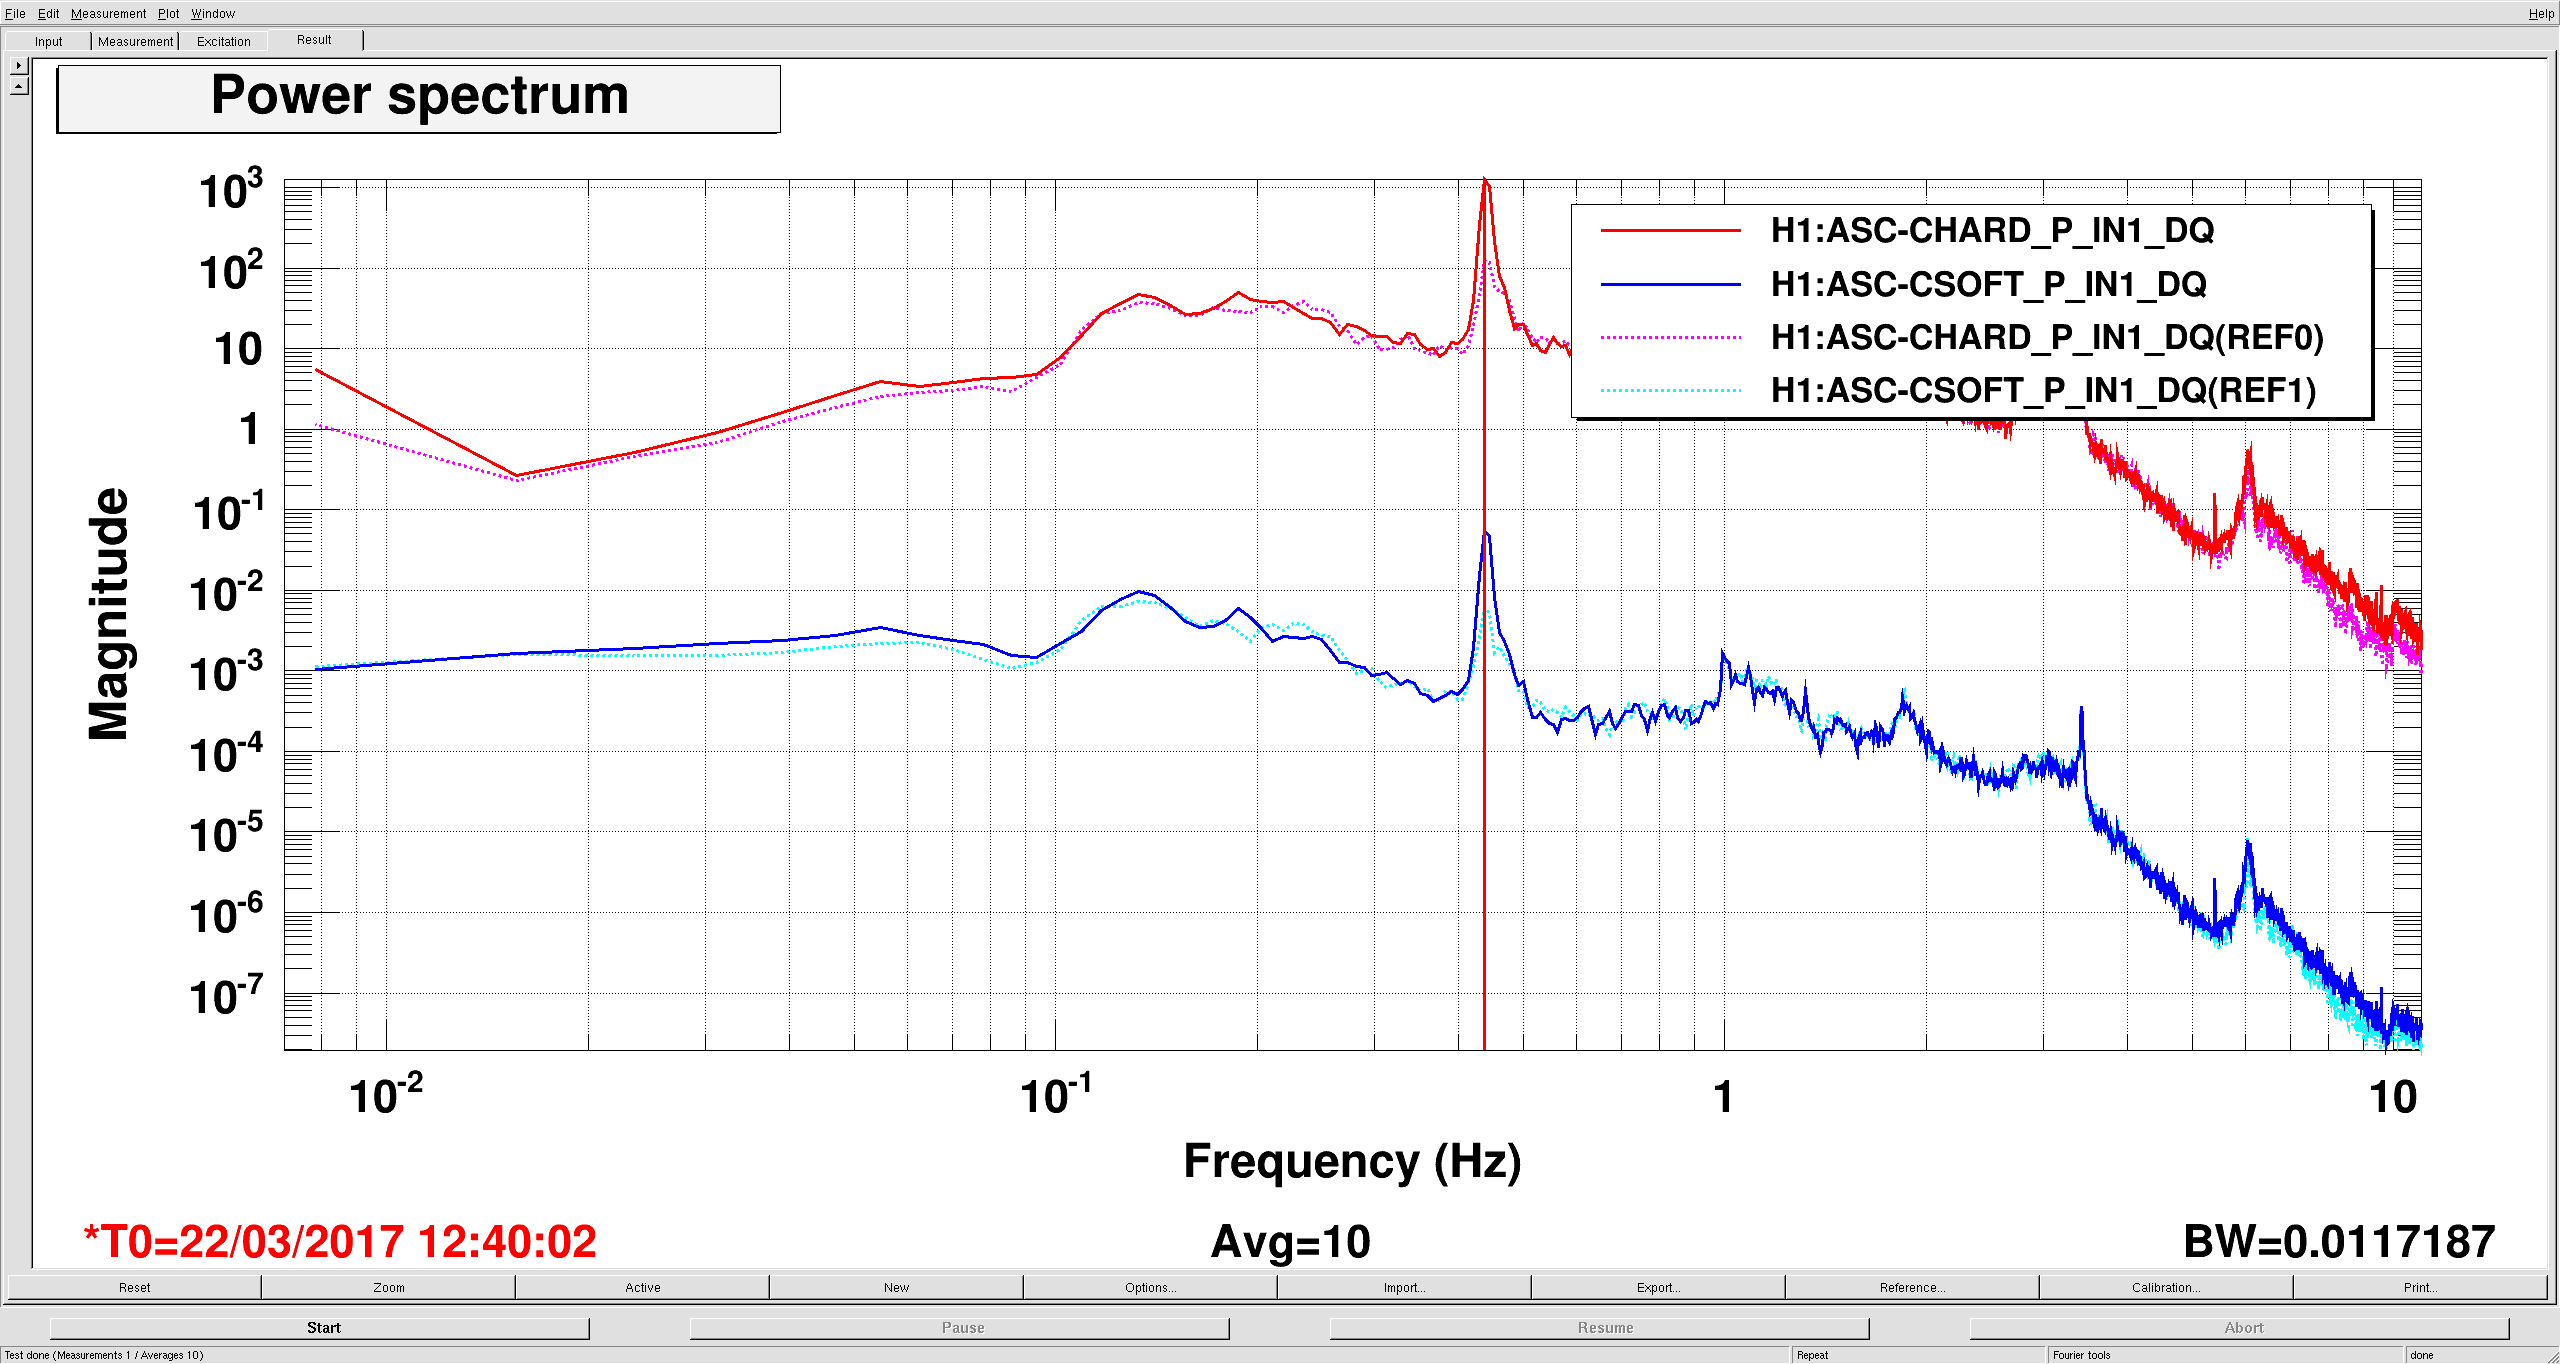
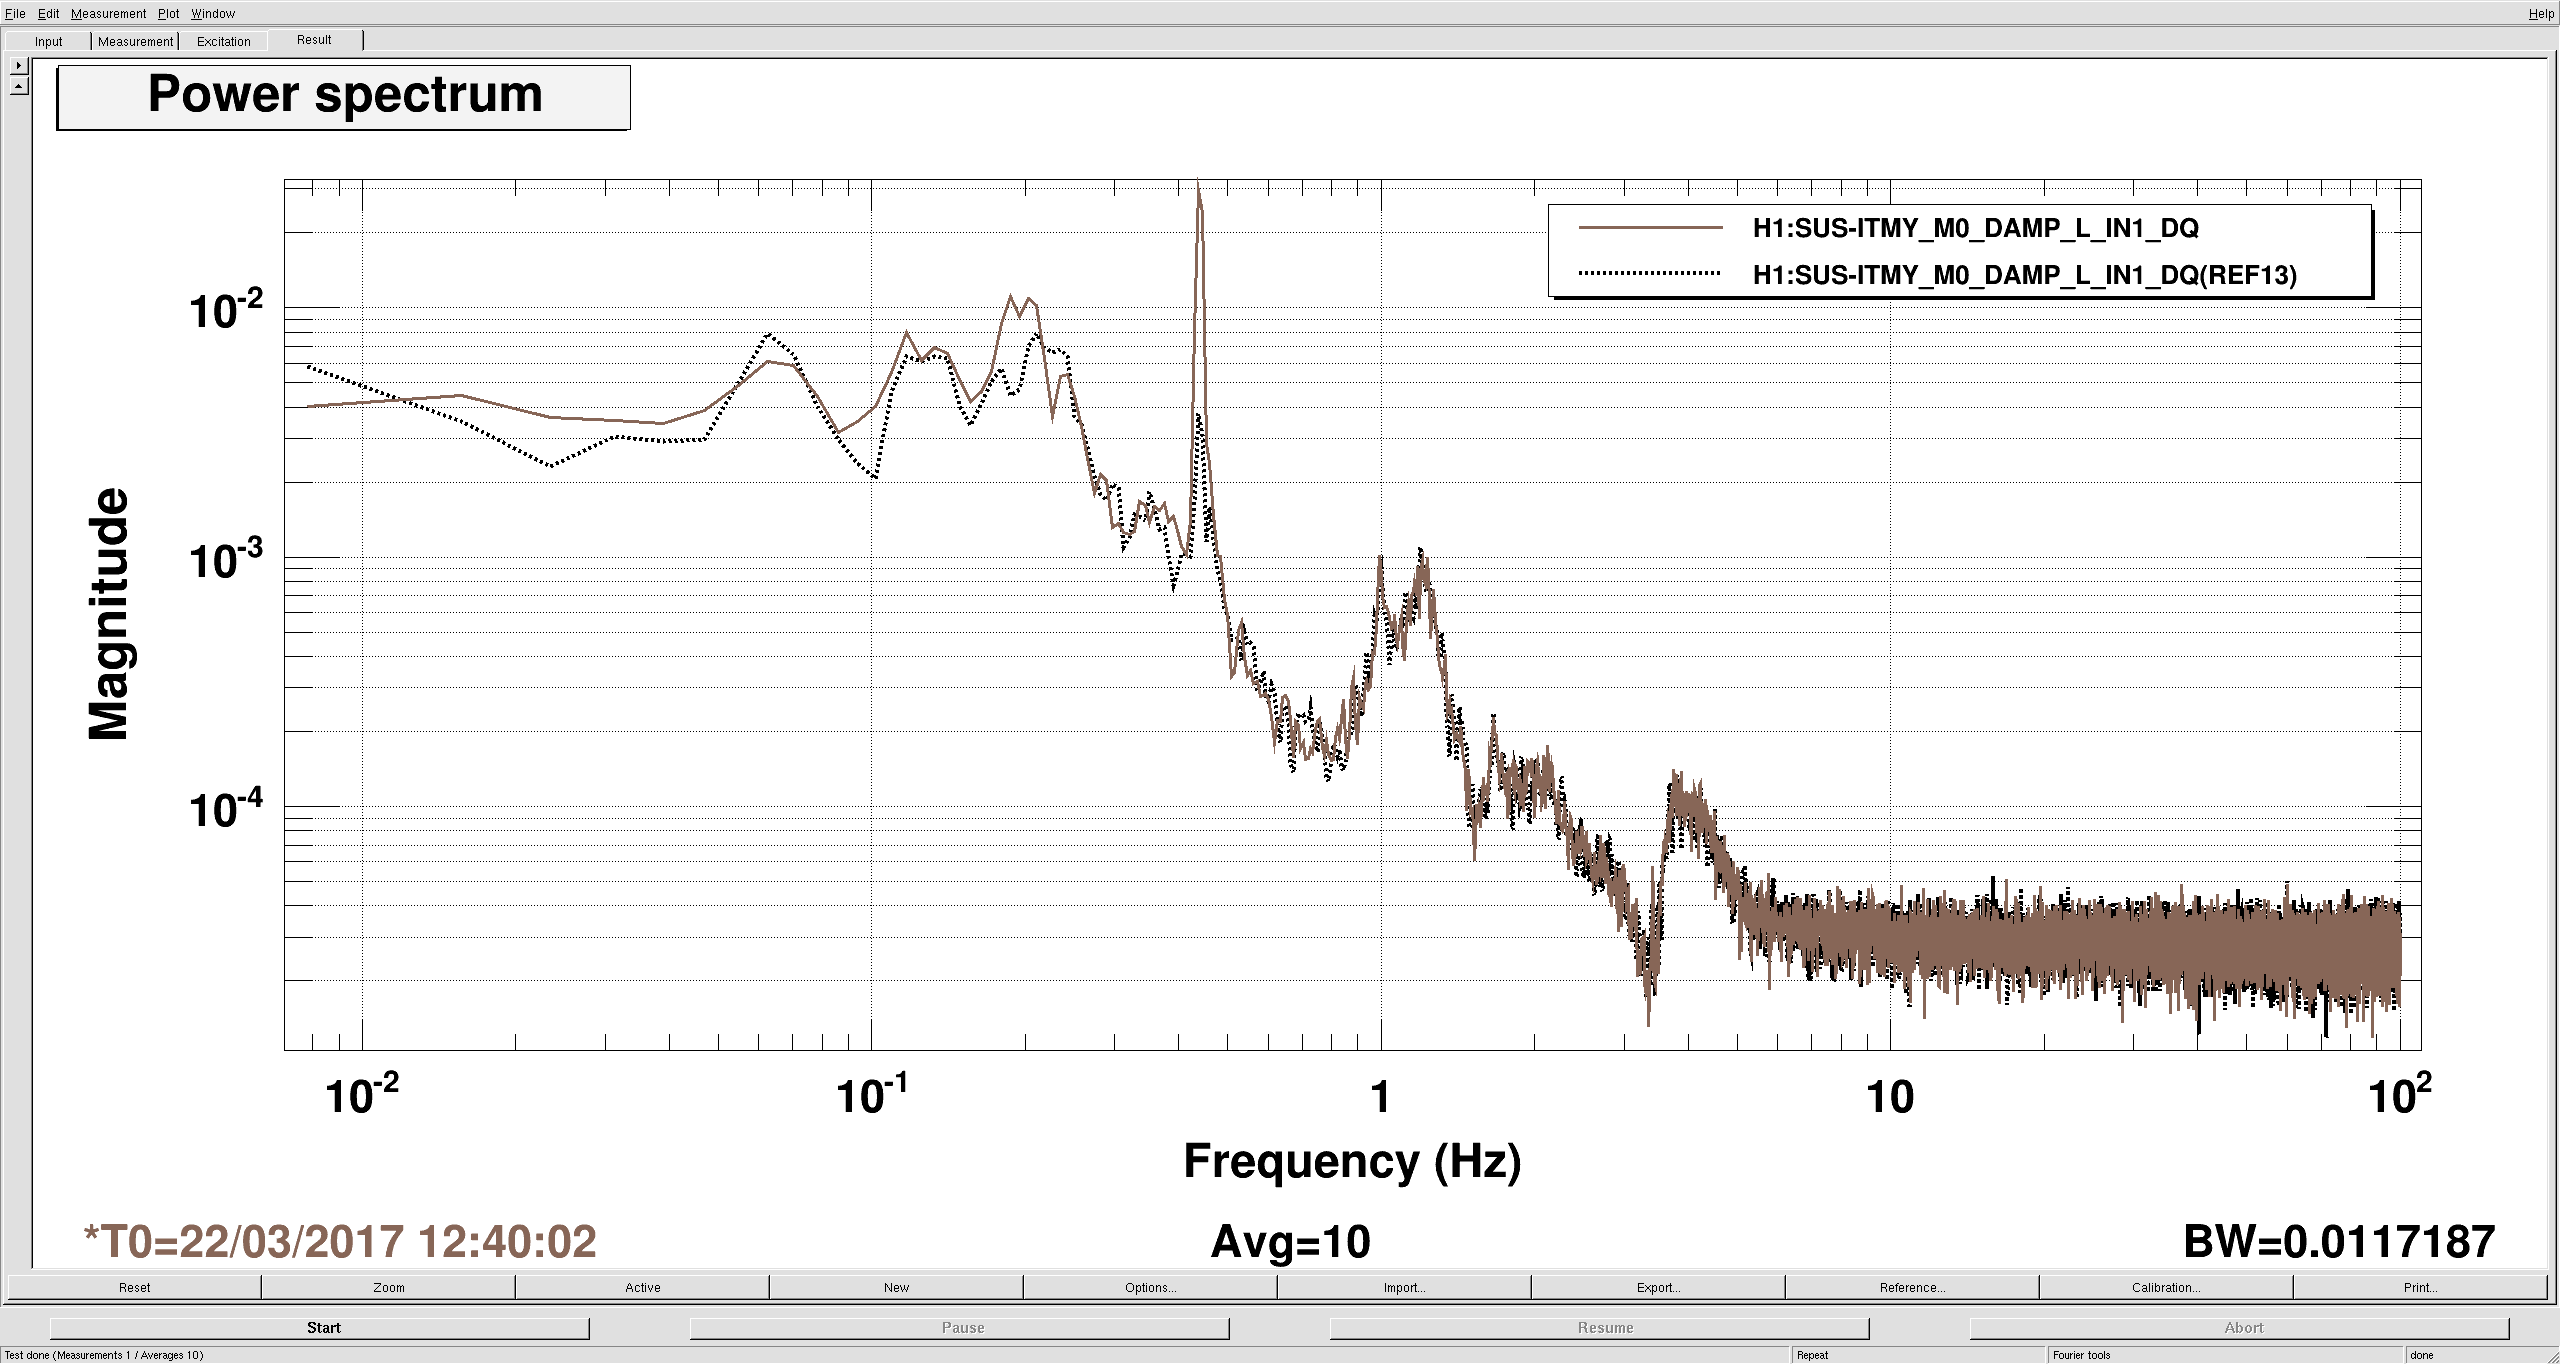
I noticed this morning that the ASC P INMON FOM showed more signal than I was used to seeing. When I looked at trends for the last 4 hours, it looks like they started to ring up around 11:00 UTC, first attached pic. When I took spectra before and after, it was immediately obvious that the quad .43hz mode was higher in the after time. My second plot is before(solid) /after (dashed) spectra of the CHARD/CSOFT P inputs, but DHARD/DSOFT and MICH also see this. Looking at the quad M0 L damp ins shows a similar result, third plot, I just show ITMY(dashed before/ solid after), but all the quads look similar. Not sure what changed, but this also kind of lines up with the drop in range this morning.
Images attached to this report
Comments related to this report
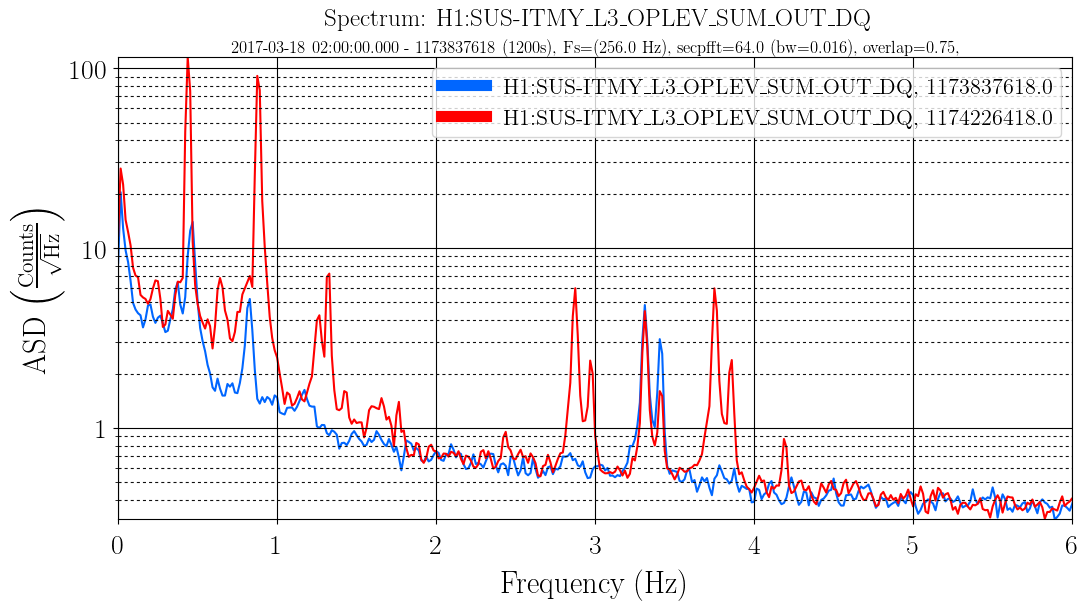
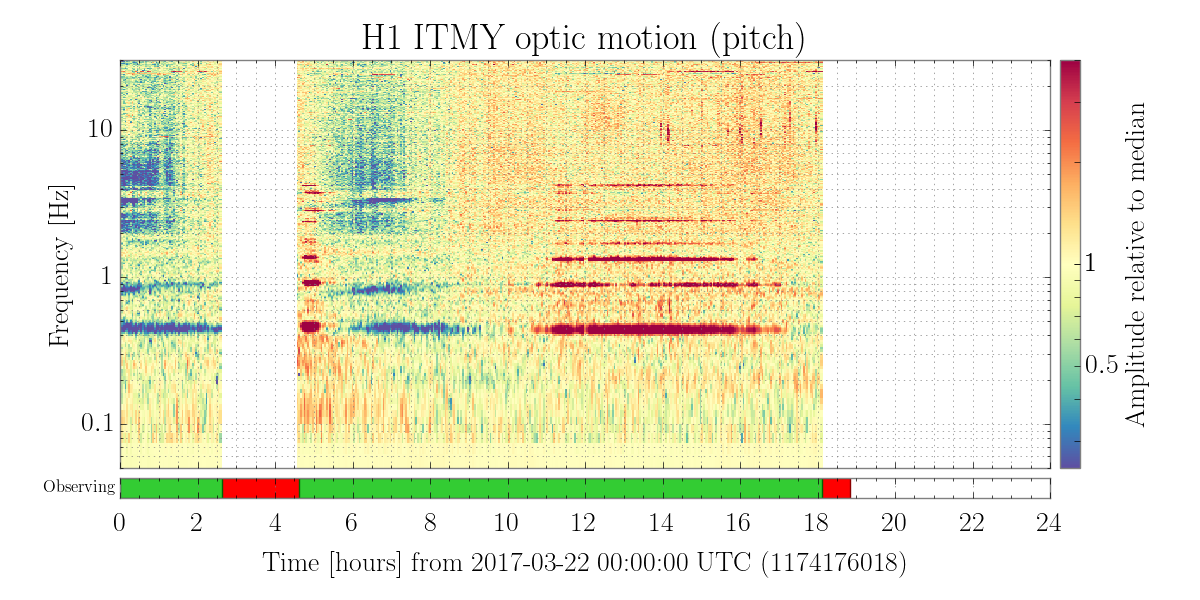
The ITMY oplev has the most suspicious behavior while the longitudinal modes were rung up. All four test-mass oplevs saw the extra motion at 0.43 Hz, but ITMY also saw a number of other modes misbehaving. One might have been the P2 mode at 1.3 Hz, and there were several other peaks that appeared. The ITMY oplev or other part of the ASC control might be a good place to start looking.

Attached is a spectrum of new structures appearing in the sum (blue is a quiet reference), and a spectrogram showing the new peaks appearing in pitch.
Images attached to this comment