jeffrey.kissel@LIGO.ORG - posted 10:36, Wednesday 29 March 2017 - last comment - 14:21, Wednesday 29 March 2017(35184)
Inter-related Problems With CAL Line Upconversion, OMC Alignment Cause Range Drop & Bad Time-Dependent Correction Factors
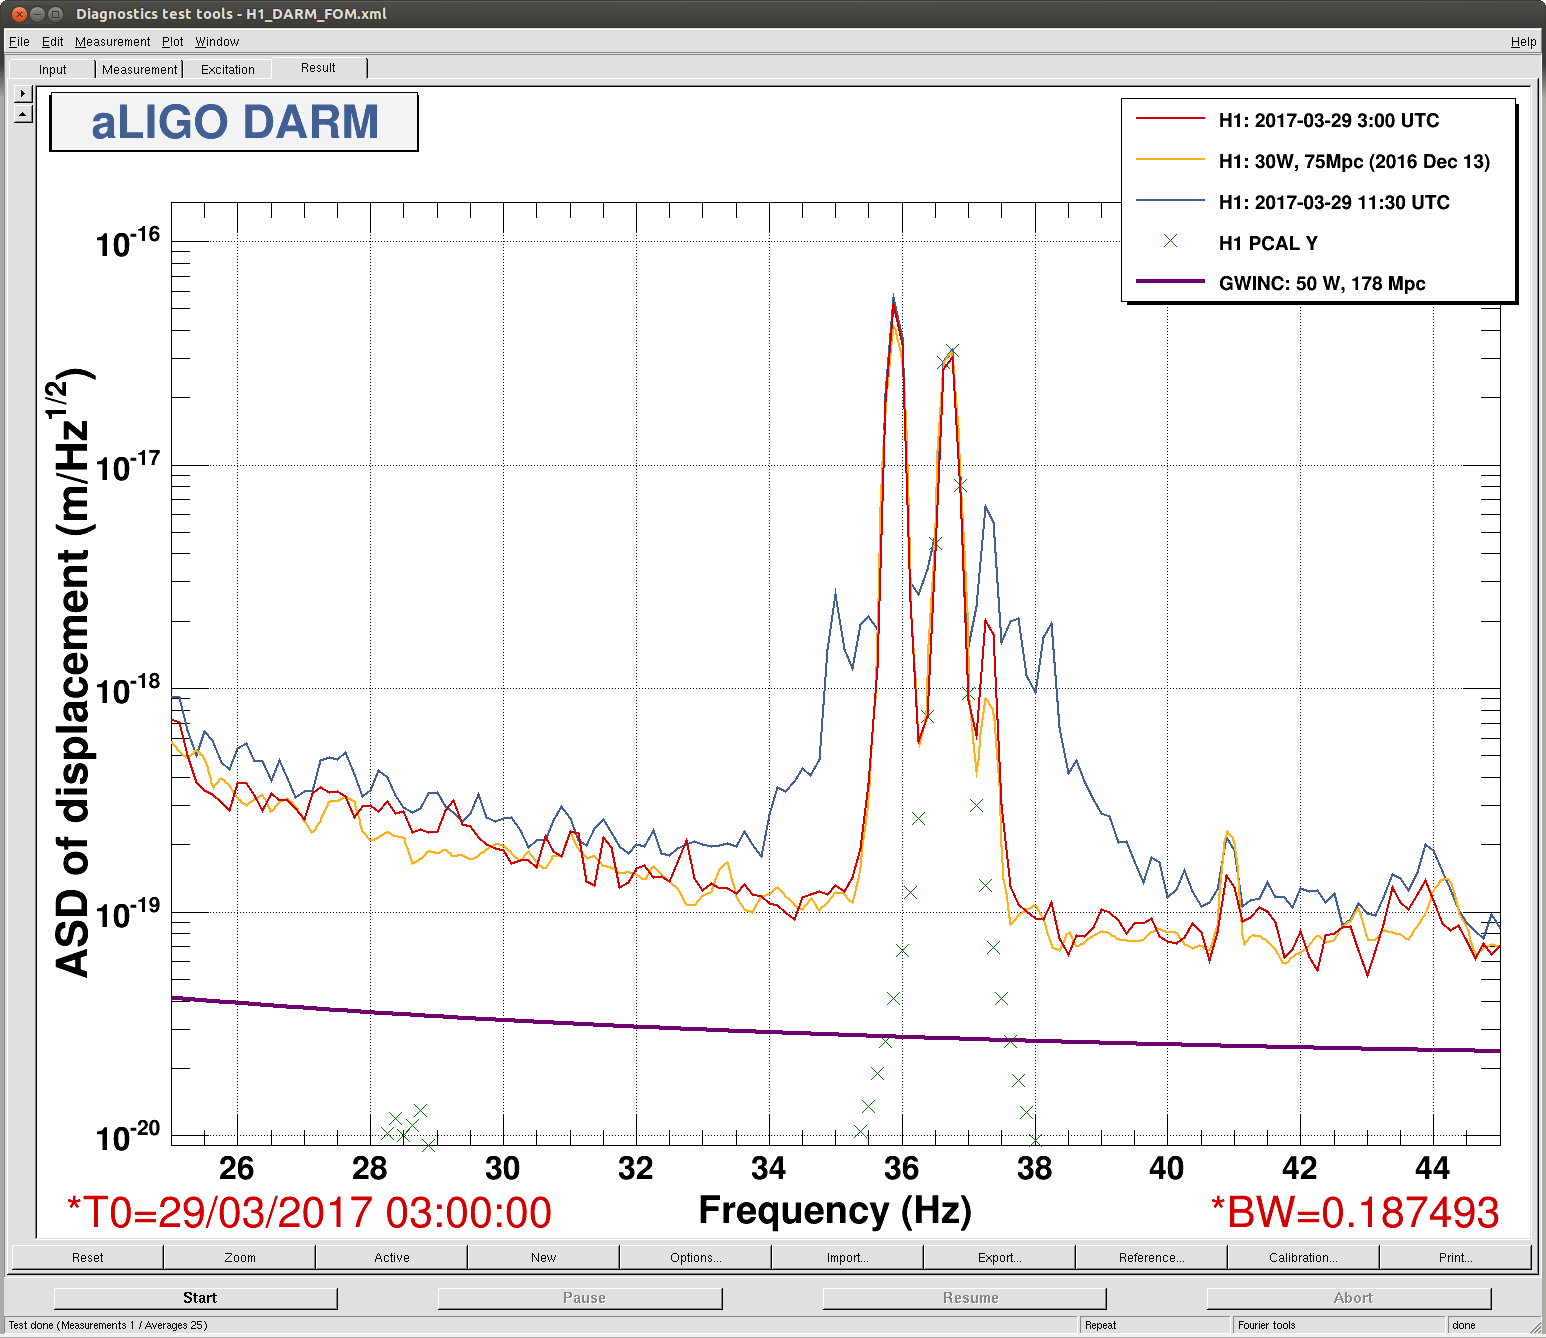
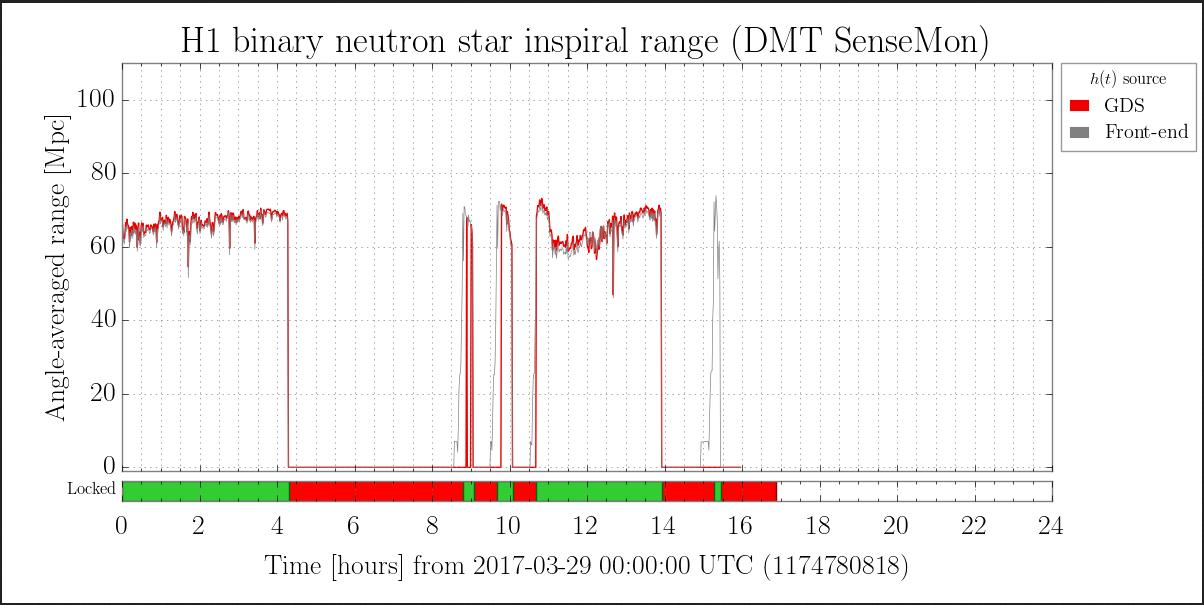
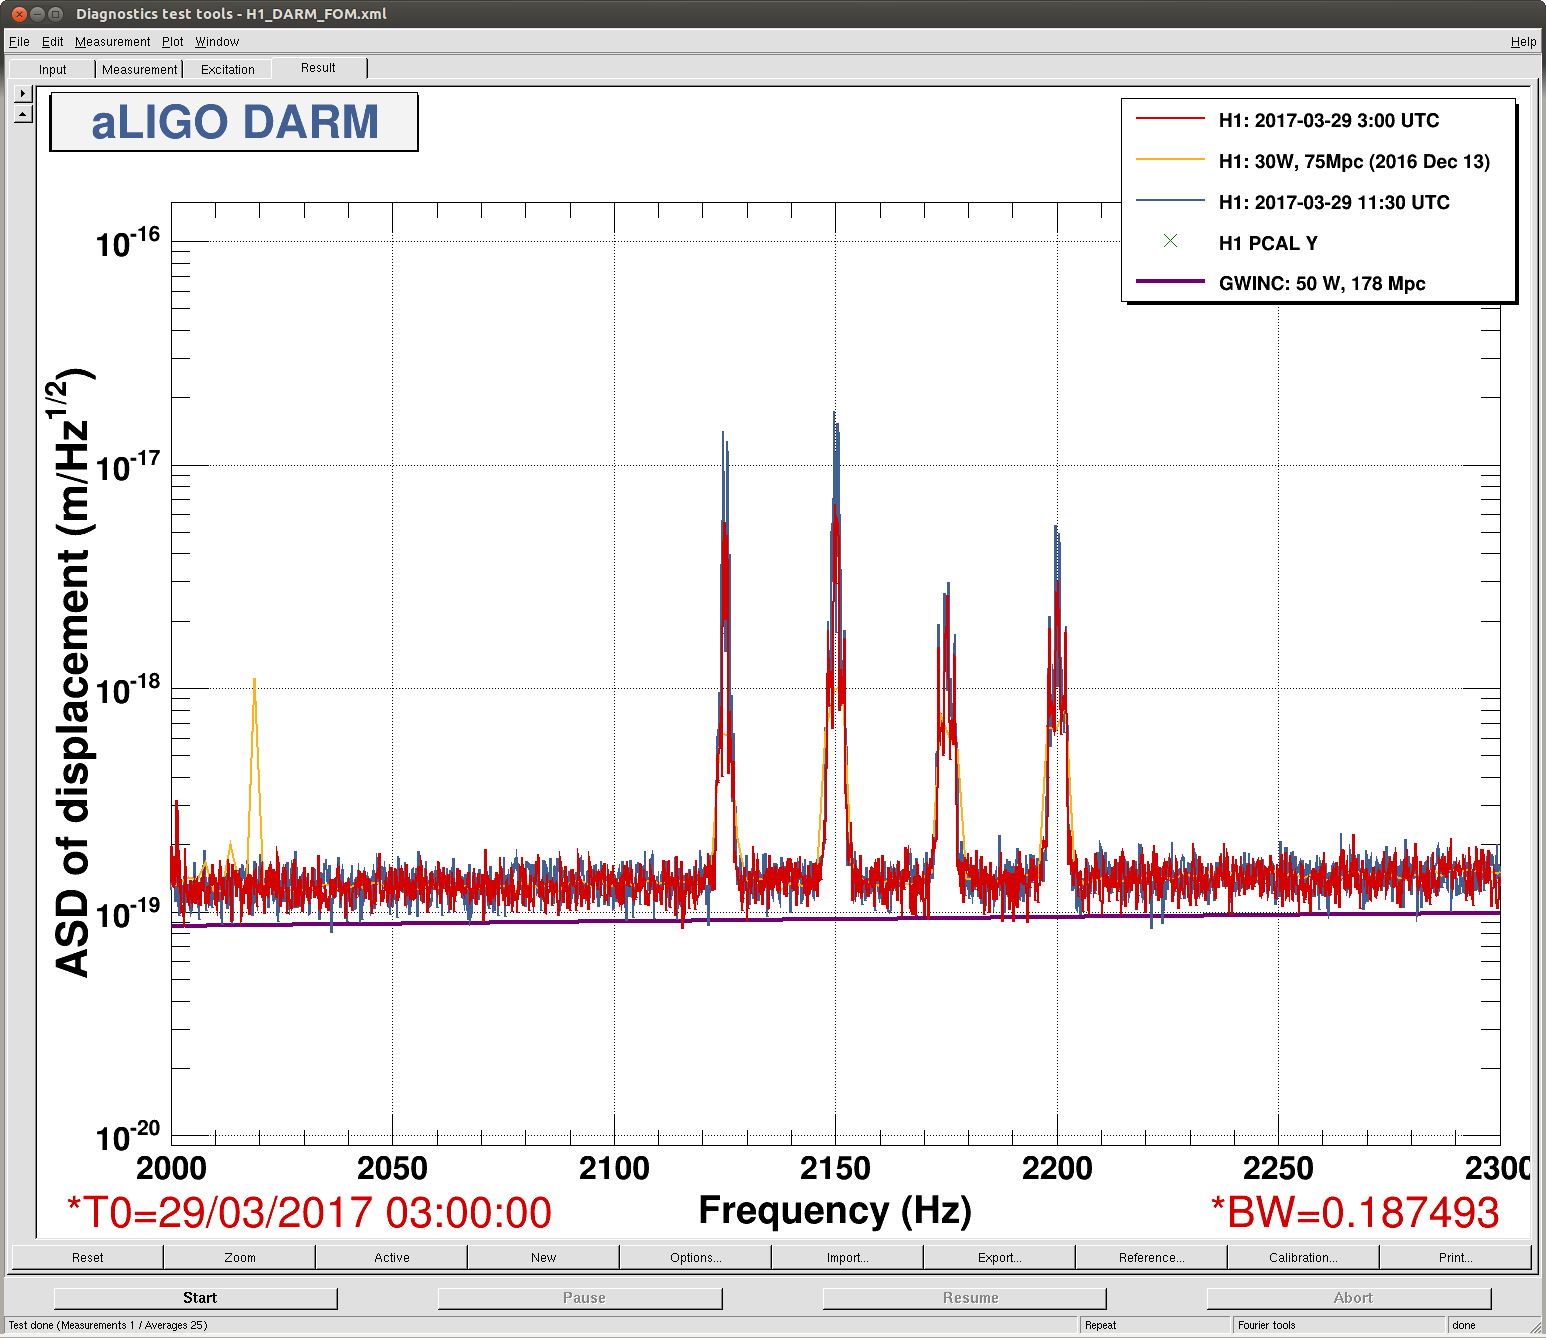
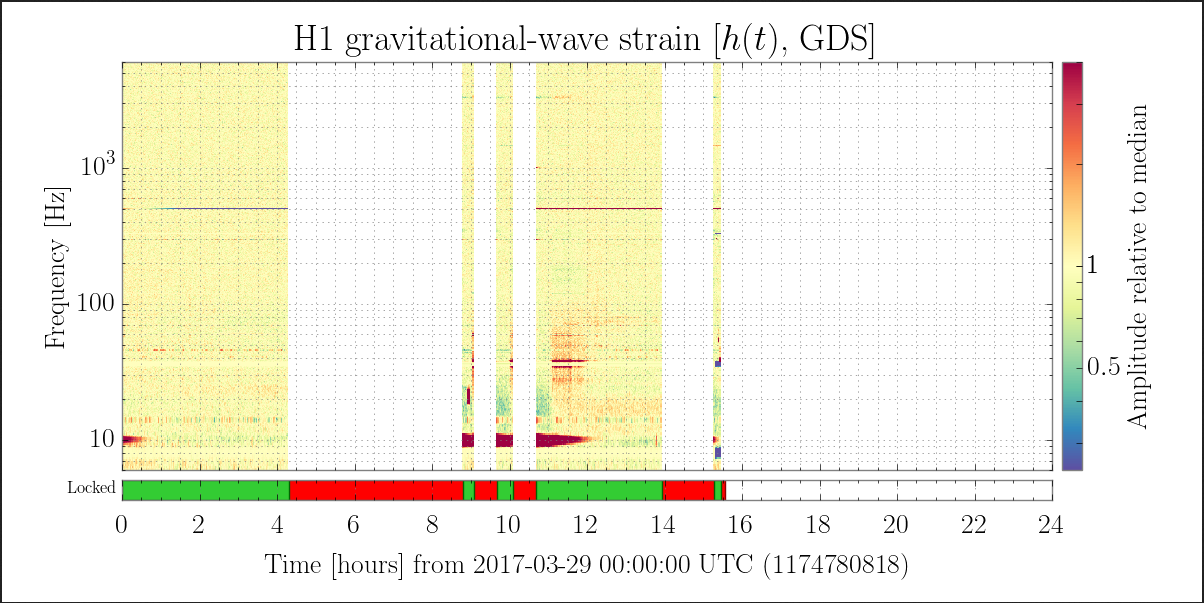
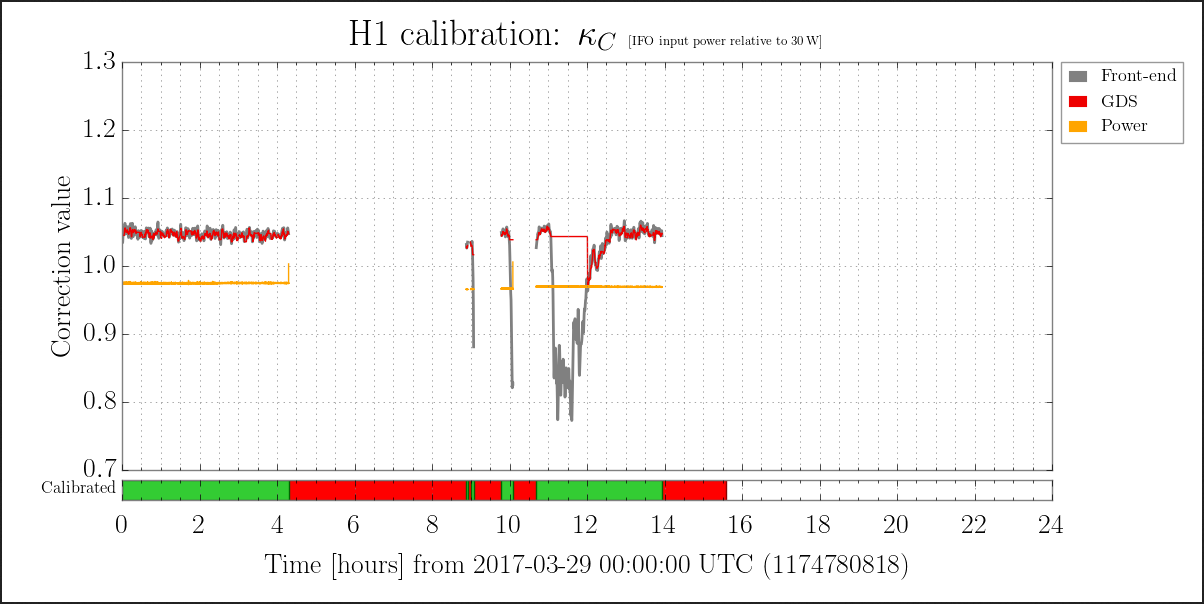
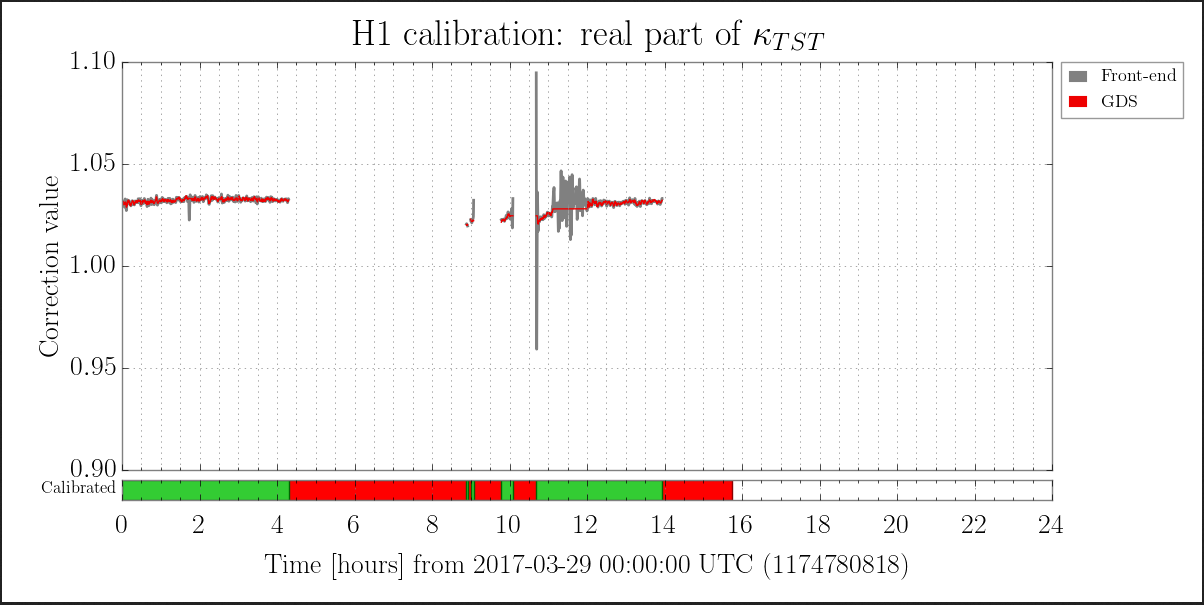
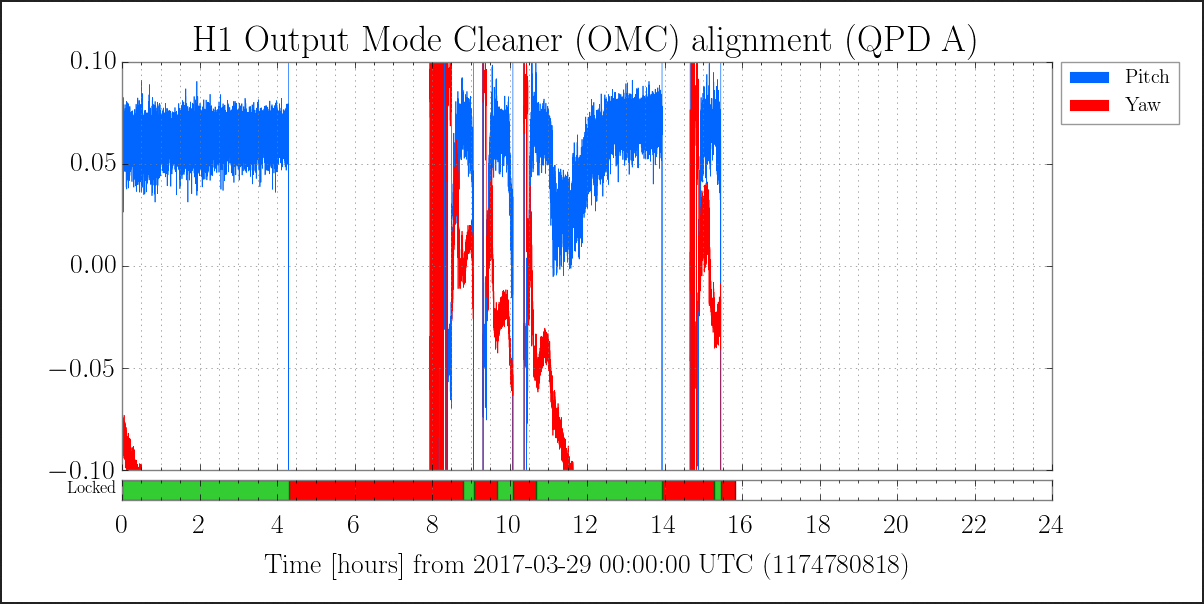
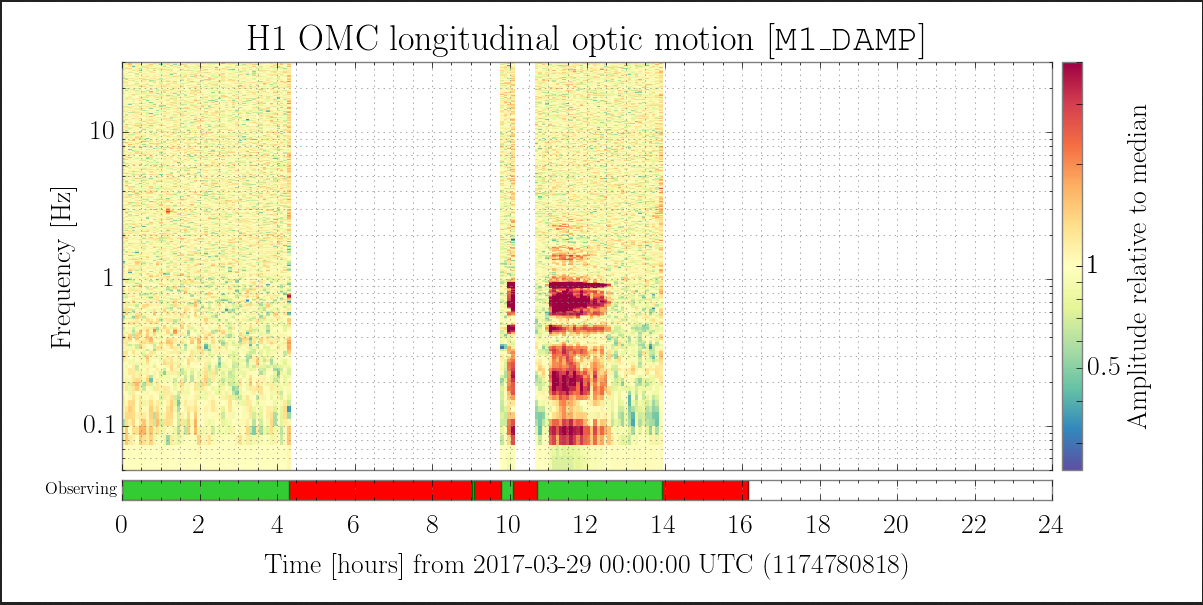
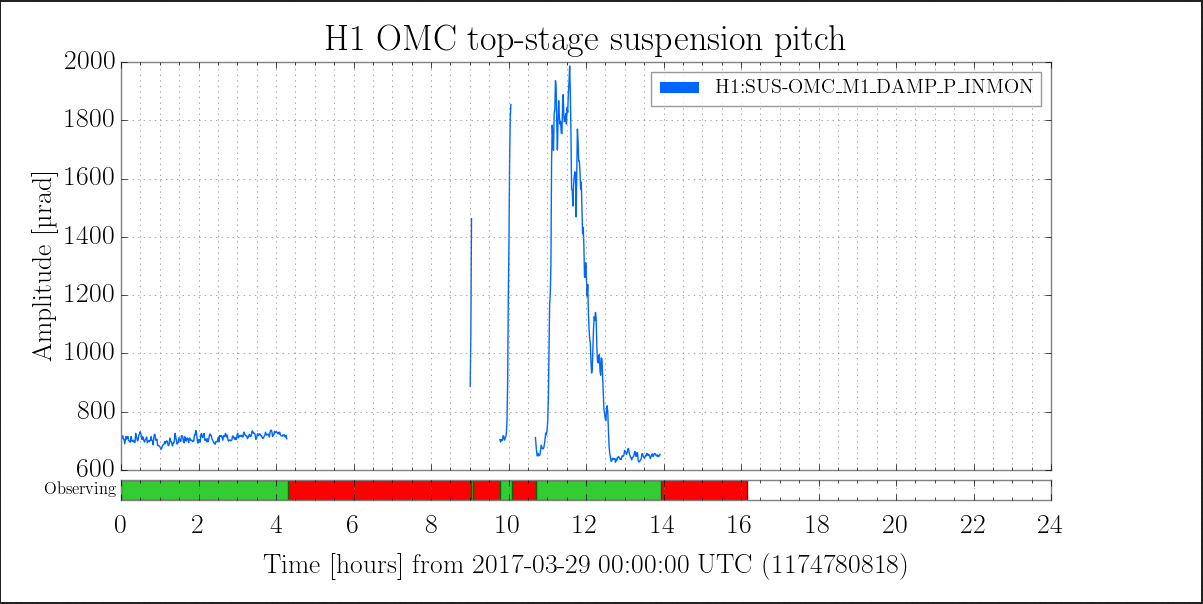
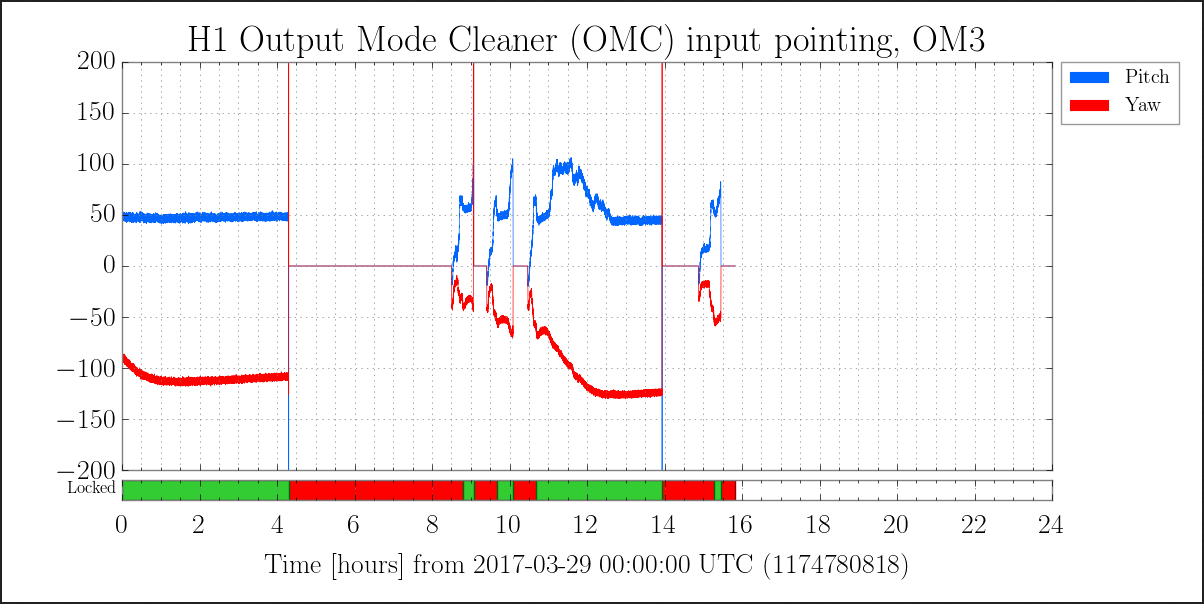
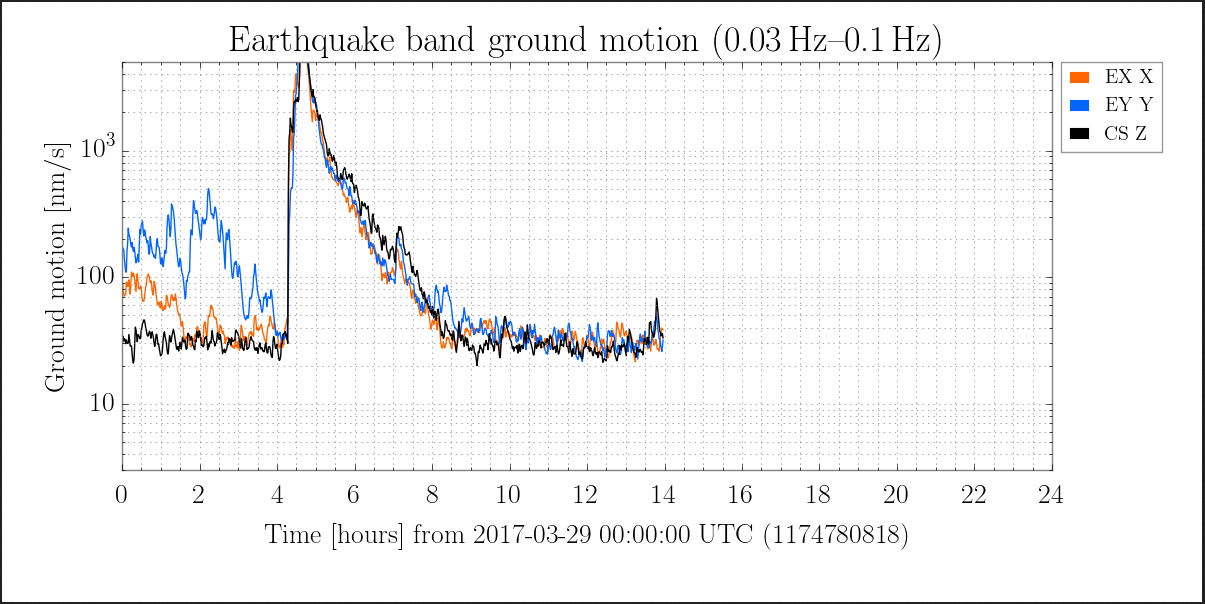
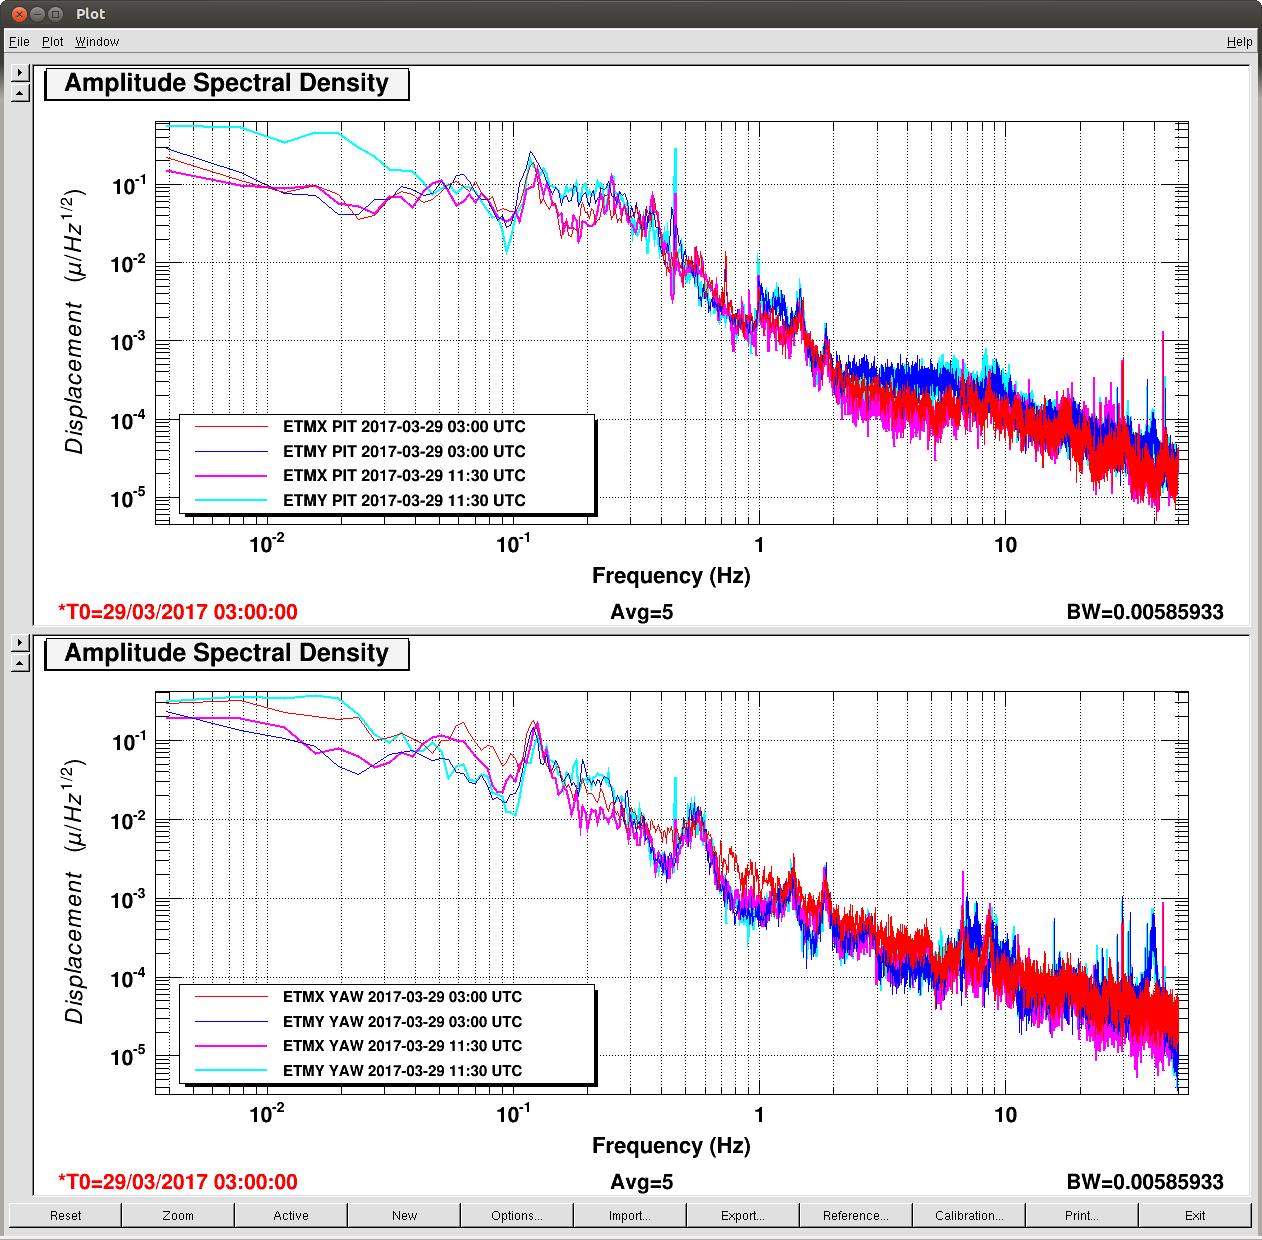
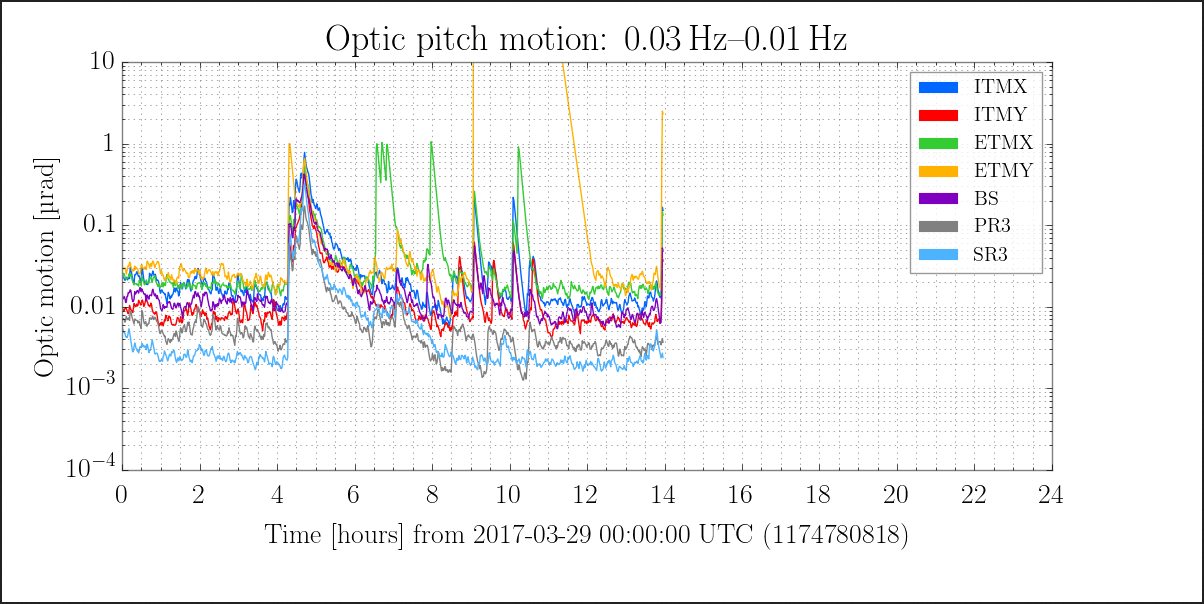
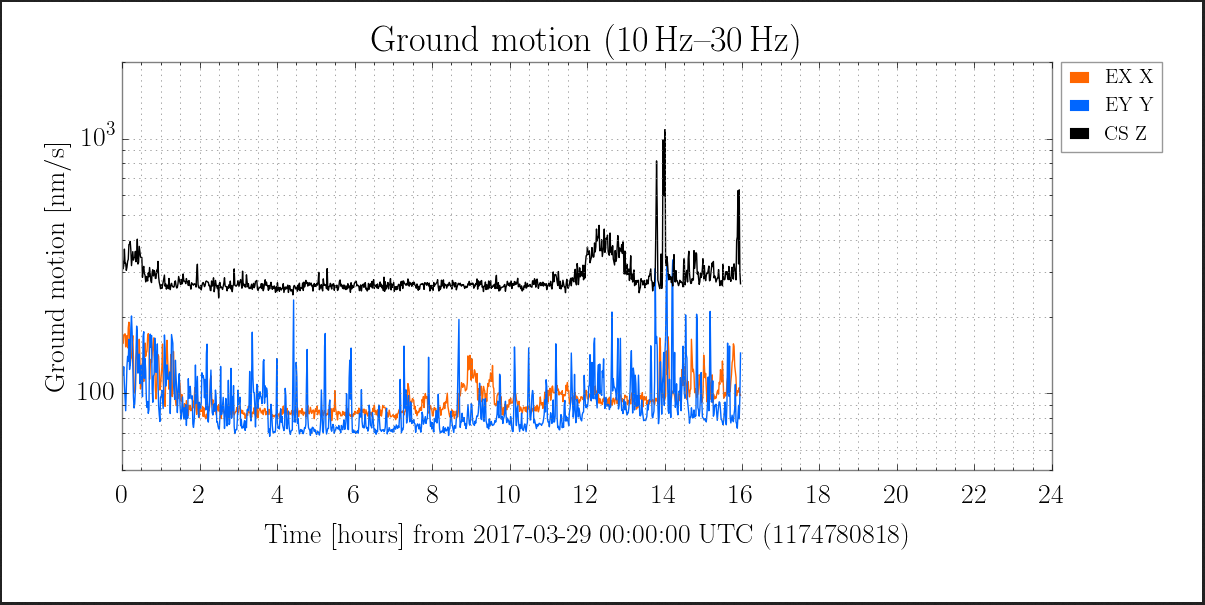
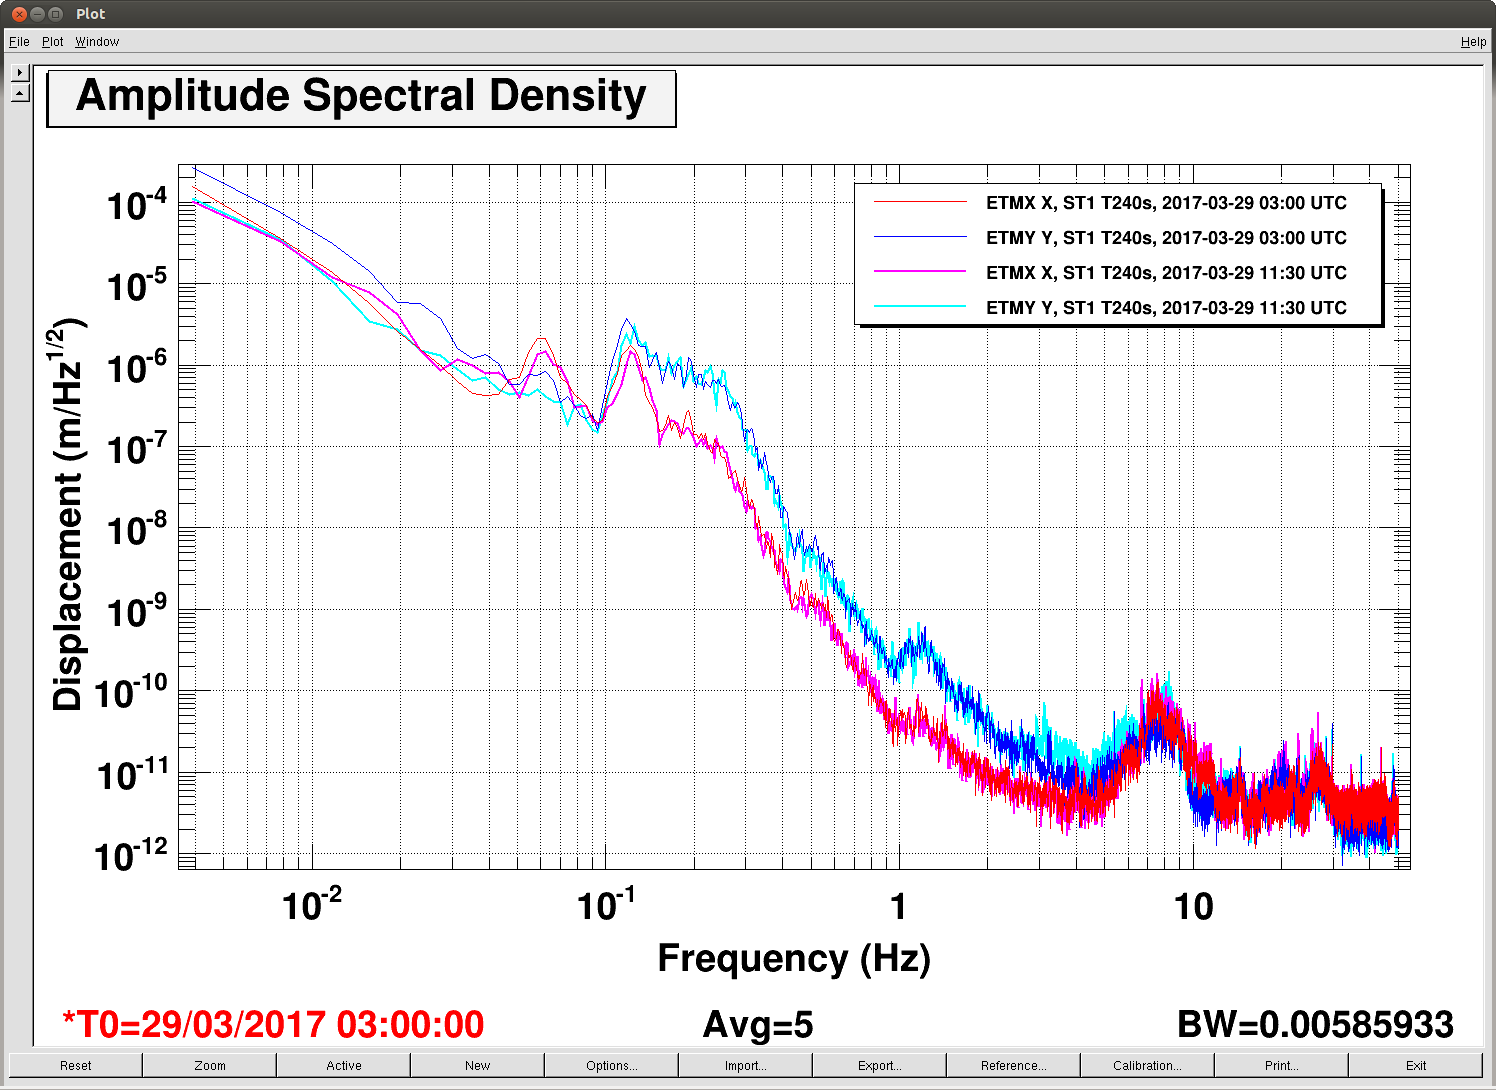
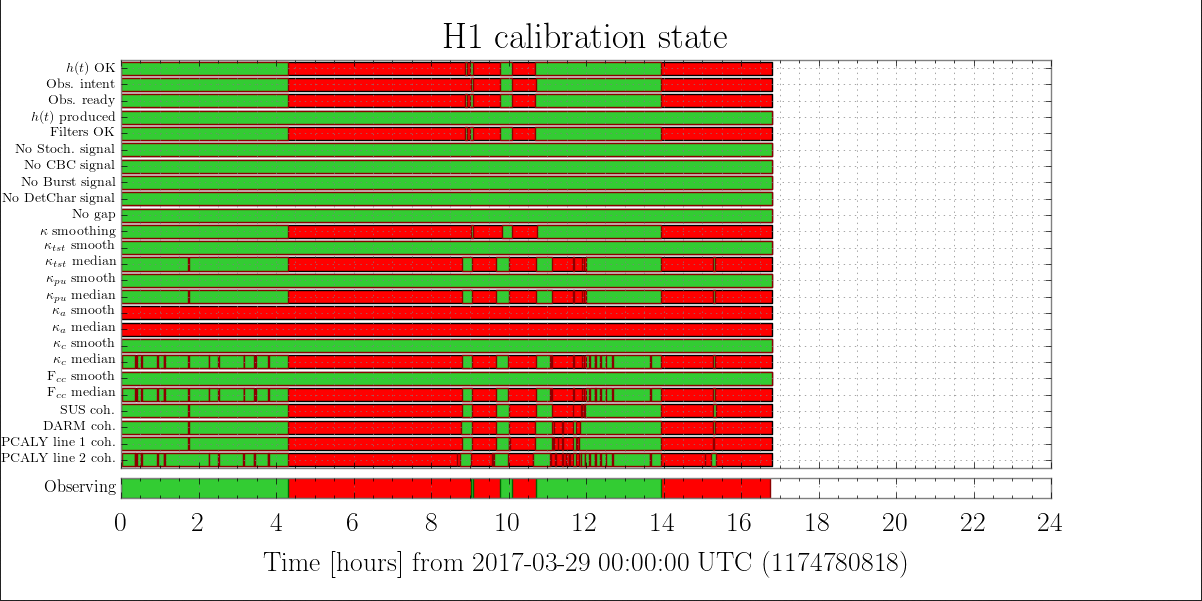
J. Kissel, J. Betzwieser

Patrick had called out that line features the DARM sensitivity around 35 Hz were "broadening and contracting" in a recent lock stretch starting 2017-03-29 11:10 UTC, which impacted the inspiral range (see LHO aLOG 35173). These features are the 35.9, 36.7, 37.3 Hz calibration lines actuated by the ETMY SUS, PCAL, and overall DARM_CTRL, respectively.

What Patrick has seen is classic alignment-related up-conversion, where low-frequency (between 0.05-10 Hz) angular motion mixes with the intentionally, and necessarily loud calibration lines and creates side-bands on the CAL lines that mirror the ASD of angular motion. We've been anecdotally/casually/qaulitatively seeing this several times in the recent past.

This time, however, it seems to have gone so far as to pollute the calculation of the time-dependent correction factors, which are applied to the astrophysical output -- namely the relative ESD/TST stage actuation strength change ("kappa_TST"), and the relative optical gain change ("kappa_C"). Since the data were so noisy around these lines (the SNR dropped from the typical ~500 to less than 10), this dropped the coherence between excitation and DARM, and increased the uncertainty beyond our pre-defined thresholds for good data.

As such I recommend this data stretch to be flagged as garbage by DetChar, from where bits 13 & 15 ("kappa_TST median" and "kappa_PU median") of the H1:GDS-CALIB_STATE_VECTOR are red during this observational stretch.

I attach good deal of plots to help support the interrelated case between
    - The DELTAL_EXT sensitivity of the detector, zoomed in around both the 2150 Hz OMC dither lines and CAL lines
    - OMC Dither Alignment Control (whose error signals are informed by 4, evenly spaced lines between 2125 and 2200 Hz)
    - OMC SUS and OM3 alignment
    - DHARD Pitch Control
    - The noisy kappa_TST and kappa_C
and then other plots that show it's NOT causally related to
    - Earthquakes (the recent EQ at 4:30 UTC was done by then)
    - ETMY Optical Lever Excursions (ETMY's optical lever went off into the weeds, but what's shown in the BLRMS is just the ring-down of the low-pass filter)
    - 1-30 Hz GND Motion (the increase happens *after* this alignment excursion)
    - Large differential motion of the ETMs (ETMX X and ETMY Y show that same ISI ST1 performance at 11:30 UTC and 03:00 UTC which are bad and good times, repectively)

I don't have any speculation as to which of the inter-related symptoms are the actual cause of the problem, and/or I don't have a clue as to why the OMC dither line heights are so much louder during the bad time. I'll ask around for speculation from other members of the commissioning team.
Images attached to this report
Comments related to this report
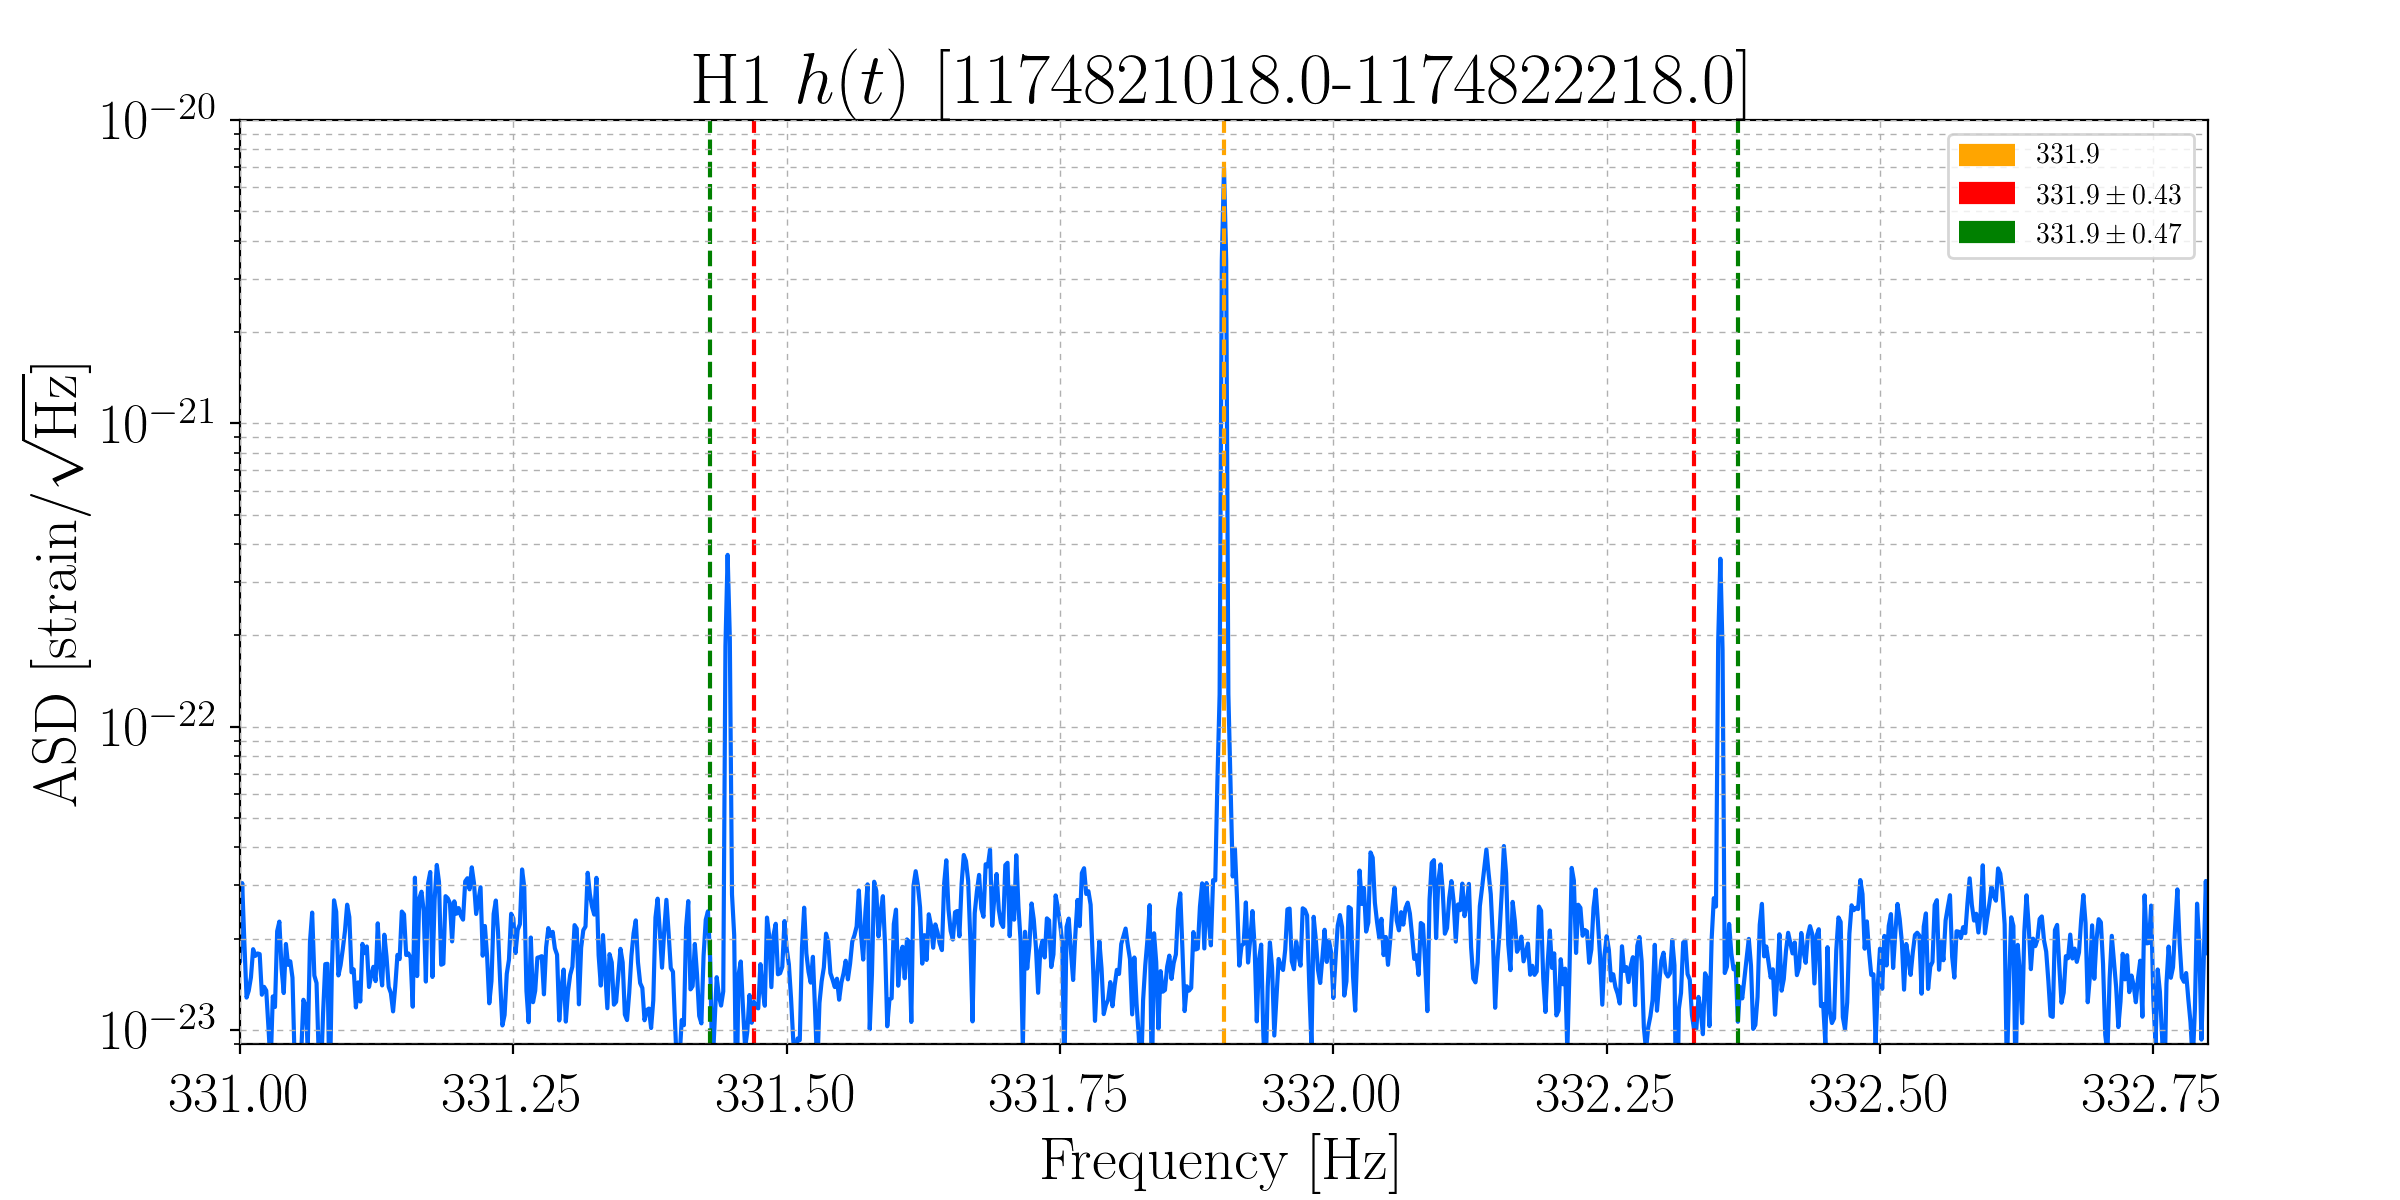
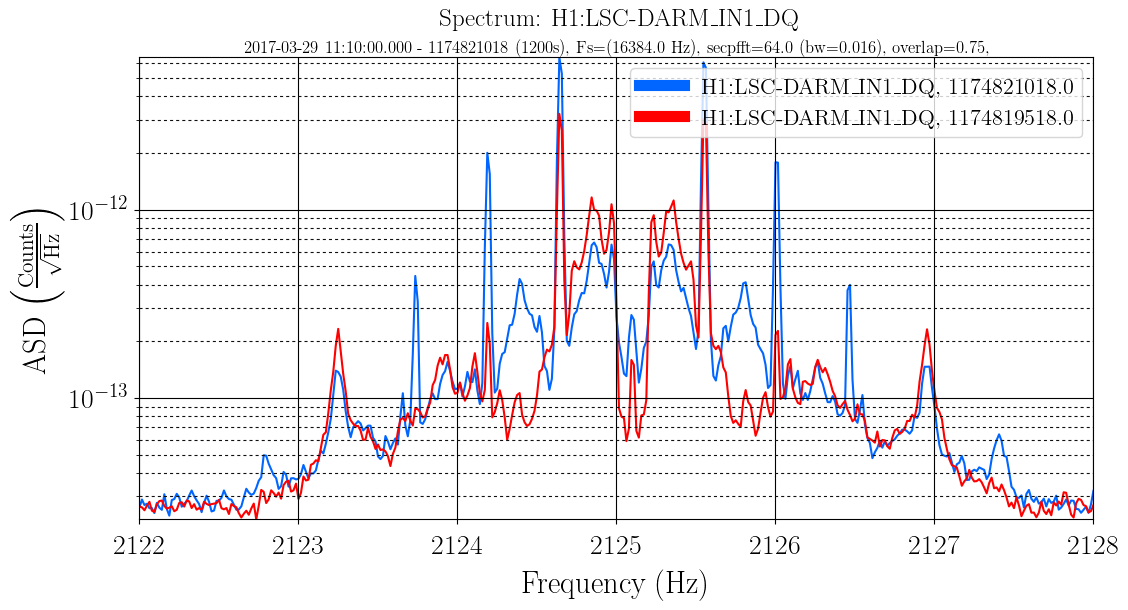
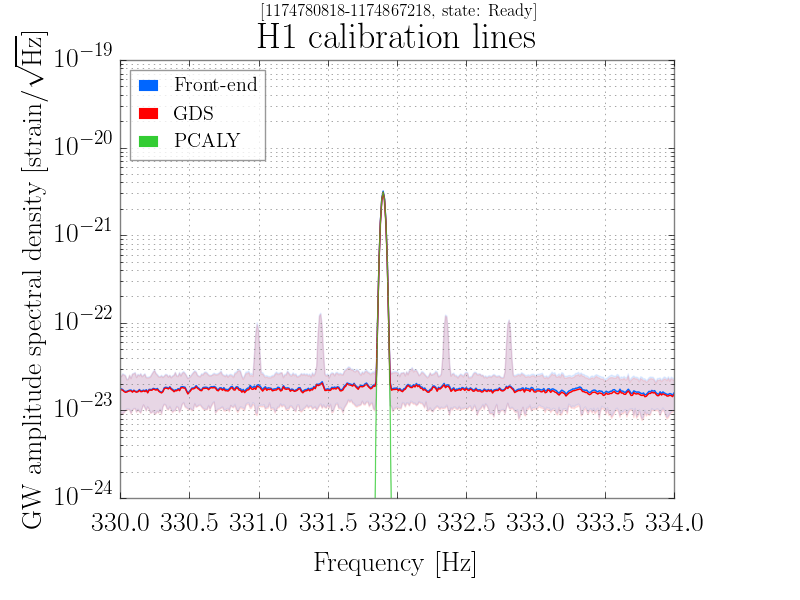
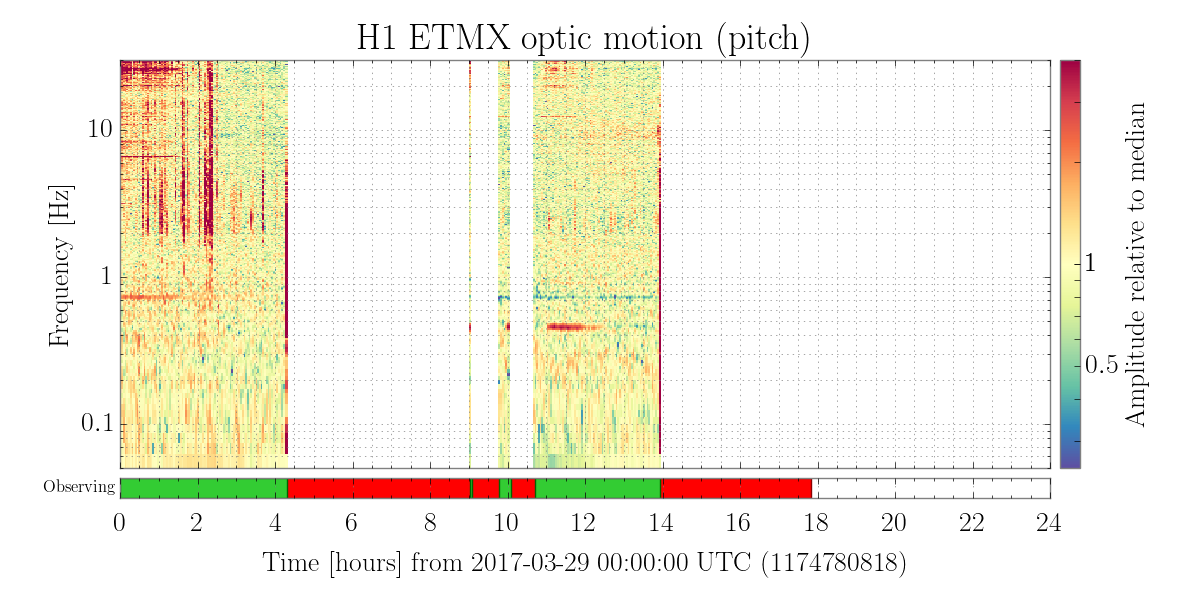
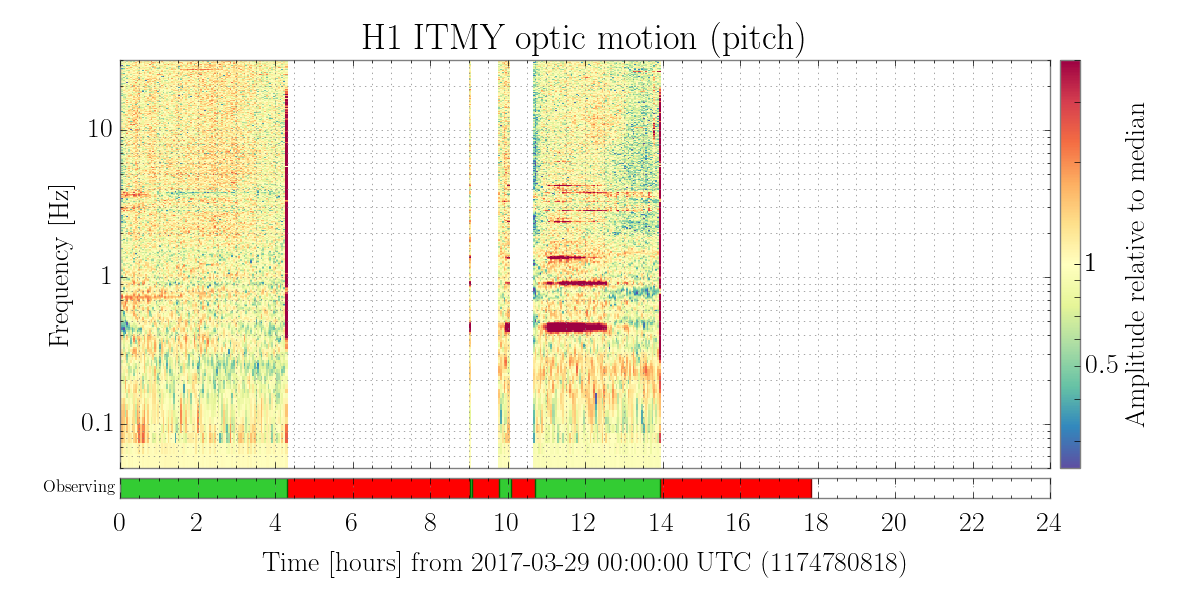
The difference in the calibration lines and the OMC dither heights seems to be mostly an increase in sidebands at about 0.4 Hz.

The first attachment is a zoomed in spectrum of the OMC dither at 2225.1 Hz compared to the time just before the bad time. The dither line itself isn't very visible in DARM (since the alignment should suppress it), the difference in the feature around that frequency are sidebands spaced by about 0.4 Hz. The second attachment is the 331.whatever Hz calibration line, which has similar sidebands. I think the same is true for the three near 30 Hz, but they overlap and it's hard to sort out.

At the same time, the test mass oplevs all show an increase in the 0.43 Hz pitch mode. Attachment three is the ETMX spectrogram. There's an increase in angular motion on other optics, like the OMC, especially at this frequency and its double. But I would guess that they're just following the motion of the test masses.

I'll point out again that the ITMY oplev signal looks very strange (final attachment). Could something wrong with the oplev damping ring up the 0.43 Hz mode?
Images attached to this comment
@Andy, DetChar, et. al

I think you may be on to something, but I'm not sure I would call the ITMY optical lever the *cause* just yet per se. Recall that is radiation pressure to ~0.4 Hz pitch mode coupling in the arm cavities of the IFO (G1600864), so the ITM optical lever may just be another witness to the problem (i.e. something goes bad that kicks up the instability and ITMs see it, and the Oplev Damping / ASC / LSC system tries to follow / control it) -- and the signals may look particularly bad (i.e. the harmonics) because the optical lever spot is clipping, or on the edge of the QPD or something. I agree that it's getting worse (this problem is happening more frequently), though.

I say this because -- continuing to browse around the summary pages, I see two other recent examples of this whole inter-related badness that impacts to 35 Hz calibration lines:
    2017-03-24 from ~01:30 - 2:45 UTC
        BNS Range
        DARM Spectrogram
        35 Hz CAL Lines and harmonics
        kappa_C TDCF
        DHARD Control
        OM3 Pointing
        Beam Alignment into the OMC Cavity
        ITMY Pitch via Optical Lever

    2017-03-22 from ~4:45 - 5:00 UTC
        BNS Range
        DARM Spectrogram
        35 Hz CAL Lines and harmonics
        kappa_C TDCF
        DHARD control
        OM3 Pointing
        Beam Alignment into the OMC cavity
        ITMY Pitch via Optical Lever

But I see *tons* of examples of the ITMY bad news that don't seem to have similar effects over the past several months.

(PS it would be *super* awesome if we could create a custom summary page with all of the above graphics / cross-coupled info; it'll save us from concatenating plots from 15 pages and lend it self to better pattern recognition).

The other thing, is that -- at least from what I've found and with what precision I can get on a 24 hr trend from the summary pages (which is not precise at all), the ITMY optical lever problems seem to come and go slowly, where the OMC alignment, CAL line problems, and Range decay all seem to happen a bit more suddenly.

Also -- how fine a resolution spectra are you gathering on this? Can you resolve whether the harmonics you see are 0.43 vs 0.47 Hz? The spectra / spectrograms on the summary pages don't have this kind of precision, and as far as I know, there's no cursor feature on LIGO DV, so I worry that you're colloquially referring to the wrong mode, which may be confusing the study -- especially since these modes move around with Sigg-Siddles radiation pressure stiffening / softening (see, e.g. G1600509).

Did we see any noticeable change after Jason swapped out the ITMY laser on March 7th (see LHO aLOG 34646)? I couldn't find any conclusive correlation between the swap, the above mentioned calibration line shoulder / harmonics, and the badness of ITMY after browsing through the summary pages from Feb 1 to today.
Jeff, as requested, find attached a 2mHz-resolution FFT, with appropriate markings for 0.43 and 0.47 Hz side-bands. It looks like the side-bands are actually 0.454 Hz, if that means anything to anybody.
Images attached to this comment